✍️ Maverick Charts – Stocks & Bonds – October 2023 Edition #12
Dear all,
with October ‘books closed’, your monthly Top 20 Stocks & Bonds charts pack from around the world + 5 Bonus! Before that, from the legend Warren Buffett:
“The stock market is a device to transfer money from the ‘impatient’ to the ‘patient’.”
= having a business owner mindset in stocks & not moving ticker symbols, patience, opportunistic & thinking long-term is key for an investor. For a trader, different game.
-
US Stocks & Bonds in 2023: stocks very good, bonds down except short term ones
-
Nasdaq 100 (QQQ) with a new bull market, +31.7% in 2023 alone
-
S&P 500 (SPY) printing at the long-term average, 9.8%
-
SHV (short-term government bonds 1-year or less, cash proxy) +4%
-
IEF (intermediate-term government bonds 7-10 year maturities) -4.2%
-
TLT (long-term government bonds 20-year+ maturities) -13.5%
-
AGG (investment grade: treasuries, corporate, MBS, ABS, munis) -2.5%

-
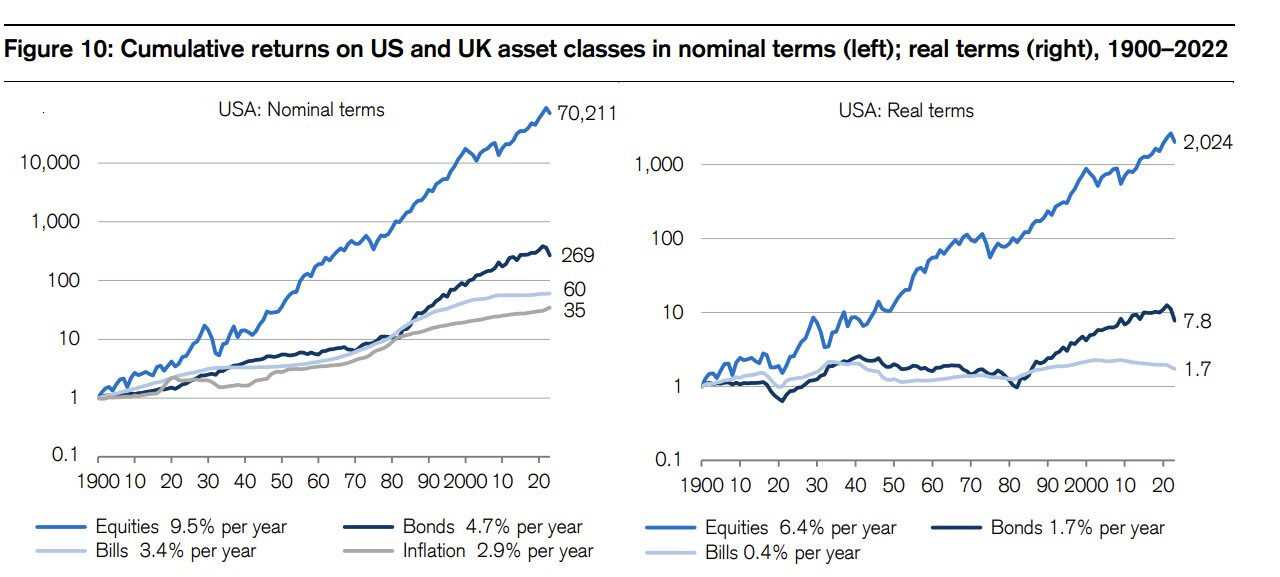
Zooming out: 120 years of returns for Stocks, Bonds, Bills (and inflation rate) in the world’s leading capital market, US! Specifically, 1900-2022:
👉 Stocks: 9.5% per year, Bonds 4.7% per year, Bills 3.4% per year (Inflation 2.9%)
👉 an initial investment of $1 grew to $70,211 in nominal terms by the end of 2022. Long bonds & Treasury bills gave lower returns, although they beat inflation. Their respective levels at the end of 2022 are $269 and $60, with the inflation index at $35
👉 in real terms: 6.4% per year for equities, 1.7% per year for bonds and 0.4% for bills
-
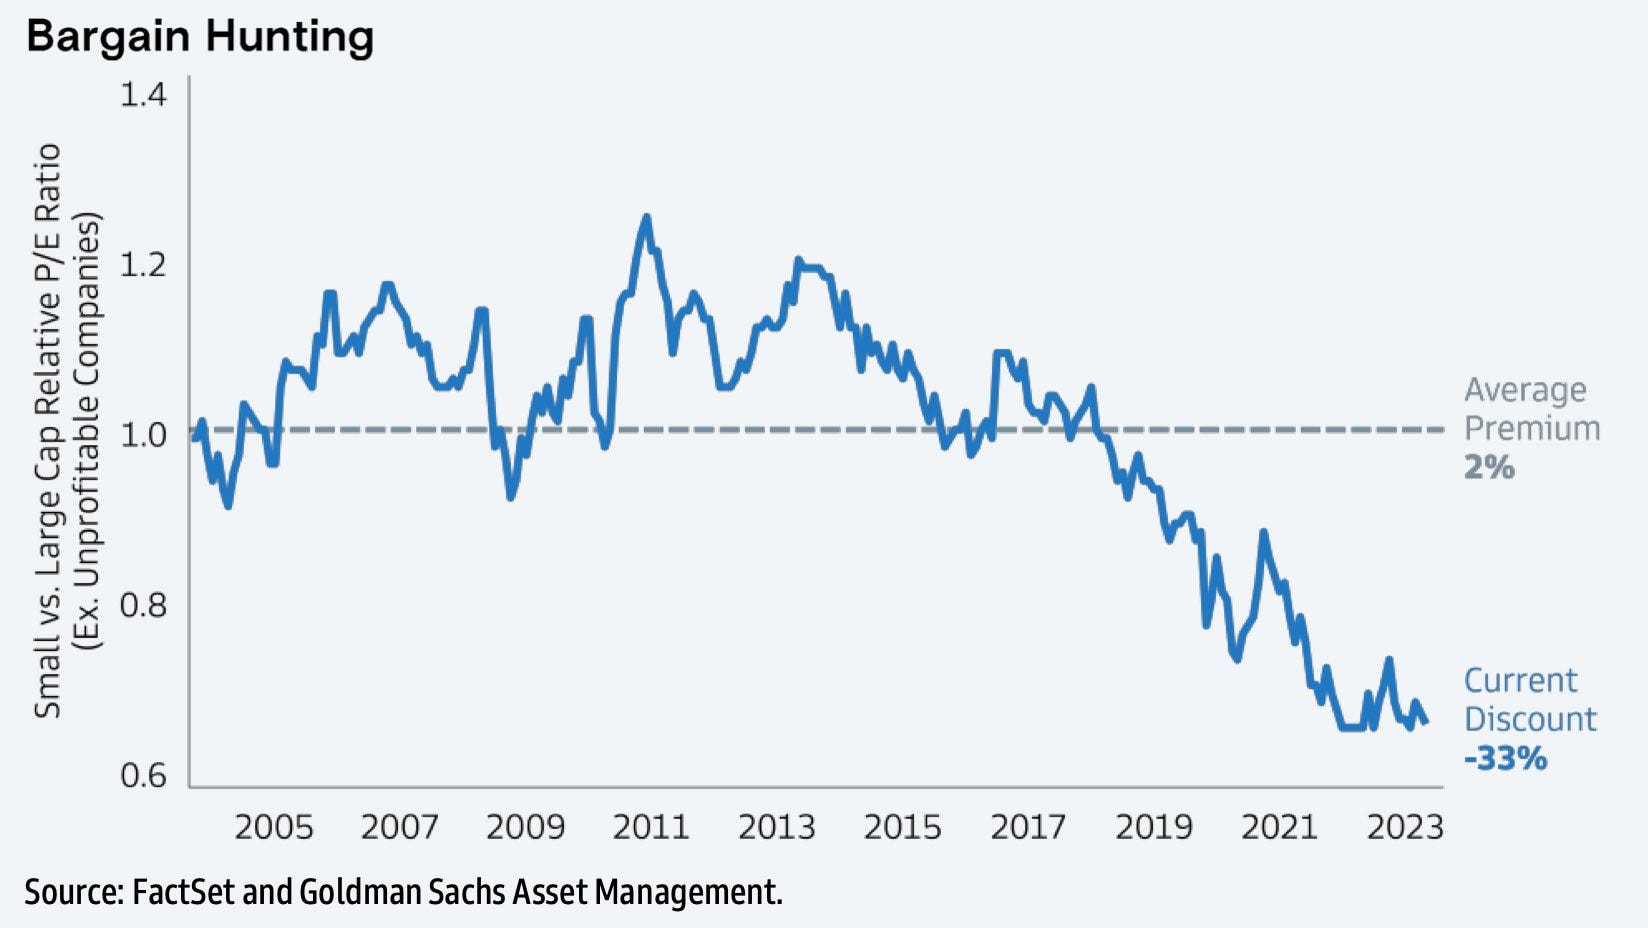
A frequent question I get is, ‘where should I look for bargains in stocks these days?’
I will never say as ‘advice’ to anybody ‘do this or that’ (wrong to do on many fronts), but I can say where I will focus in the next quarters and years: US, Switzerland & Europe overall Small caps:
👉 US wise, small caps is a good place for bargain hunting: relatively to large-caps they look quite cheap trading at a 33% discount to the S&P 500
👉 note also how the long term (20-year) average premium has been 2%, hence the potential in the small caps world is there imho
N.B. US, Swiss & European small caps (among others) will be covered in detail in the Full Equity Research section: maybe 1-2 this year, likely in 2024 given time intensive…
-
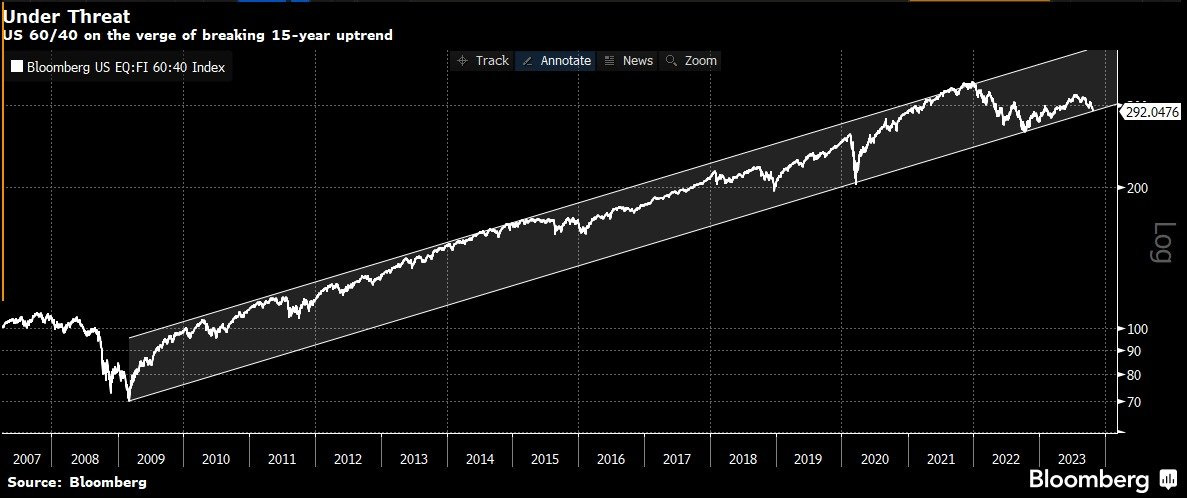
US 60/40 portfolio (stocks & bonds) on the verge of breaking the 15-year uptrend
Two key thoughts from my side:
👉 if it does break the support line, more selling = rather a nice buying opportunity
👉 3-7-10 years ahead it shall do quite well … 2022 was a big negative outlier
-
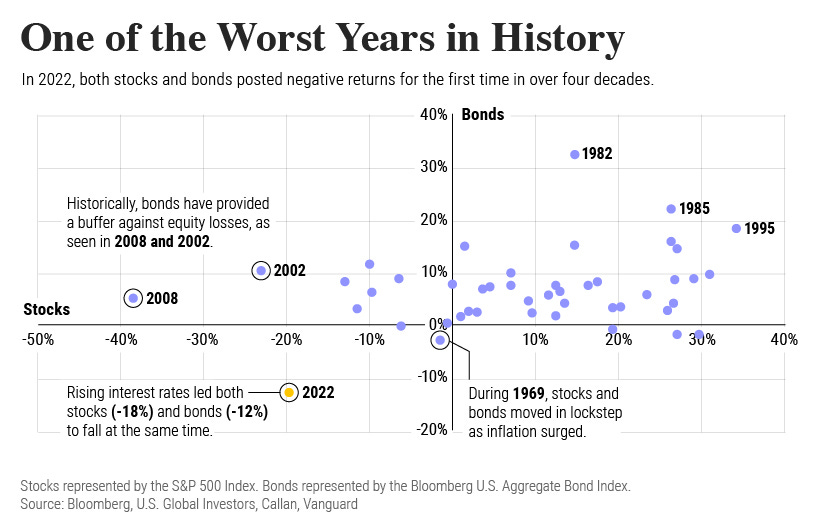
Bonds & Stocks where bonds typically are a hedge against portfolio losses due to their negative historical correlation to stocks. Outliers are always interesting:
👉 2022 was quite one – correlation got back!
👉 the last time stocks & bonds moved together in a negative direction was in 1969
-
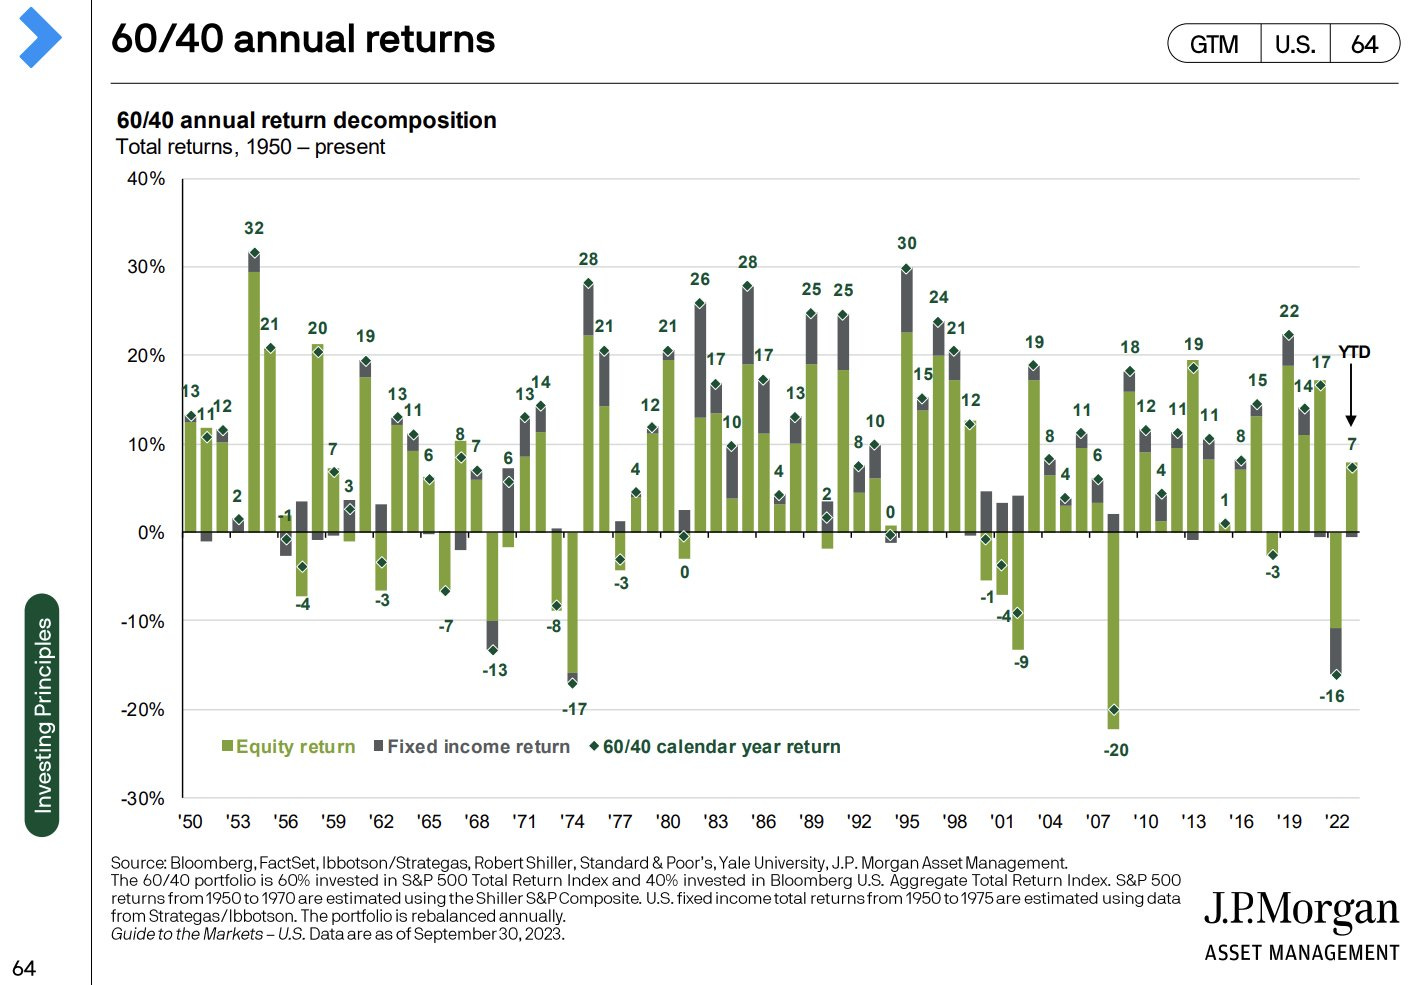
The 60/40 (stocks & bonds) since 1950:
👉 after 2022 where both stocks and bonds got hammered and we had the worst bear market since 2007-2009
👉 now with a 7% return
-
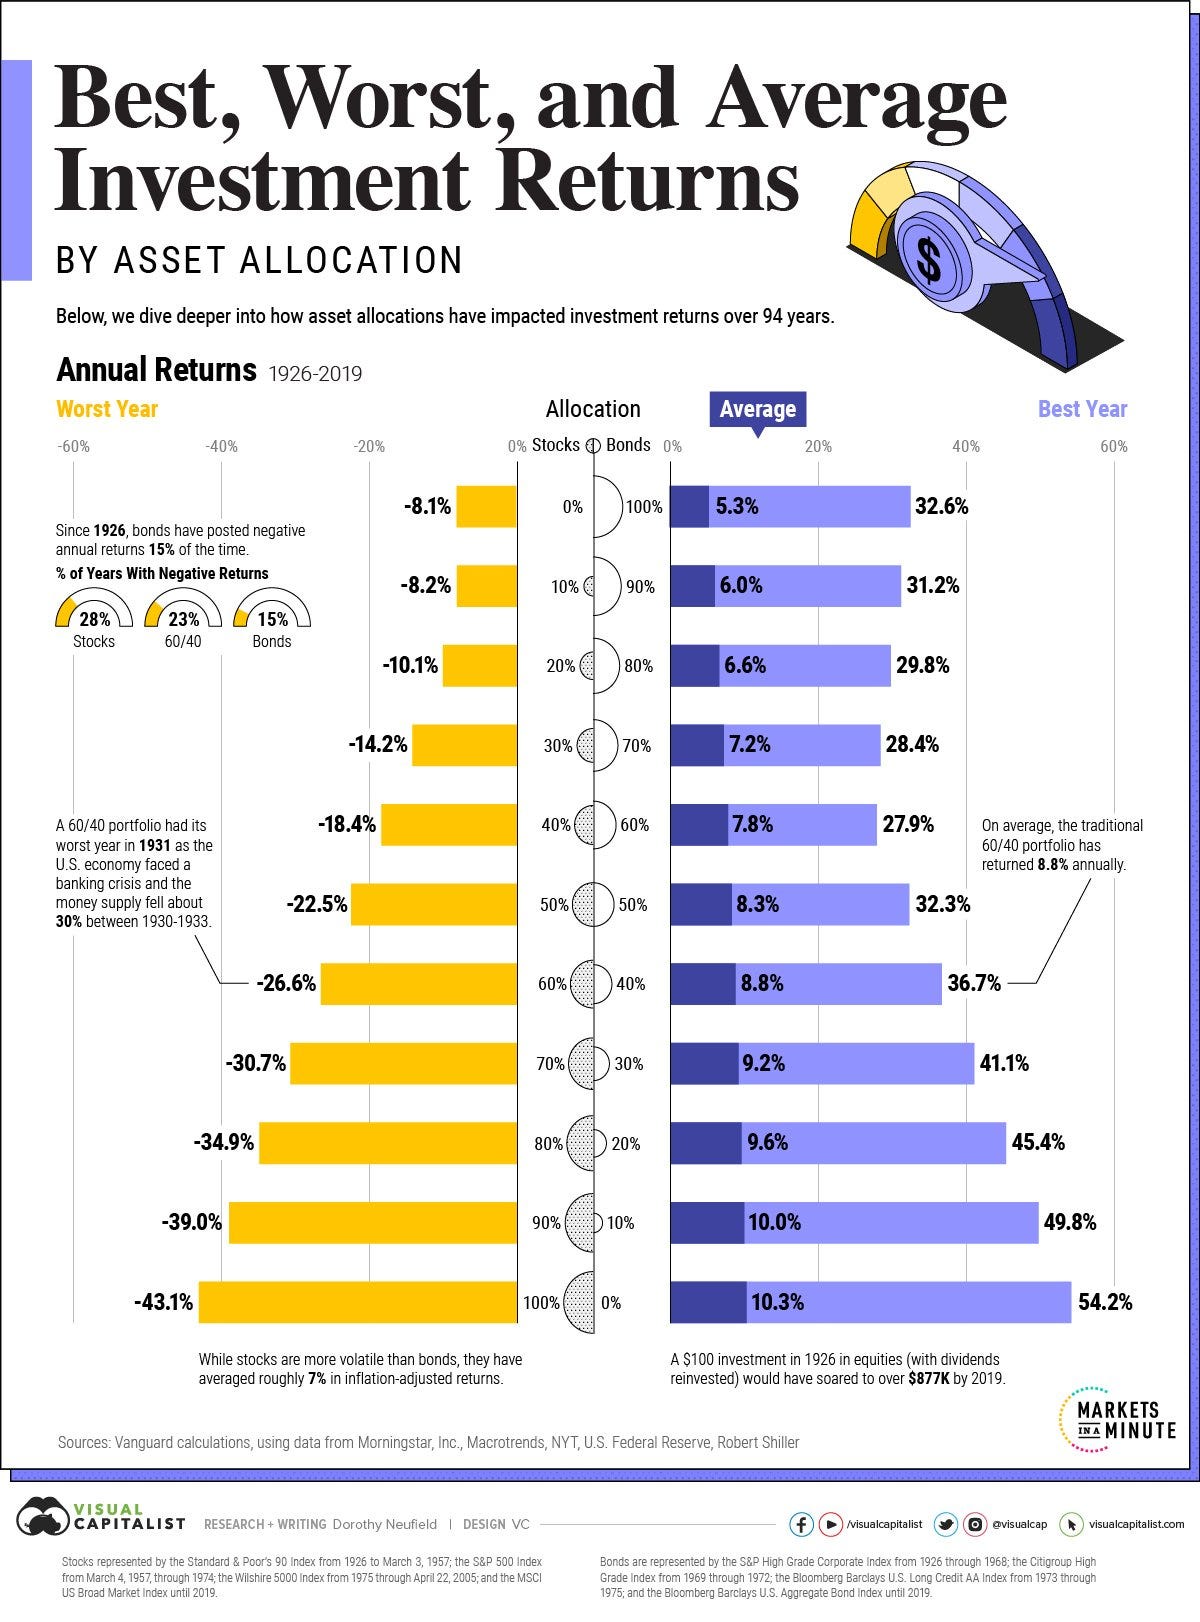
Let’s mix different combinations of stocks & bonds for 90 years of returns
👉 check the classic 60/40 with 8.8% annually
👉 then check Best, Worst & Average returns via various ways to mix stocks & bonds
On bonds alone, a quite common question I see around and also personally get often: ‘Are US treasury bonds safe to invest in?’ Greenspan’s answer valid also today imho:
-
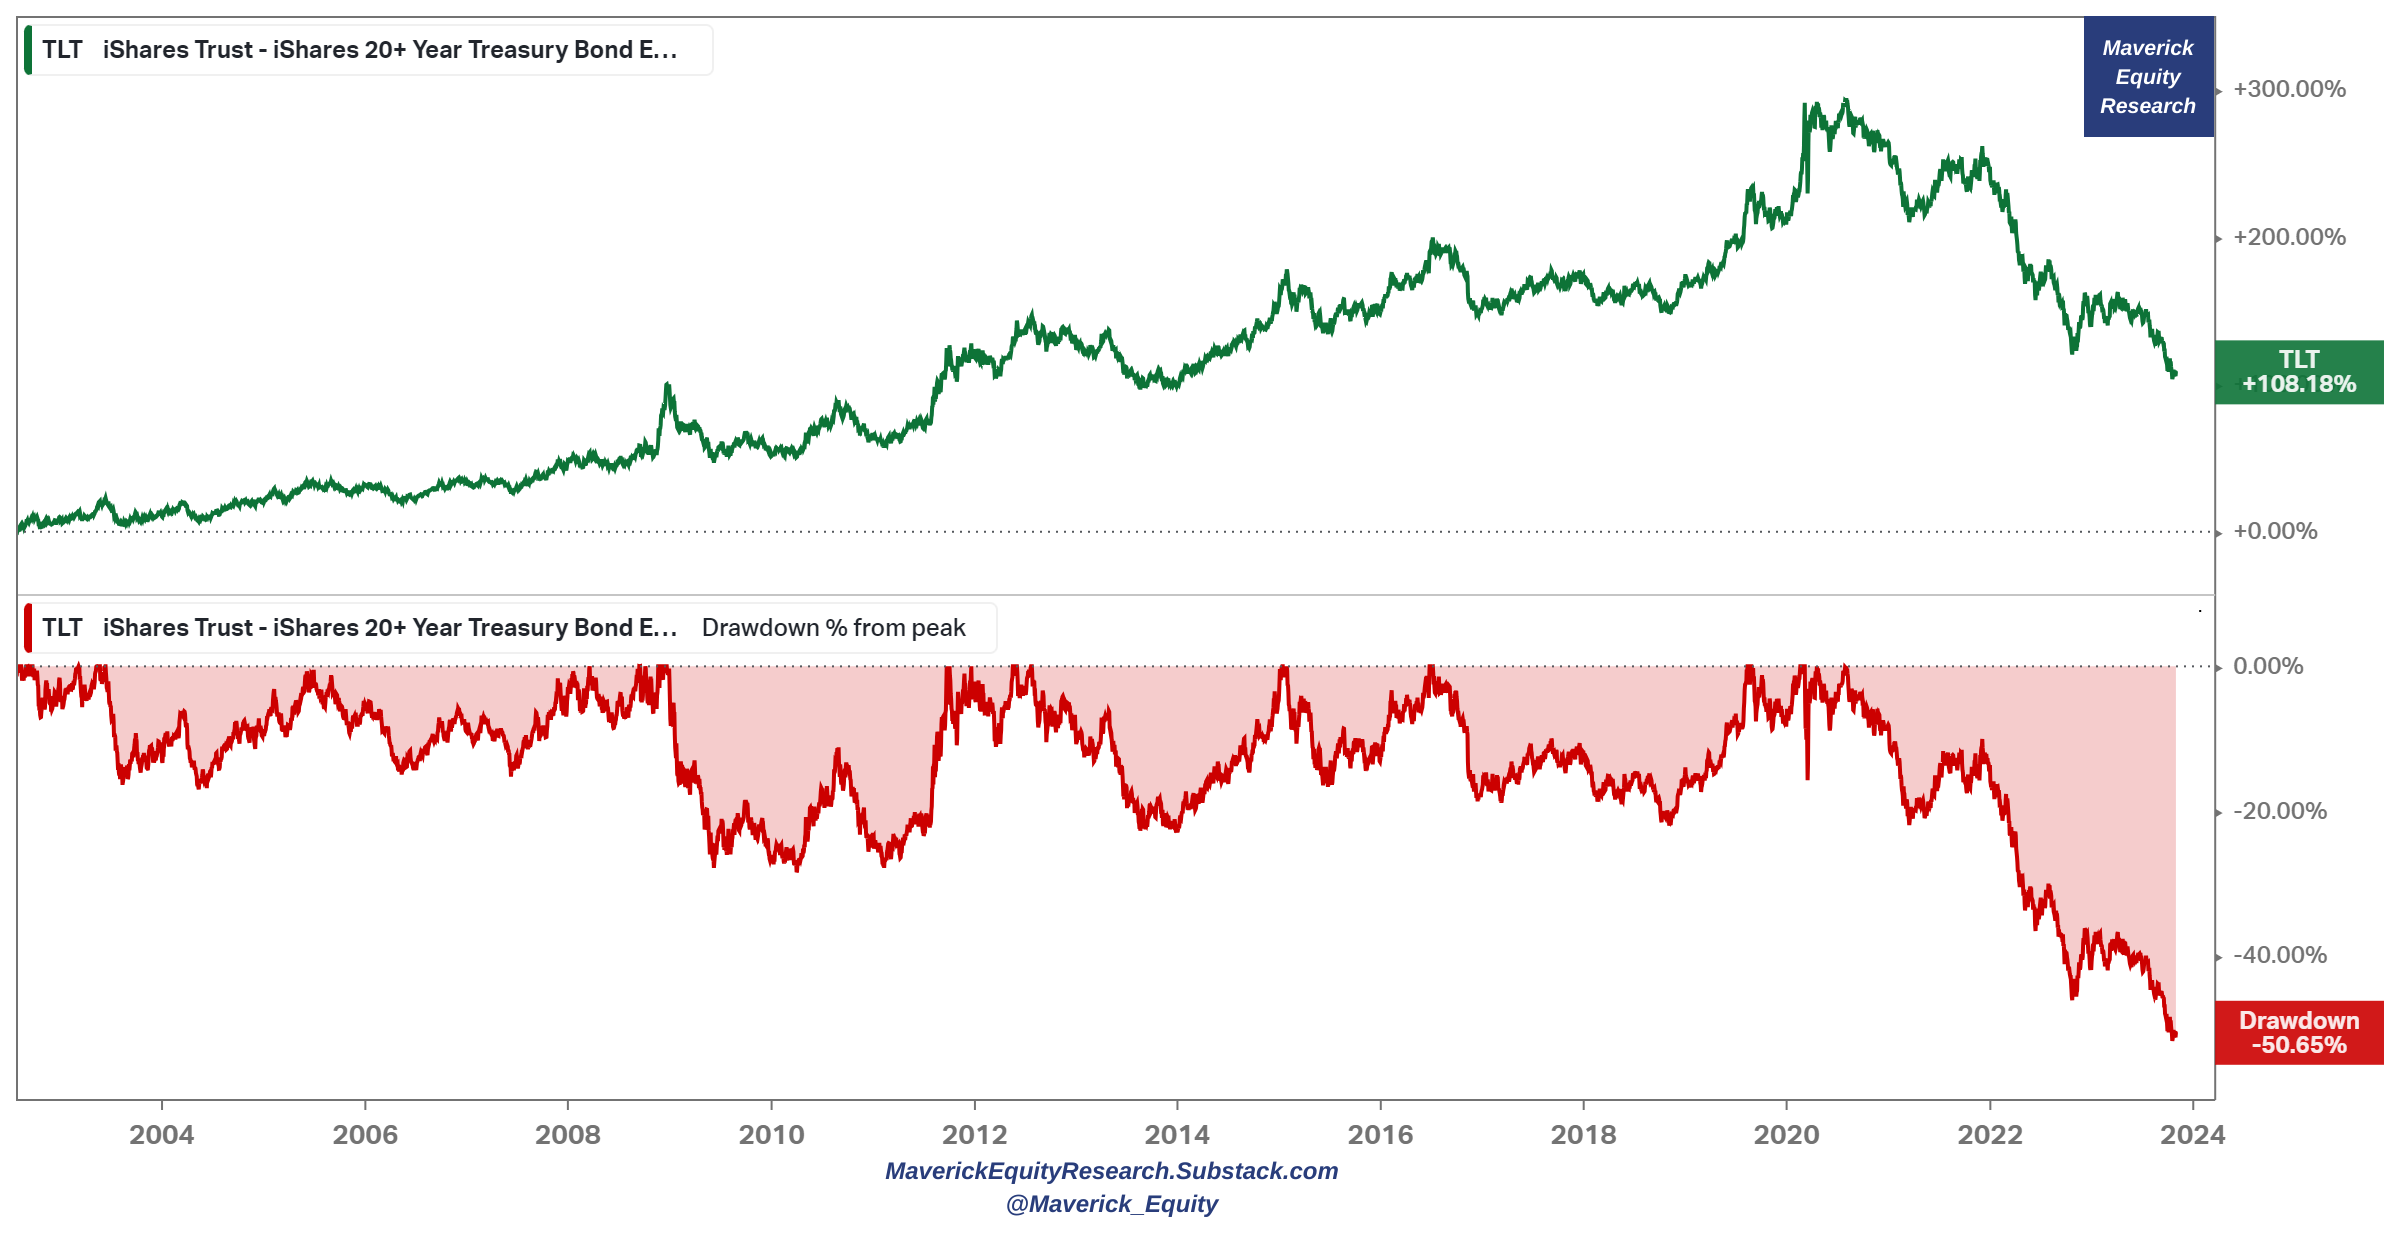
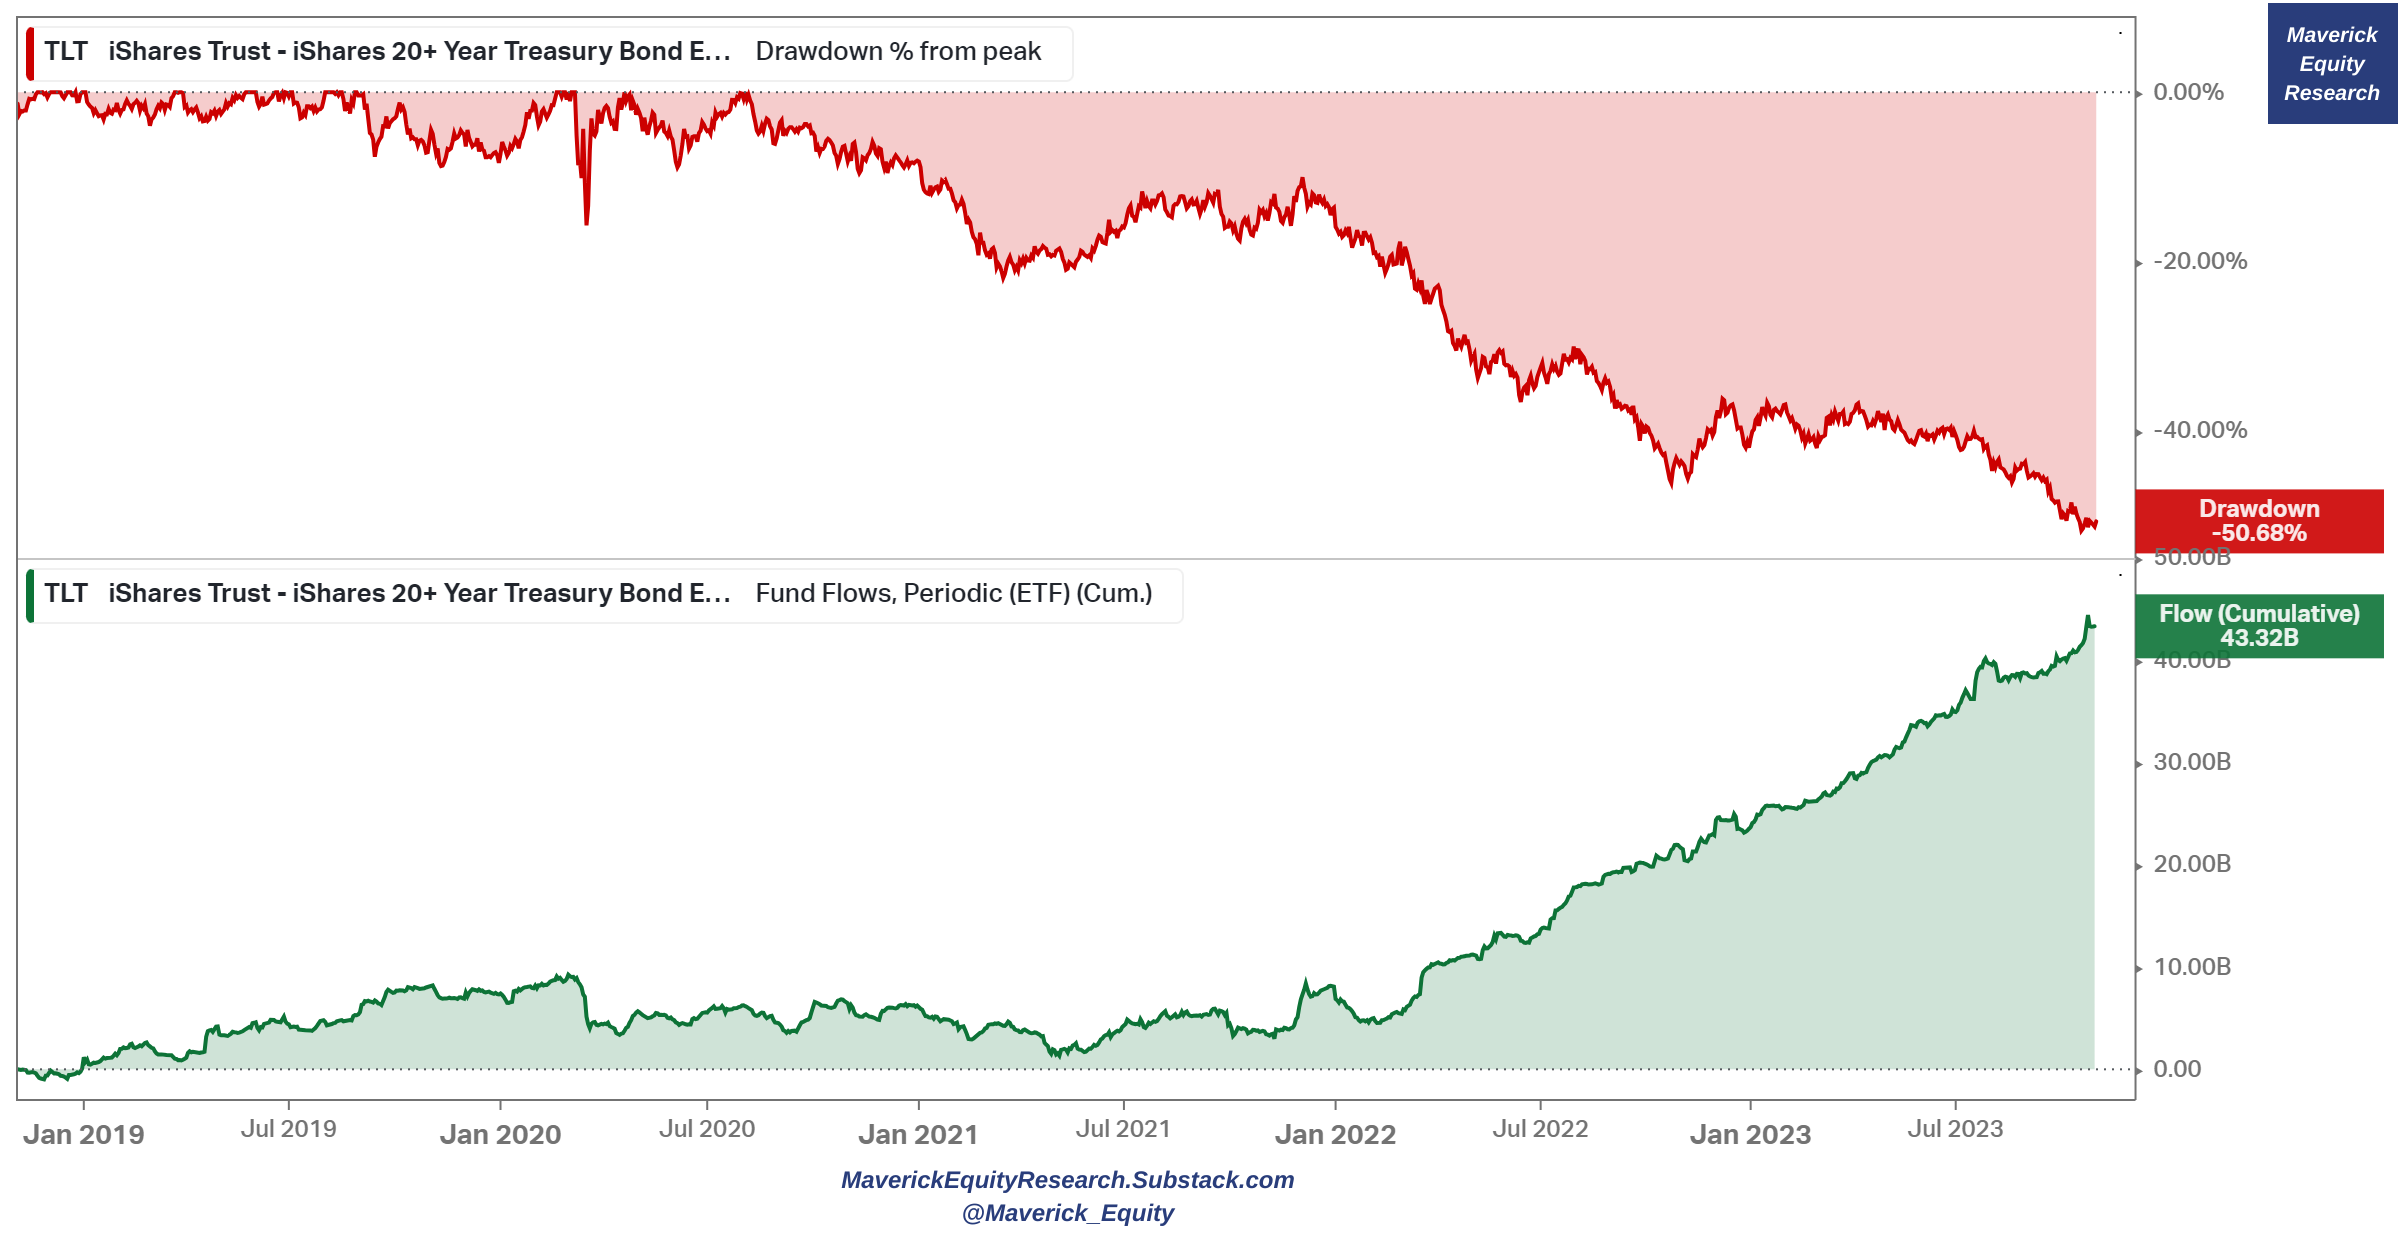
US government long-dated bonds (treasuries) via the popular TLT ETF:
With a -50% current drawdown, long dated bonds become more and more appealing via the lens of risk/return … given that ketchup inflation came to town, FED naturally hiked rates and did so via the fastest rate hiking cycle in 4 decades
👉 we have peak interest rates in this cycle rather sooner than later (imho)
👉 which makes the upside vs downside very favorable for bonds currently via the asymmetry in rising vs falling rates for bonds from these levels
👉 which I like to summarise shortly as the ”ultra long risk free high duration theme”
N.B. working now on a comprehensive piece about ‘Investing in Bonds’, stay tuned…
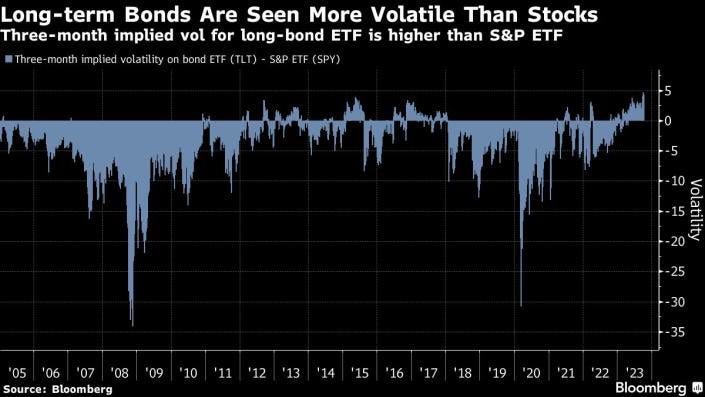
Key fact not mentioned out there:
-
TLT aka Long-Term Government Bonds are now more volatile than stocks by the largest margin ever recorded … let that sink in and bring the sink 😉 … most of the times, extremes & emotions create dislocations hence opportunity …
-
one key reasons is the market swinging between ‘higher for longer’ interest rates to lowering rates as we reached the peak in this cycle
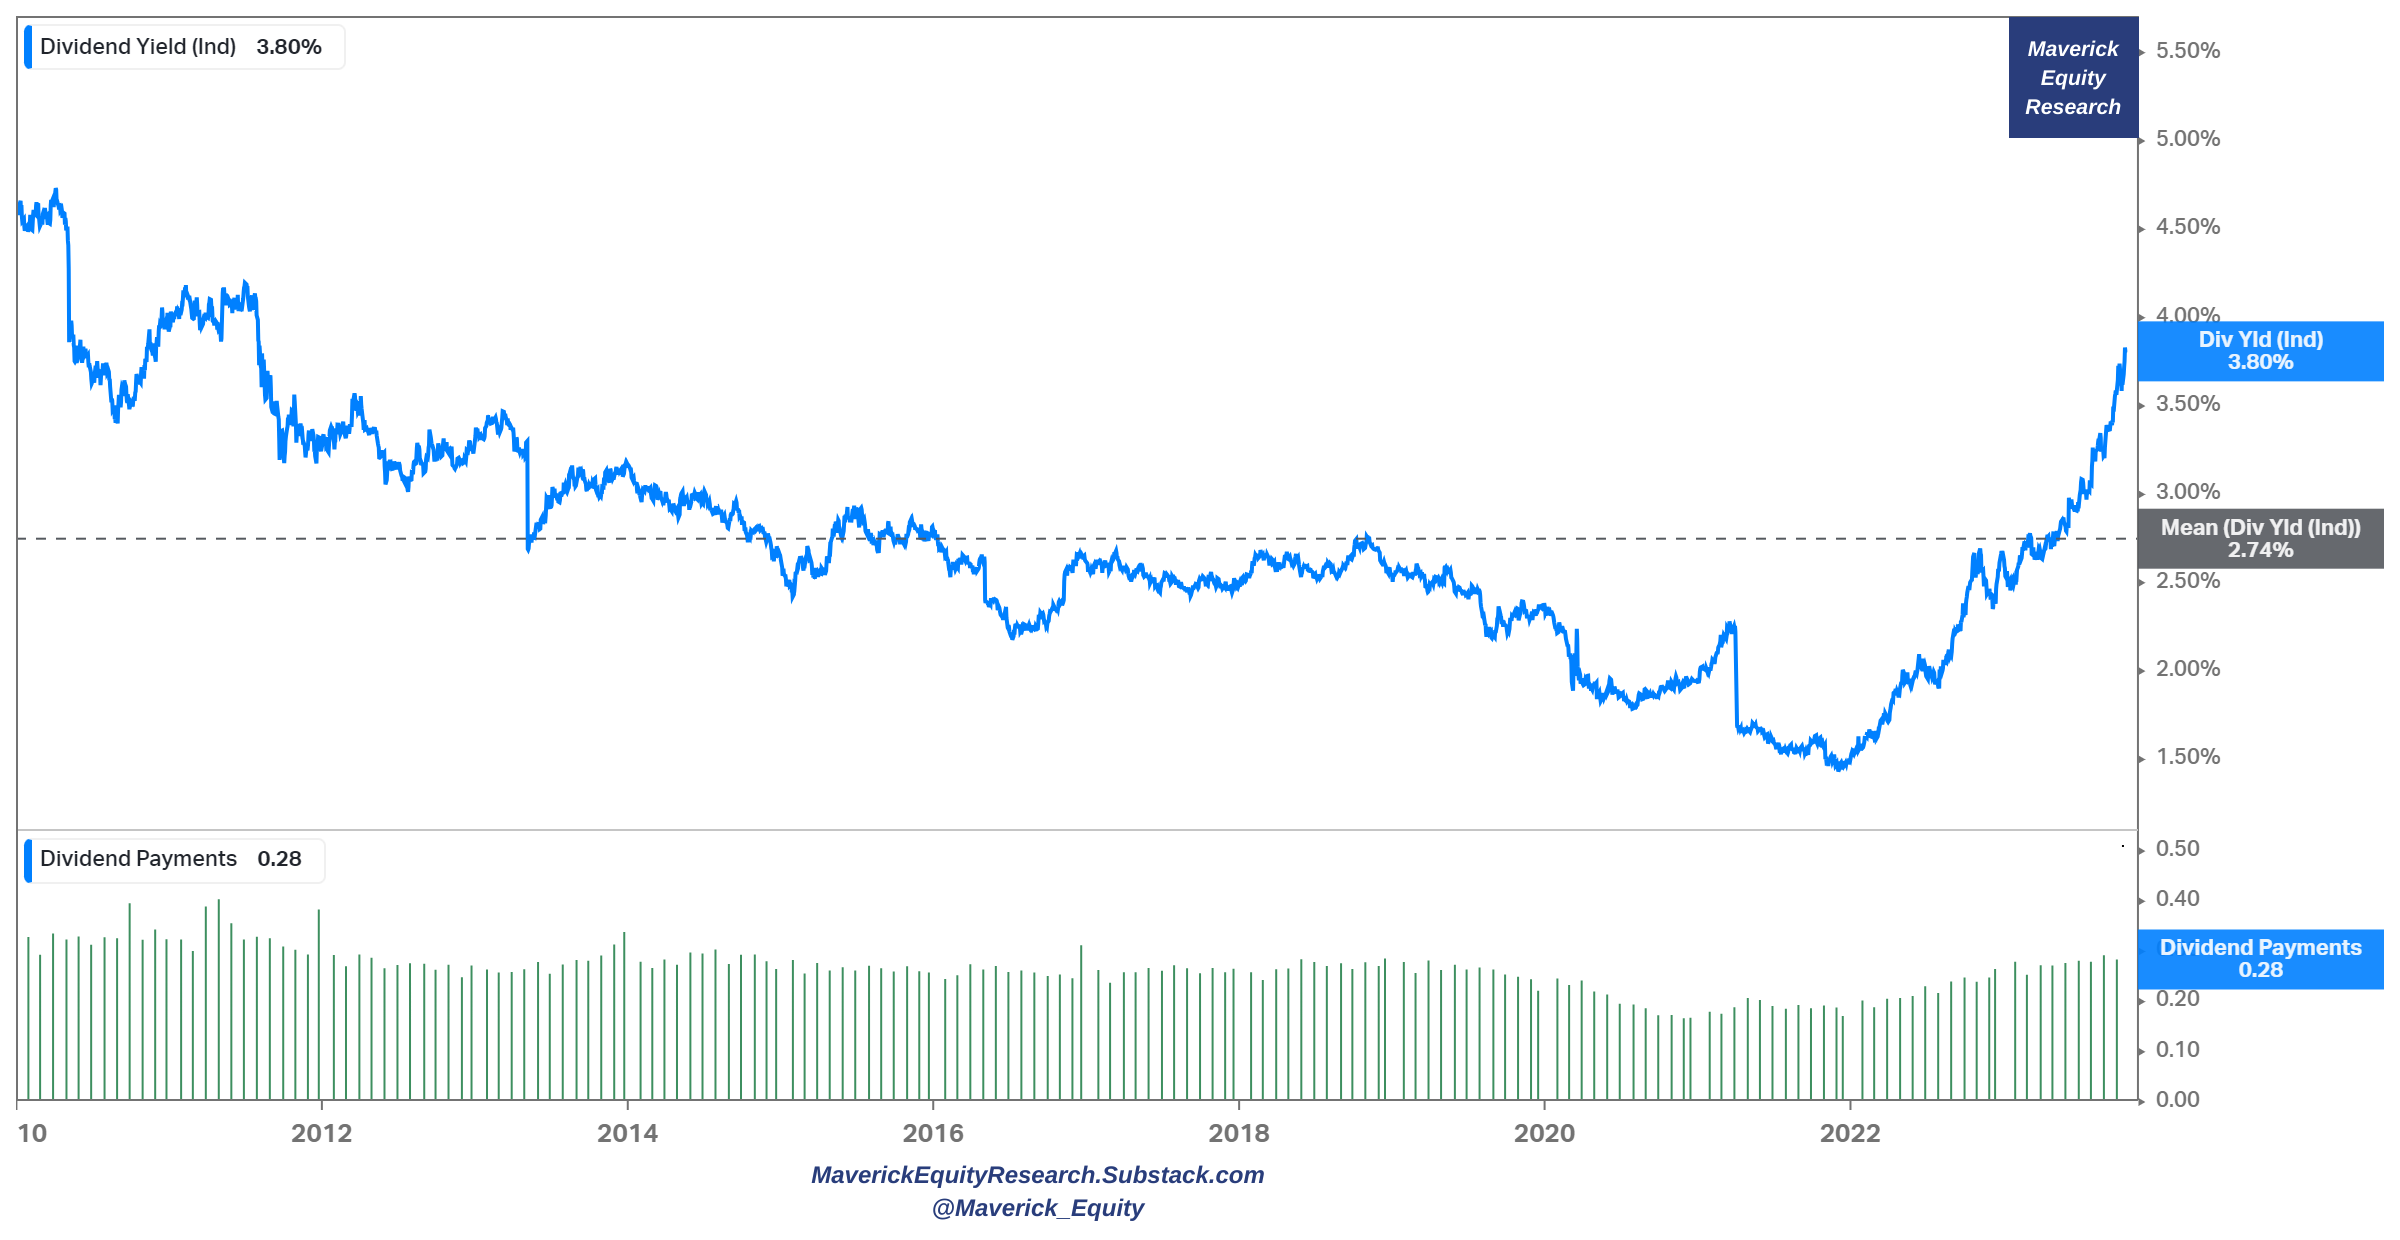
TLT dividends overview & key but under looked stats:
👉 average Yield to Maturity (YTM) = 5.12%
👉 12m Trailing Yield = 3.82% (yield an investor would have received if they had held the fund over the last twelve months assuming the most recent NAV)
👉 Weighted Avg Maturity = 25.47 years, number of holdings = 40
👉 3.8% current dividend yield, 2.75% average since 2010
👉 pays monthly cash ‘dividend’, never missed a payment ‘naturally’ 😉 (risk free)
TLT flows, the more price drops, the more the inflows keep coming …
👉 crazy inflows keep coming into the ETF with $16 billion in 2023 alone, which ranks in the 2nd place ETF inflows, only $VOO (S&P 500) attracting more flows
P.S. for some fun, is TLT the new GME / AMC ? Nahhhhh, just fun 😉
-
US Treasuries funds inflows – extending duration, namely:
👉 intermediate treasuries with the biggest inflows since mid 2022
👉 long-term treasuries with the biggest inflows on record

-
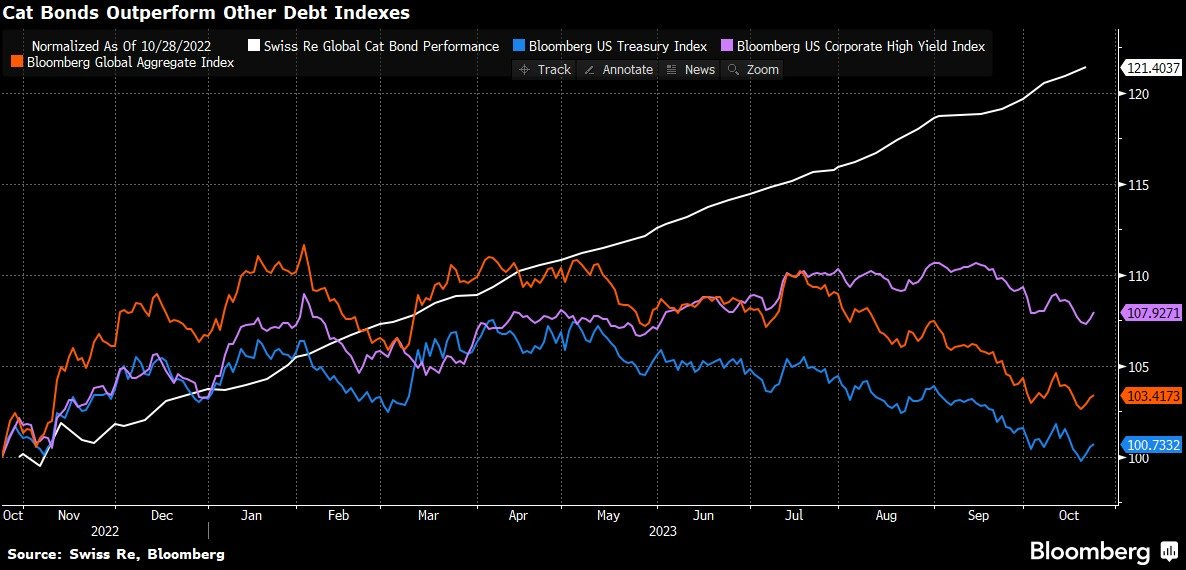
Outliers in bonds since 2020? Yes, Swiss Re Global Cat bond outperforming …
-
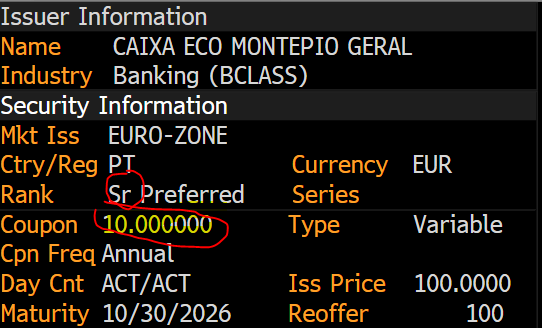
Now check this interesting & funny bond from the world of bonds at banks:
👉 Portuguese bank Caixa Economica Montepio Geral with a senior preferred bond carrying a fat 10% coupon
👉 the ‘thingie’ here is that as a senior preferred bond, that sits on the same seniority level as deposits by large depositors
👉 complementary note: bank also had a 2019 callable bond with a 10.5% coupon issued, though that was a Tier 2 bond, not a senior (ISIN: PTCMGVOM0025)
👉 side note: if you spotted the ‘Monte’ words in the name, then you are a lagend 😉
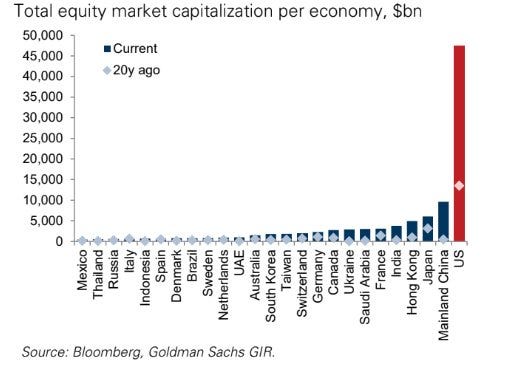
12. This one is quite a chart & rare, total stock market capitalisation per economy
👉 US is off the charts in terms of current value and evolution since 20 years ago … which also destroys the myth of the end of the US dollar as we keep hearing …
👉 China making big leaps that’s for sure
-
US tech relative performance
-
relative performance vs the S&P 500 reached previous extreme levels
-
however, note that performance is not valuation & earnings contribution
N.B. Valuation to be covered soon in the Maverick Valuations section

-
The Magnificent 7 M7 tech stocks … making quite a chart:
-
are again almost 30% of the S&P 500 market cap after 20% in the 2022 bear market
-
29.6% = the highest level on record

-
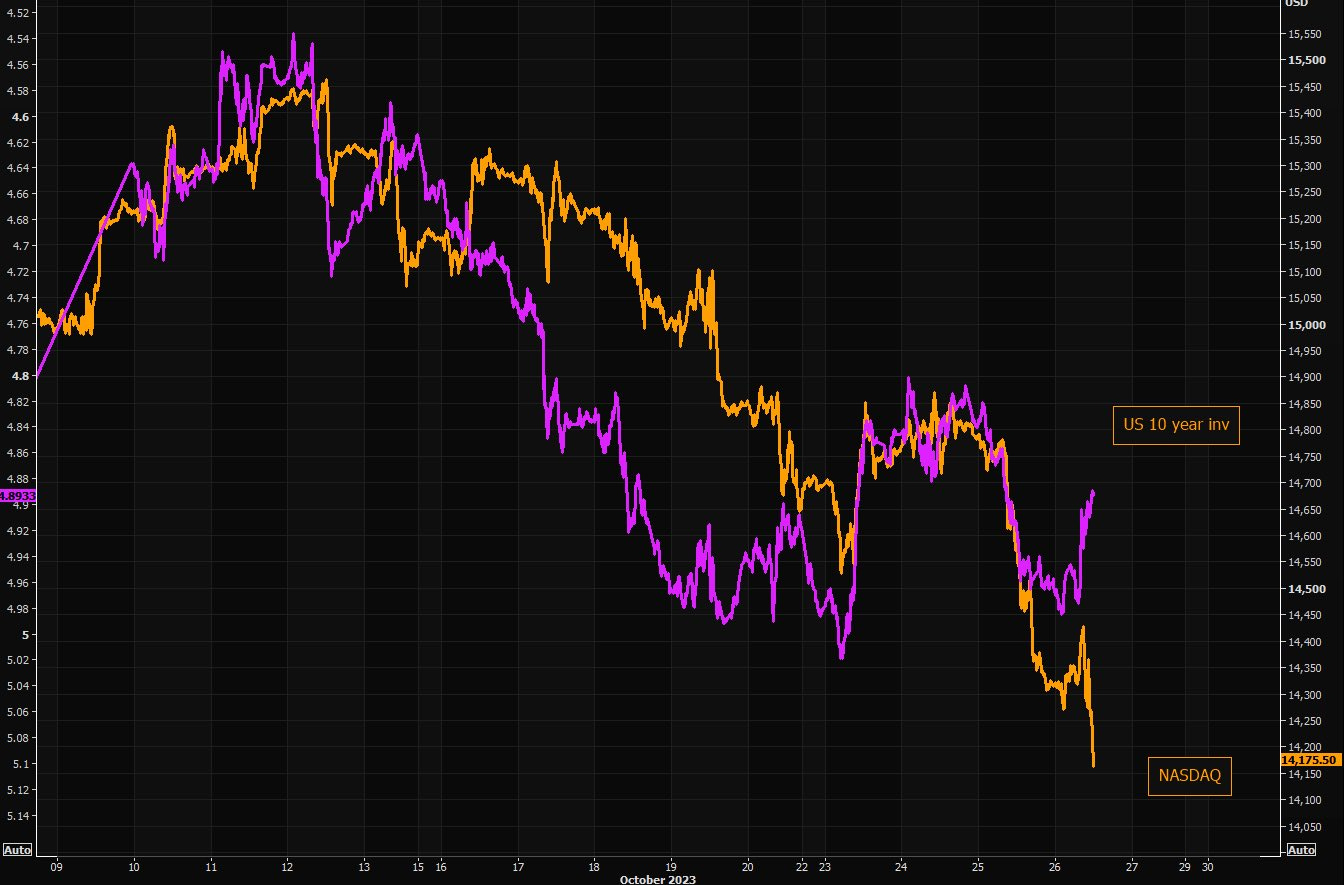
Nasdaq-100 wise (QQQ):
👉 in the short term it looks quite oversold given interest rates retreating some lately…
-
Visualizing the R&D Investment of the 10 Biggest Nasdaq Companies
-
in 2022 alone, the top 10 tech companies spent $222 billions in R&D, not peanuts…
-
Apple’s R&D spending jumped from about $3bn to over $26bn over the last decade

-
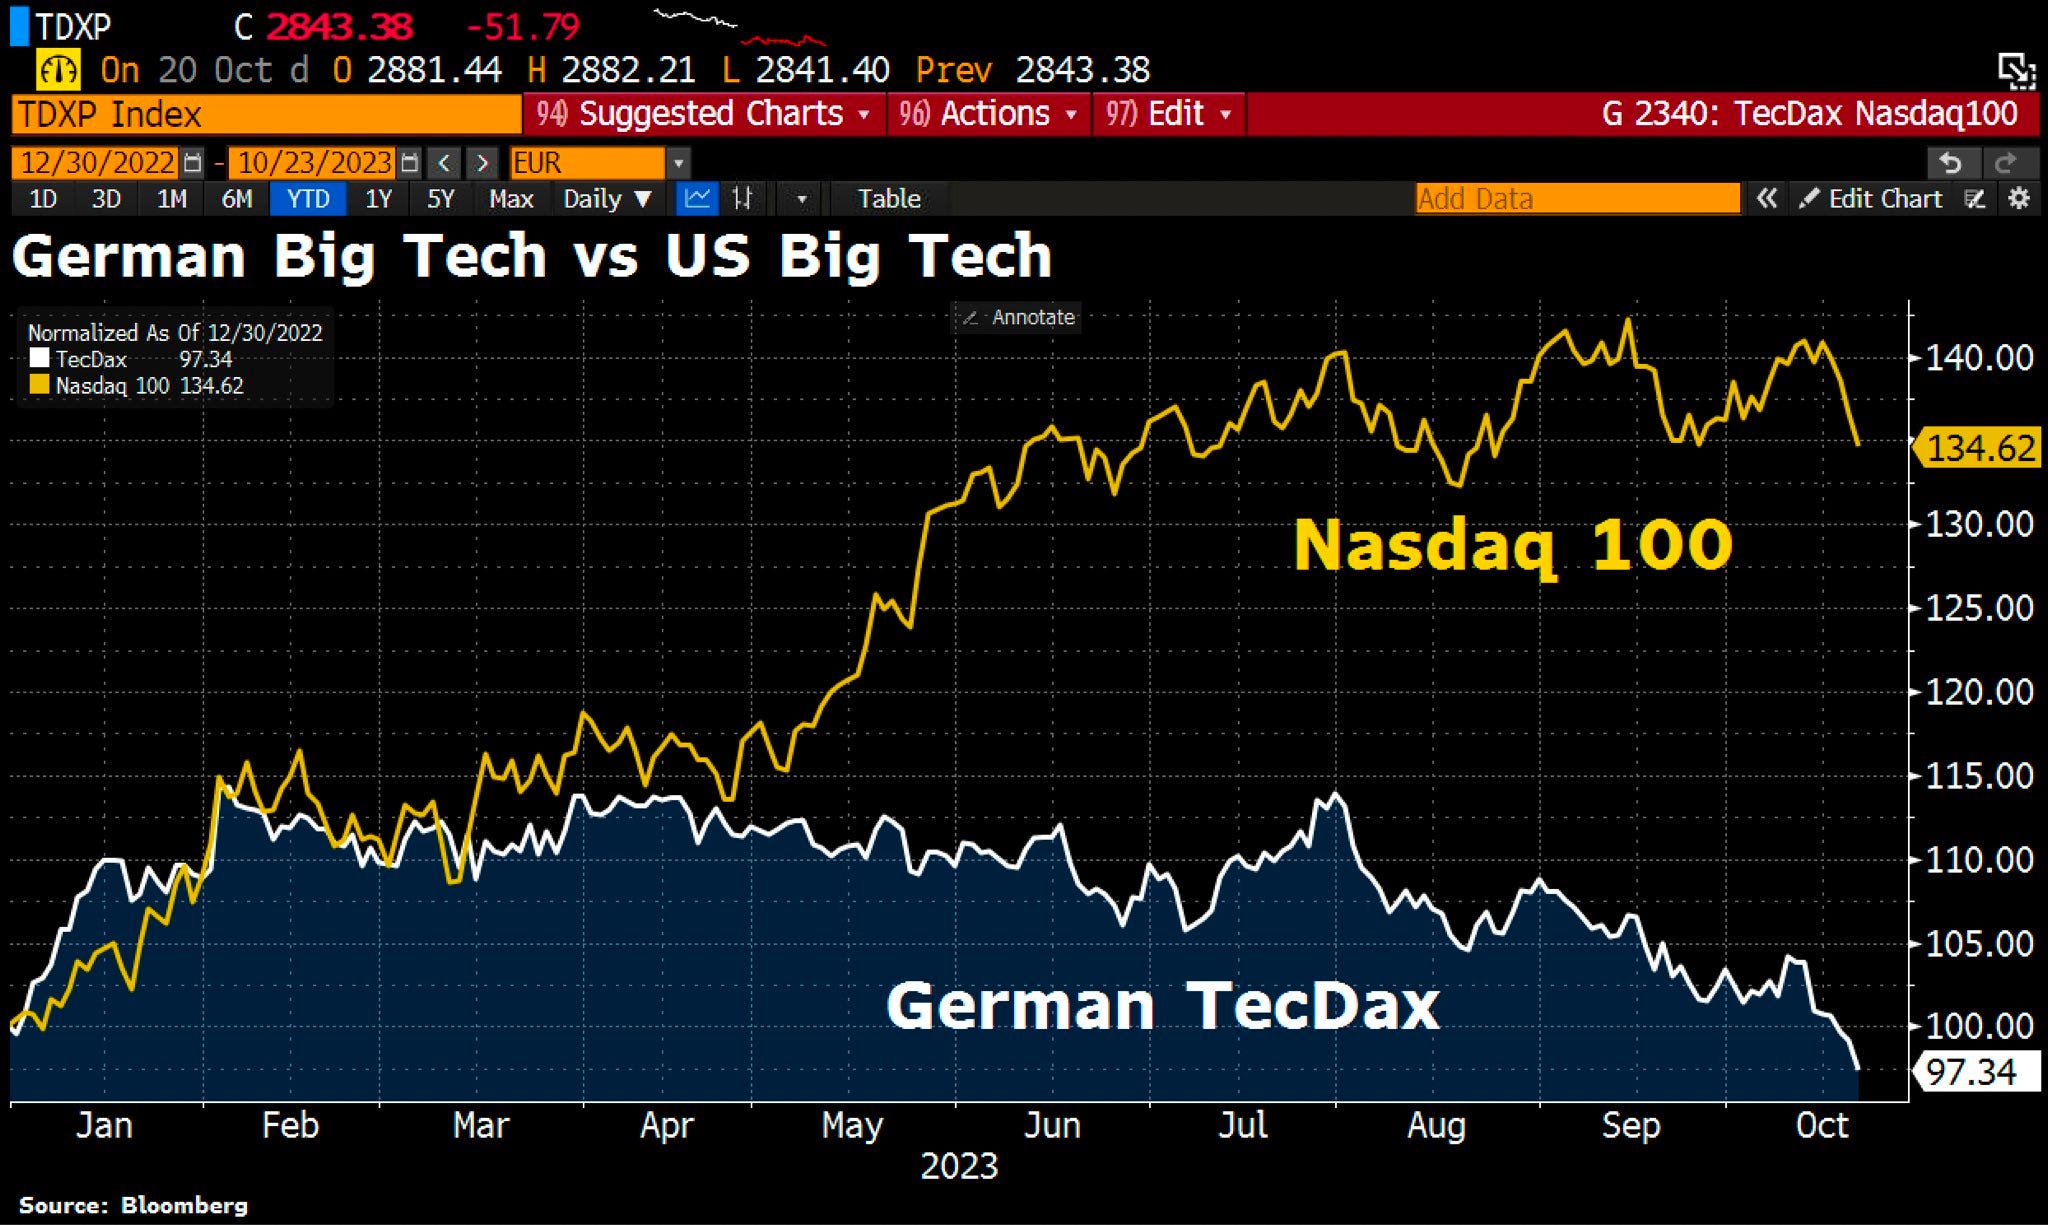
German Big Tech vs US Big Tech in 2023: not much to comment …
-
META aka Facebook
👉 outperforming big time the Nasdaq-100 $QQQ this year
👉 going into the metaverse mode 😉

-
Amazon business model via multiple streams …
-
note the growth of AWS (Amazon Web Services) launched in 2006 and now drives 16% of Amazon’s total revenue
-
Subscriptions (Amazon Prime etc) growing nicely also

-
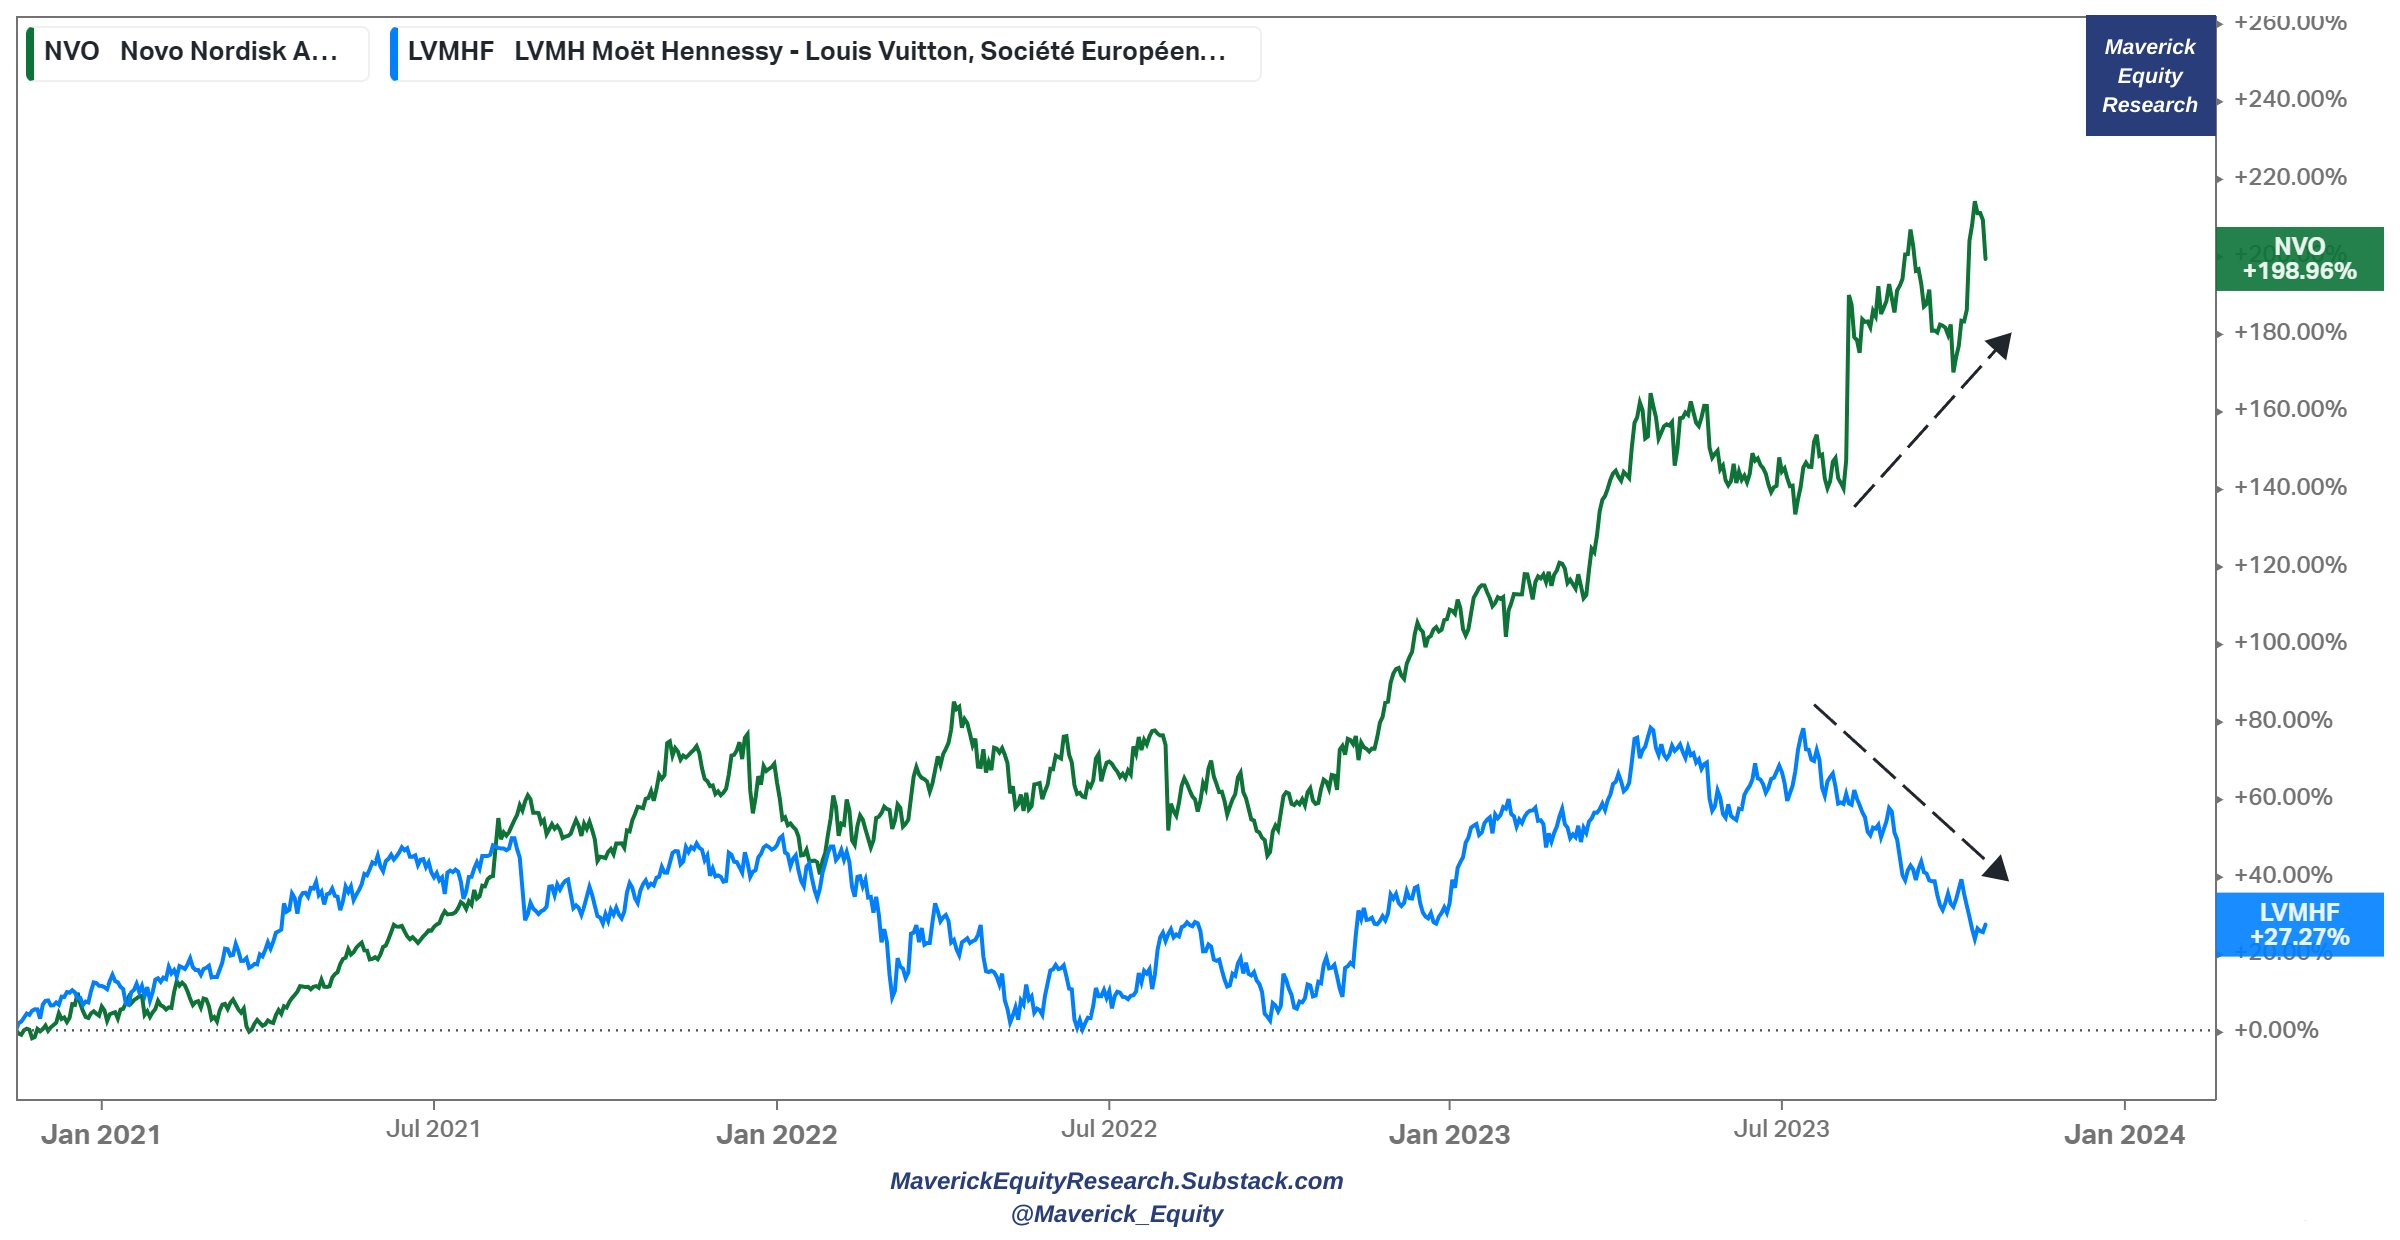
Fat vs Luxury = perfect substitutes?
👉 Louis Vuitton (LVMH) vs Novo Nordisk (NVO) gap becoming bigger and bigger …
👉 somebody is selling fancy bags for fancy drugs (GLP-1, Ozempic etc)? Empty stomach, empty bag ? What’s going up there? 😉
5 Bonus charts:
-
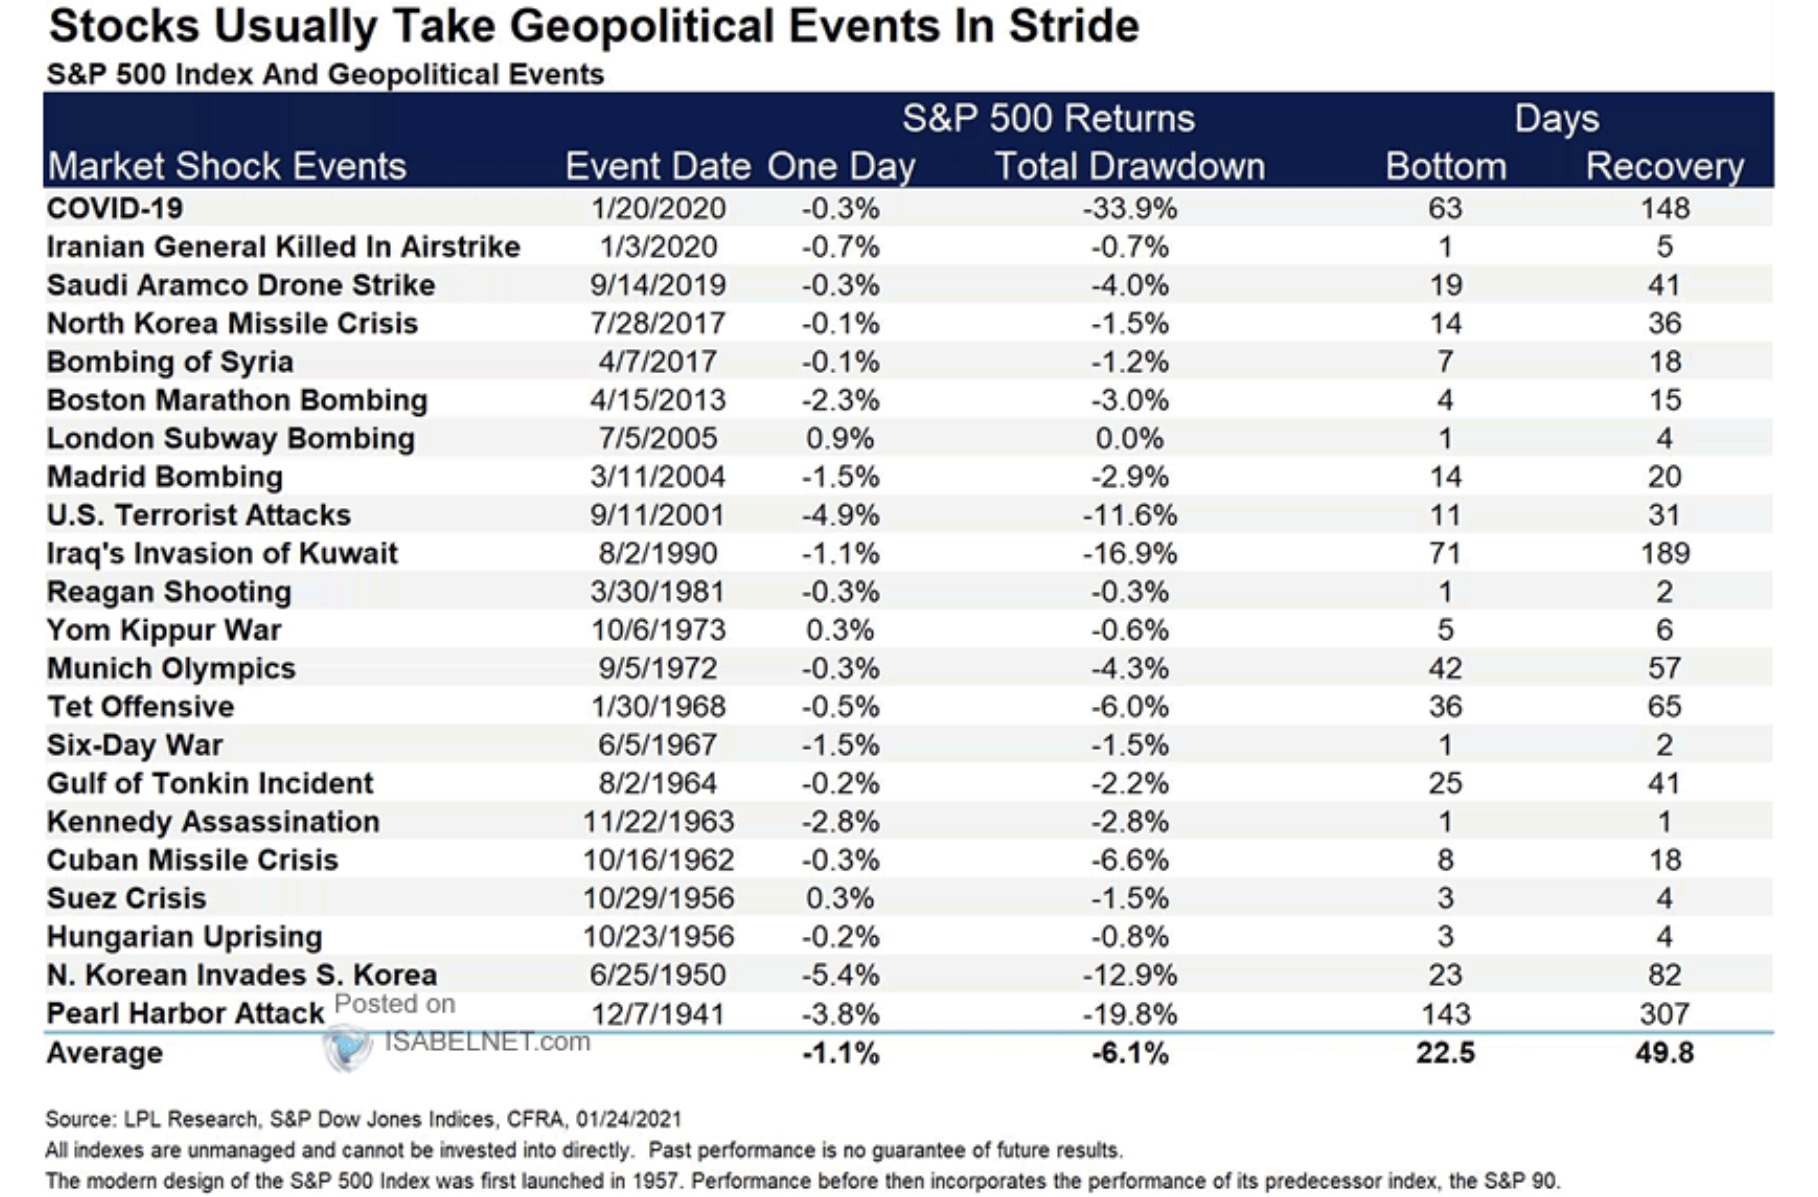
Stocks and historical Geopolitical shocks:
👉 stocks get hit WAY LESS than what the headlines say (for clicks, views = ad money)
👉 average drawdown just -6.1%, 22.5 days to bottom and 49.8 days to recover
-
Ranked: The World’s Top 25 Defense Companies by Revenue

-
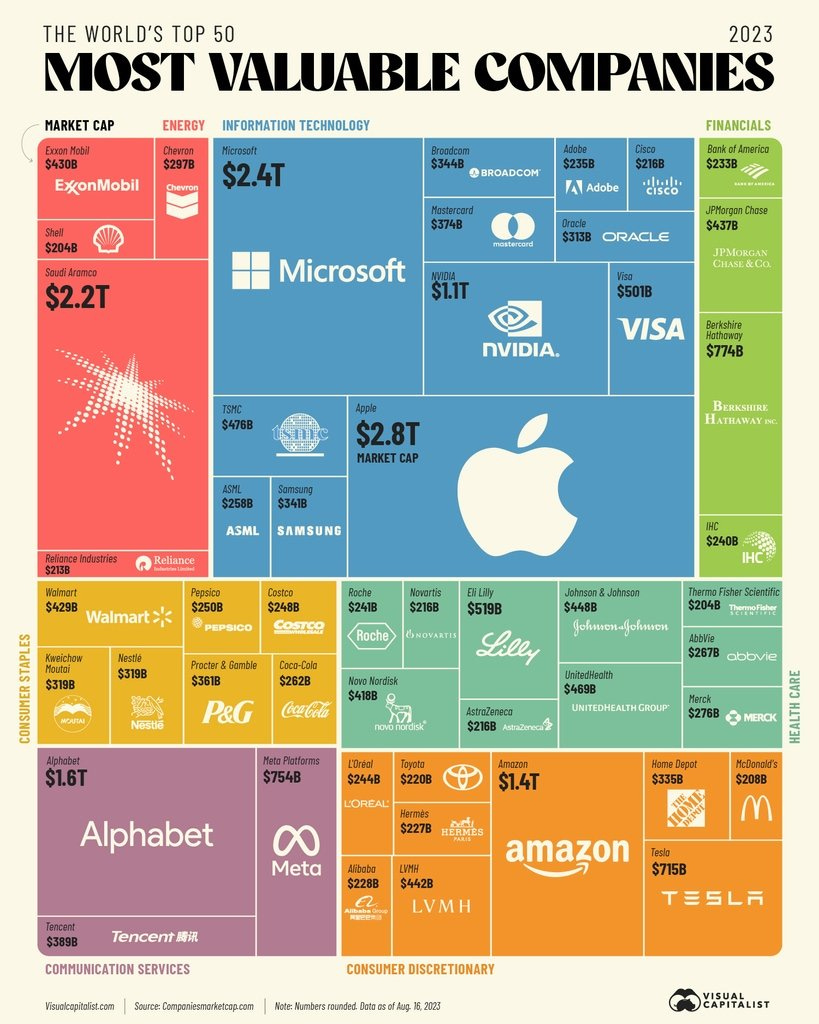
Top 50 most valuable companies in the world
-
The Key Investment Theme of Each Decade (1950-Today)
-
2010s: American ‘Mega Caps’ aka FAANG
-
2020s ?: AI/ML, Health Care, Crypto? Food for thought …

-
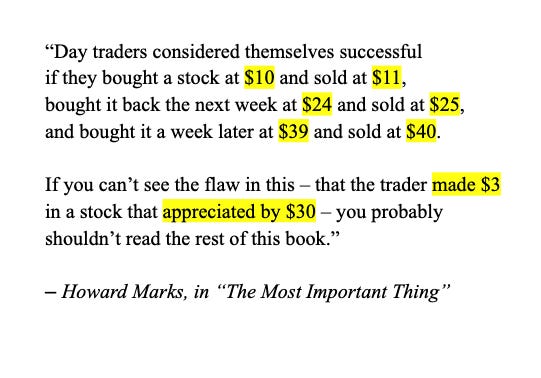
To wrap it up, a fun but serious take here – How day trading ‘works’ (sarcasm alert)
-
don’t lose your time & money day trading … unless monopoly money for learning
-
other than that, grounded investing & special situations ‘trades’ work & compound
Research is NOT behind a paywall & NO pesky ads. What would be appreciated? Just sharing it around with like-minded people & hitting the ❤️ button. This will boost me bringing in more and more independent investment research … . Thank you!
That’s all for October. Have a great day!
Mav 👋 🤝
