Congratulations, You Survived 2025 😶

Presented by:

OVERVIEW
Congratulations, You Survived 2025 😶

Before we dive in, here’s today’s crypto market heatmap:

Source: Santiment
And here’s a look at crypto’s total market and altcoin market cap charts:
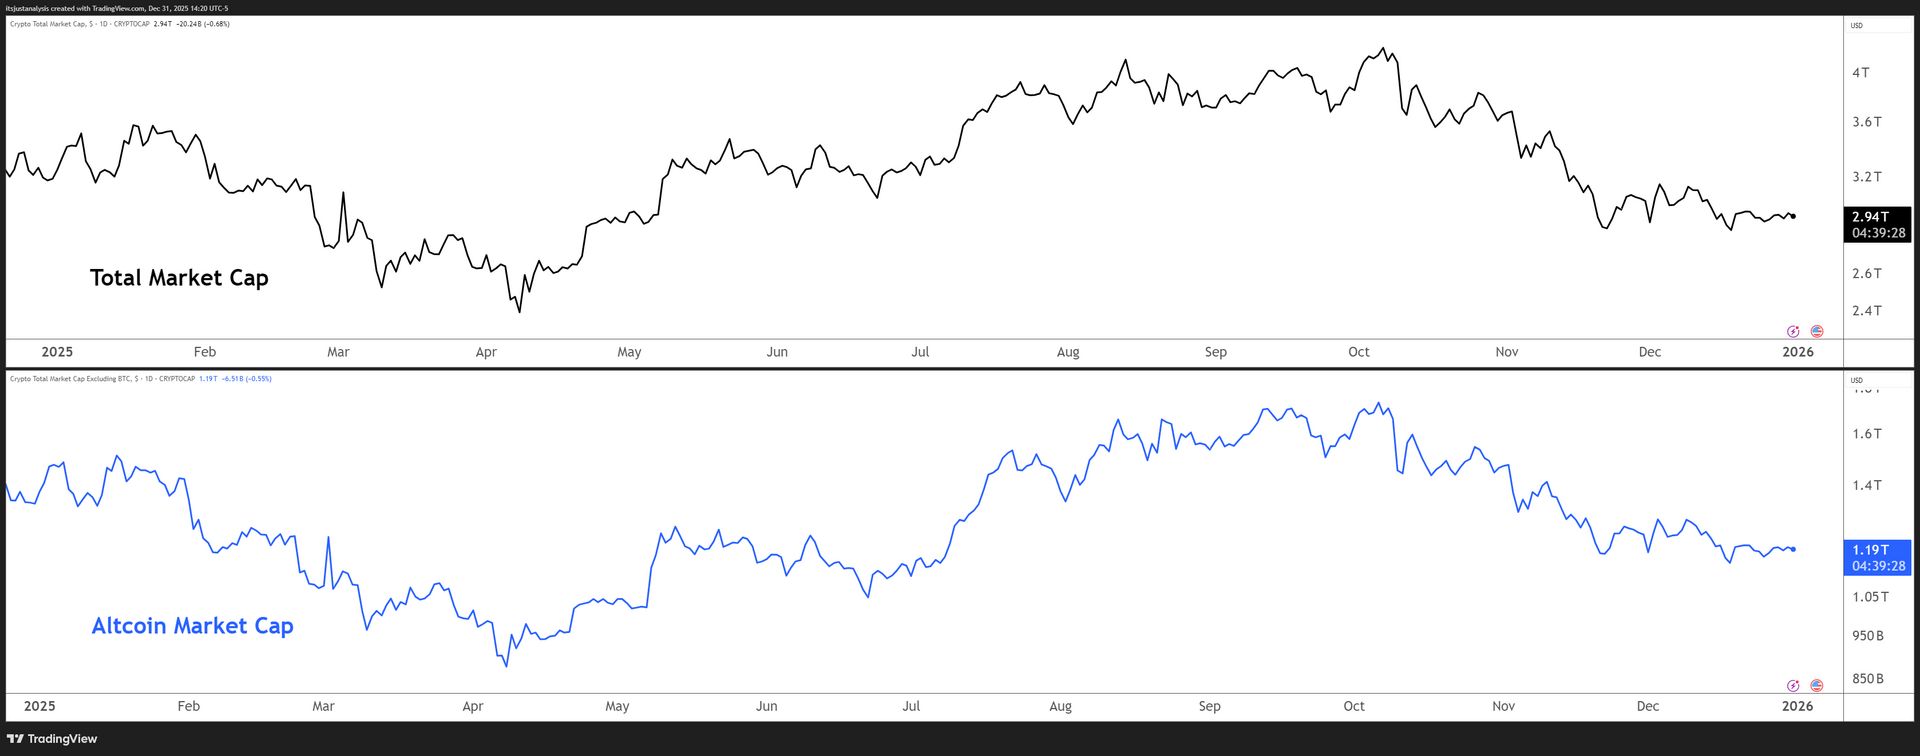
Source: TradingView
ON-CHAIN ANALYSIS
Year-End On-Chain Reality Check 😶
The uncomfortable truth about where we actually stand heading into 2026. 🤕
Before we dive in, let me explain what we’re actually measuring here.
MVRV (Market Value to Realized Value)
This tells you whether holders are sitting on profits or losses. When it’s positive, the average buyer is in the green. When it’s negative, they’re underwater.
I’ve broken this down across five timeframes (365d, 180d, 90d, 60d, and 30d) so you can see exactly which buyer cohorts (I hate that this is a word now to use for things no involving Rome or Total War games) are bleeding and which are holding up.
Open Interest (OI)
OI from derivatives markets adds the leverage dimension. High OI relative to volume means potential liquidation fuel. Declining OI with stable prices? That’s healthy deleveraging. The OI/Volume ratio tells you how leveraged the market is relative to actual trading activity.
Combine the two and you get the full picture: who’s underwater, how leveraged they are, and whether the pain trade is ahead or behind.
But this is crypto and the pain train may be behind us… but it’s probably on fire, the conductor is dead, and it’s hauling five million metric tons of mustard gas and about to derail and spill in a heavily populated area. 🚂
CRYPTOTWITS
2025 In 60 Seconds 🎥
Oh ya: you’ll notice we’re producing a lot more long form and short form video content for everyone.
Besides my mug, you should watch (because there’s nothing better than when you’re hungover) some of our other stuffs:
🐬 True Odds Podcast – Ravens-Steelers & 49ers-Seahawks: Who Gets the #1 Seed? | Week 18 Picks
SPONSORED
Why Floki’s Long-Term Community Outlasts Market Cycles

Every cycle, projects rise on hype and disappear just as quickly. What lasts is something much harder to build: people who stay when timelines are quiet and prices are flat.
This year was a reminder that long-term communities are forged during drawdowns, delays, and slow markets. When attention moves elsewhere, the real foundation gets laid.
Floki and TokenFi never stopped attracting builders, users, and holders who care less about short-term noise and more about direction.
That kind of alignment doesn’t show up in daily charts, but it compounds over time.
Cycles come and go. Products evolve. Markets reset.
Communities that survive those resets don’t just outlast cycles, they define the next one.
As the year closes, that’s the real signal worth paying attention to.
*3rd Party Ad. Not an offer or recommendation by Stocktwits. See disclosure here.
ON-CHAIN ANALYSIS
Bitcoin: The Anchor ⚓️
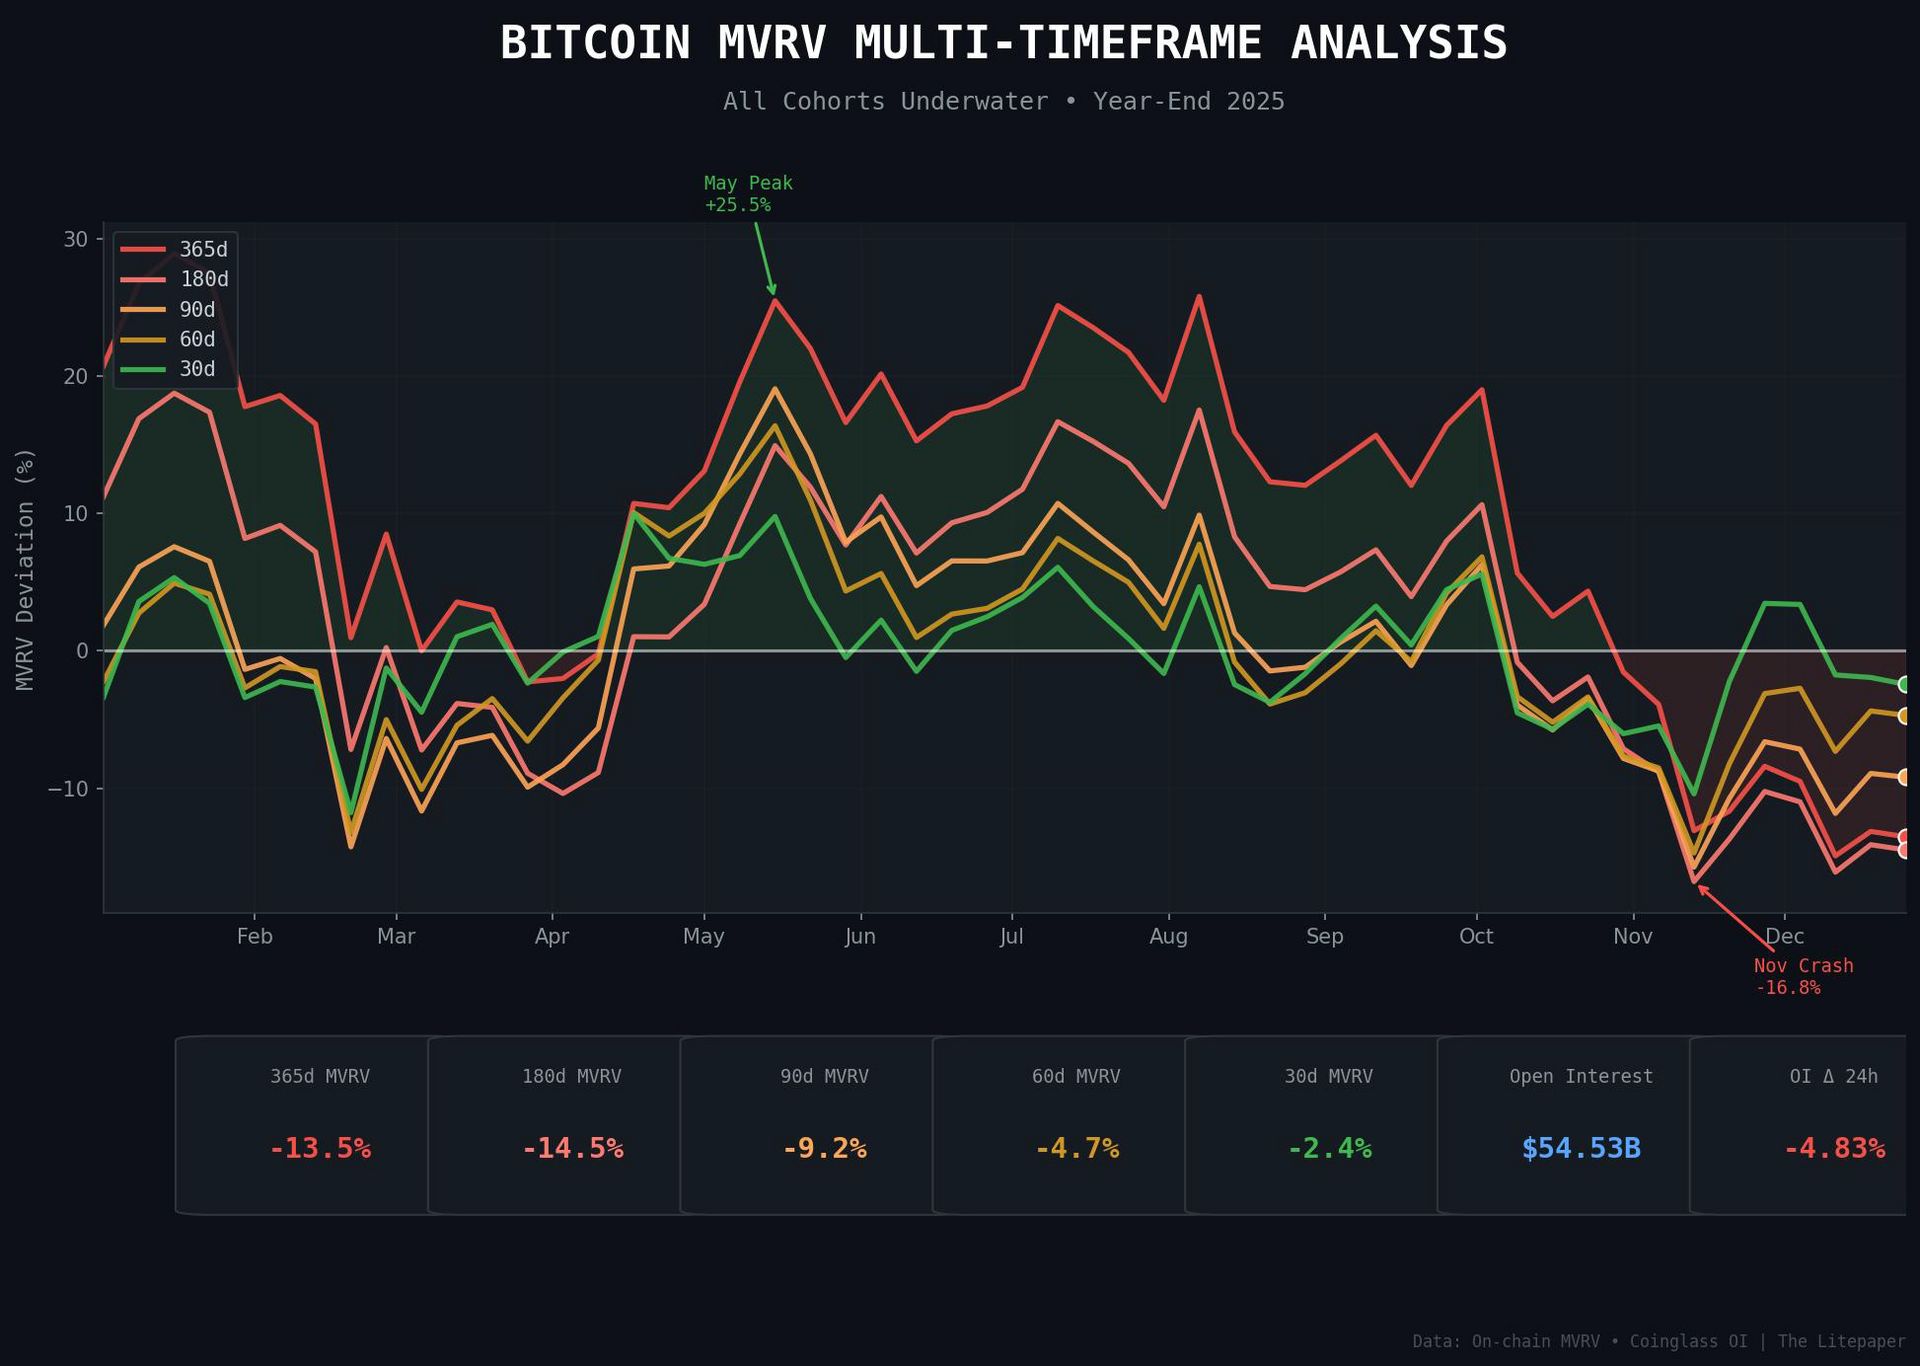
Click to enlarge.
Every single buyer cohort is currently underwater. Not some. Not most. All of them. 😨
The 180-day cohort is the most wrecked at -14.5% – worse than the full-year holders at -13.5%. Let that sink in. People who bought in June-July are sitting on bigger losses than January buyers.
The 30-day cohort? Only -2.4% underwater. Recent entrants aren’t feeling the pain like the spring/summer FOMO crowd. That’s actually constructive – weak hands have been shaken out, building a cleaner base.
Meanwhile, OI tells its own story: $54.53B with a -4.83% bleed in 24 hours. That’s voluntary deleveraging heading into year-end. The OI/Volume ratio at 0.929 shows leverage isn’t excessive relative to actual activity. We’re not in “everyone’s maxed long” danger territory.
The Tilt: Neutral-to-Bullish
Here’s the thing: this setup is actually constructive despite looking ugly on the surface. Universal underwater MVRV + declining OI without panic liquidations = capitulation already happened. 👎️
ON-CHAIN ANALYSIS
Ethereum: The Deeper Hole 🕳️
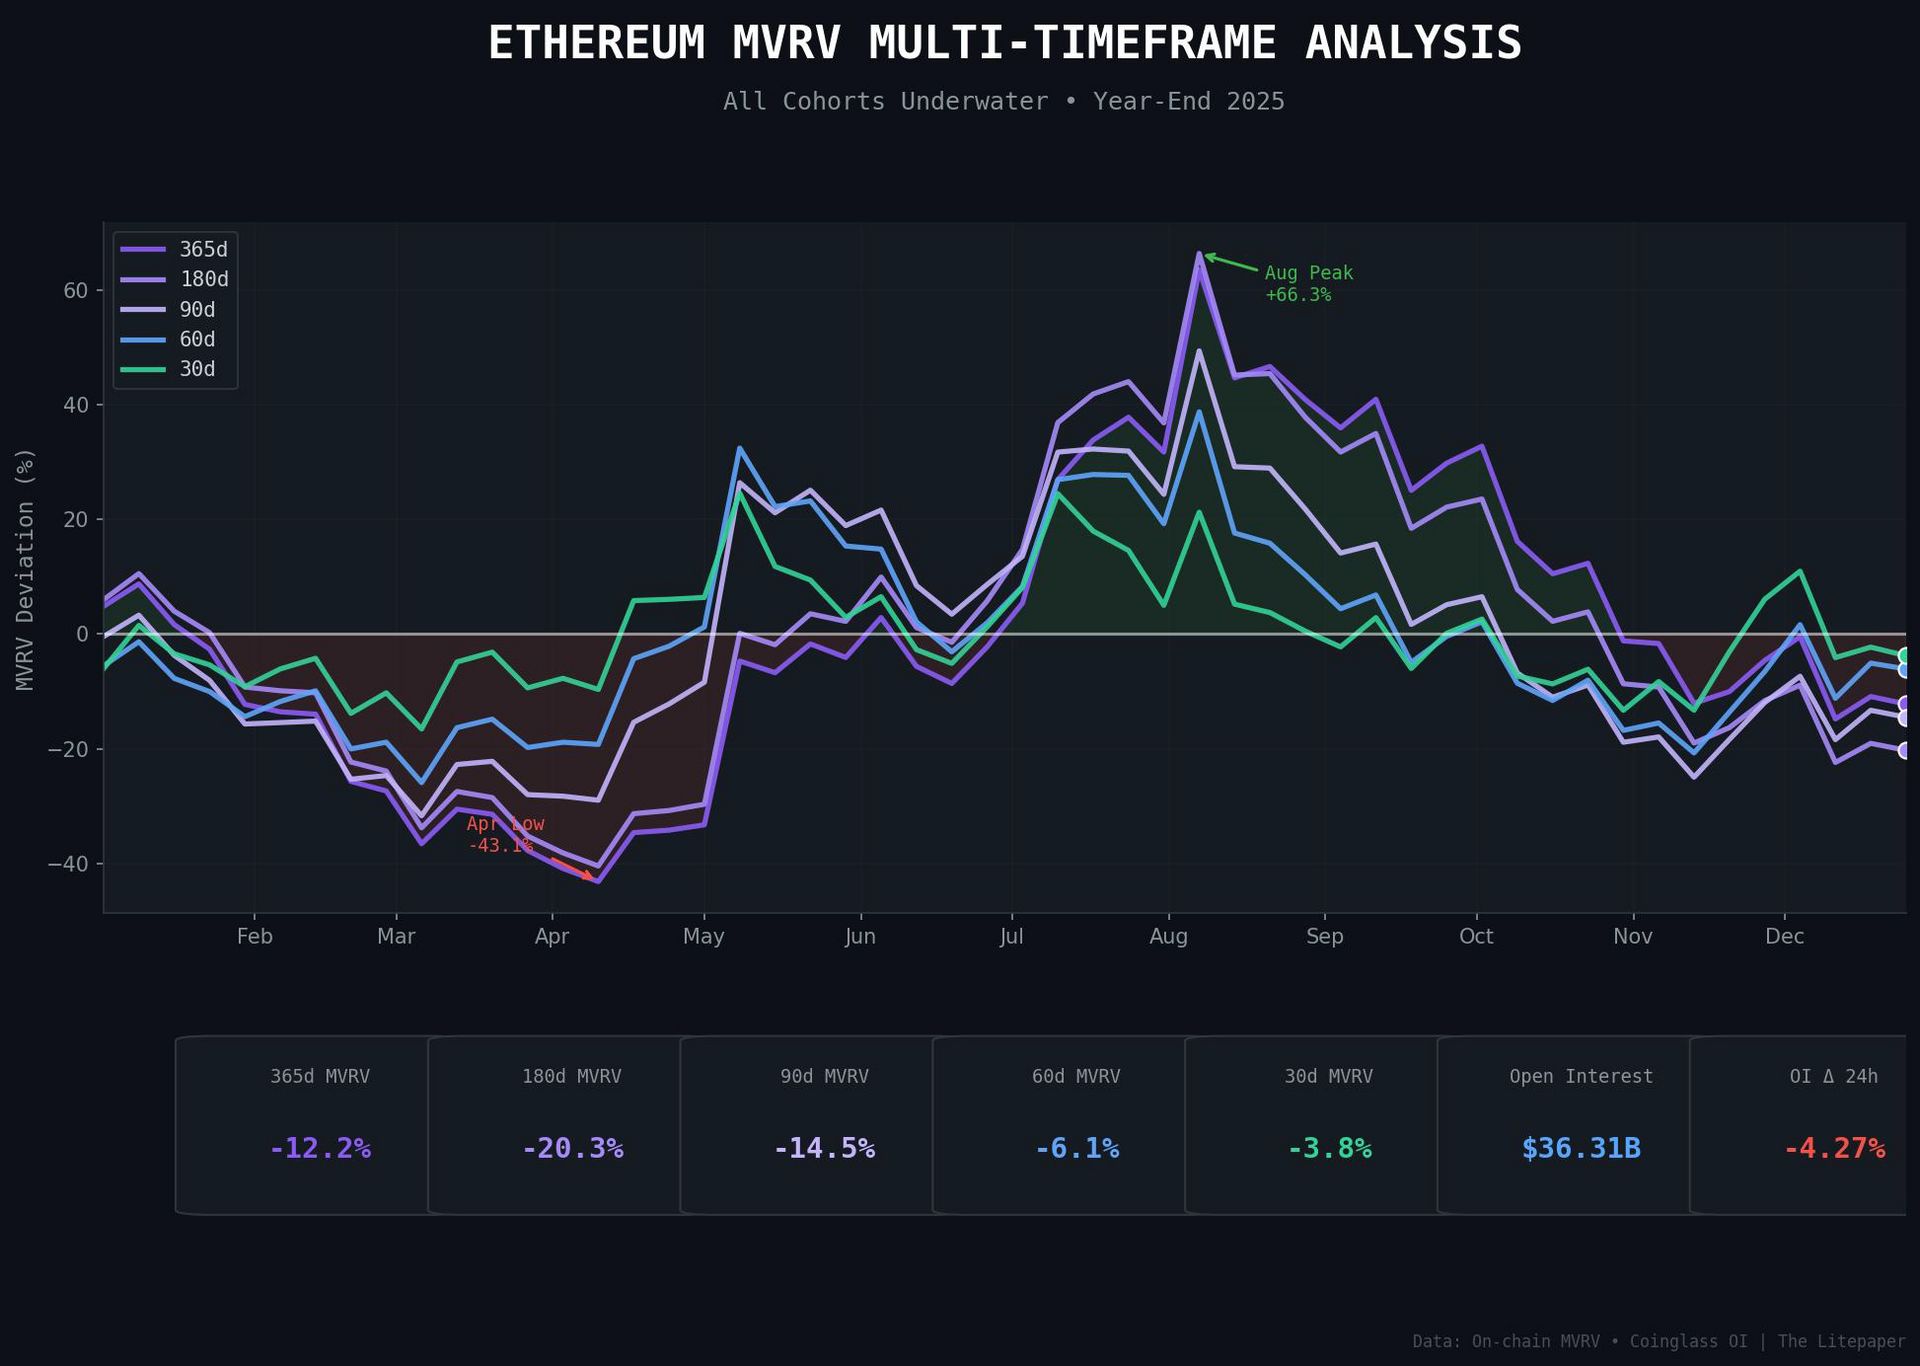
Click to enlarge.
If Bitcoin’s MVRV picture looked uncomfortable, Ethereum’s is worse. 😭
The 180-day cohort sits at -20.3%. Summer buyers who caught the August euphoria spike to +66% are now sitting on losses that dwarf Bitcoin’s equivalent cohort.
Here’s what makes ETH structurally weaker: the 365-day holders are only -12.2% underwater versus the 180d at -20.3%. In Bitcoin, those numbers were much closer (-13.5% vs -14.5%). ETH’s mid-year buyers got absolutely wrecked relative to longer-term holders.
OI confirms the lack of conviction: $36.31B with -4.27% dive 24 hours. The OI/Volume ratio at 0.81 is actually lower than BTC’s 0.93, meaning even less leverage relative to activity.
The Tilt: Bearish
Unlike Bitcoin, ETH doesn’t have the “capitulation already happened” excuse. The April low hit -43% on the 365d MVRV – that was capitulation. But it rallied, peaked in August, and are now sliding back toward those lows without the same panic.
The 30d cohort at only -3.8% underwater is the one silver lining – but it’s not enough to flip the tilt. Or tilt the tilt. Or untilt the til. Whatever, ETH needs to reclaim the zero line on shorter timeframes while longer ones stabilize. 🛳️
ON-CHAIN ANALYSIS
XRP: The Hangover From January’s Party 🍻
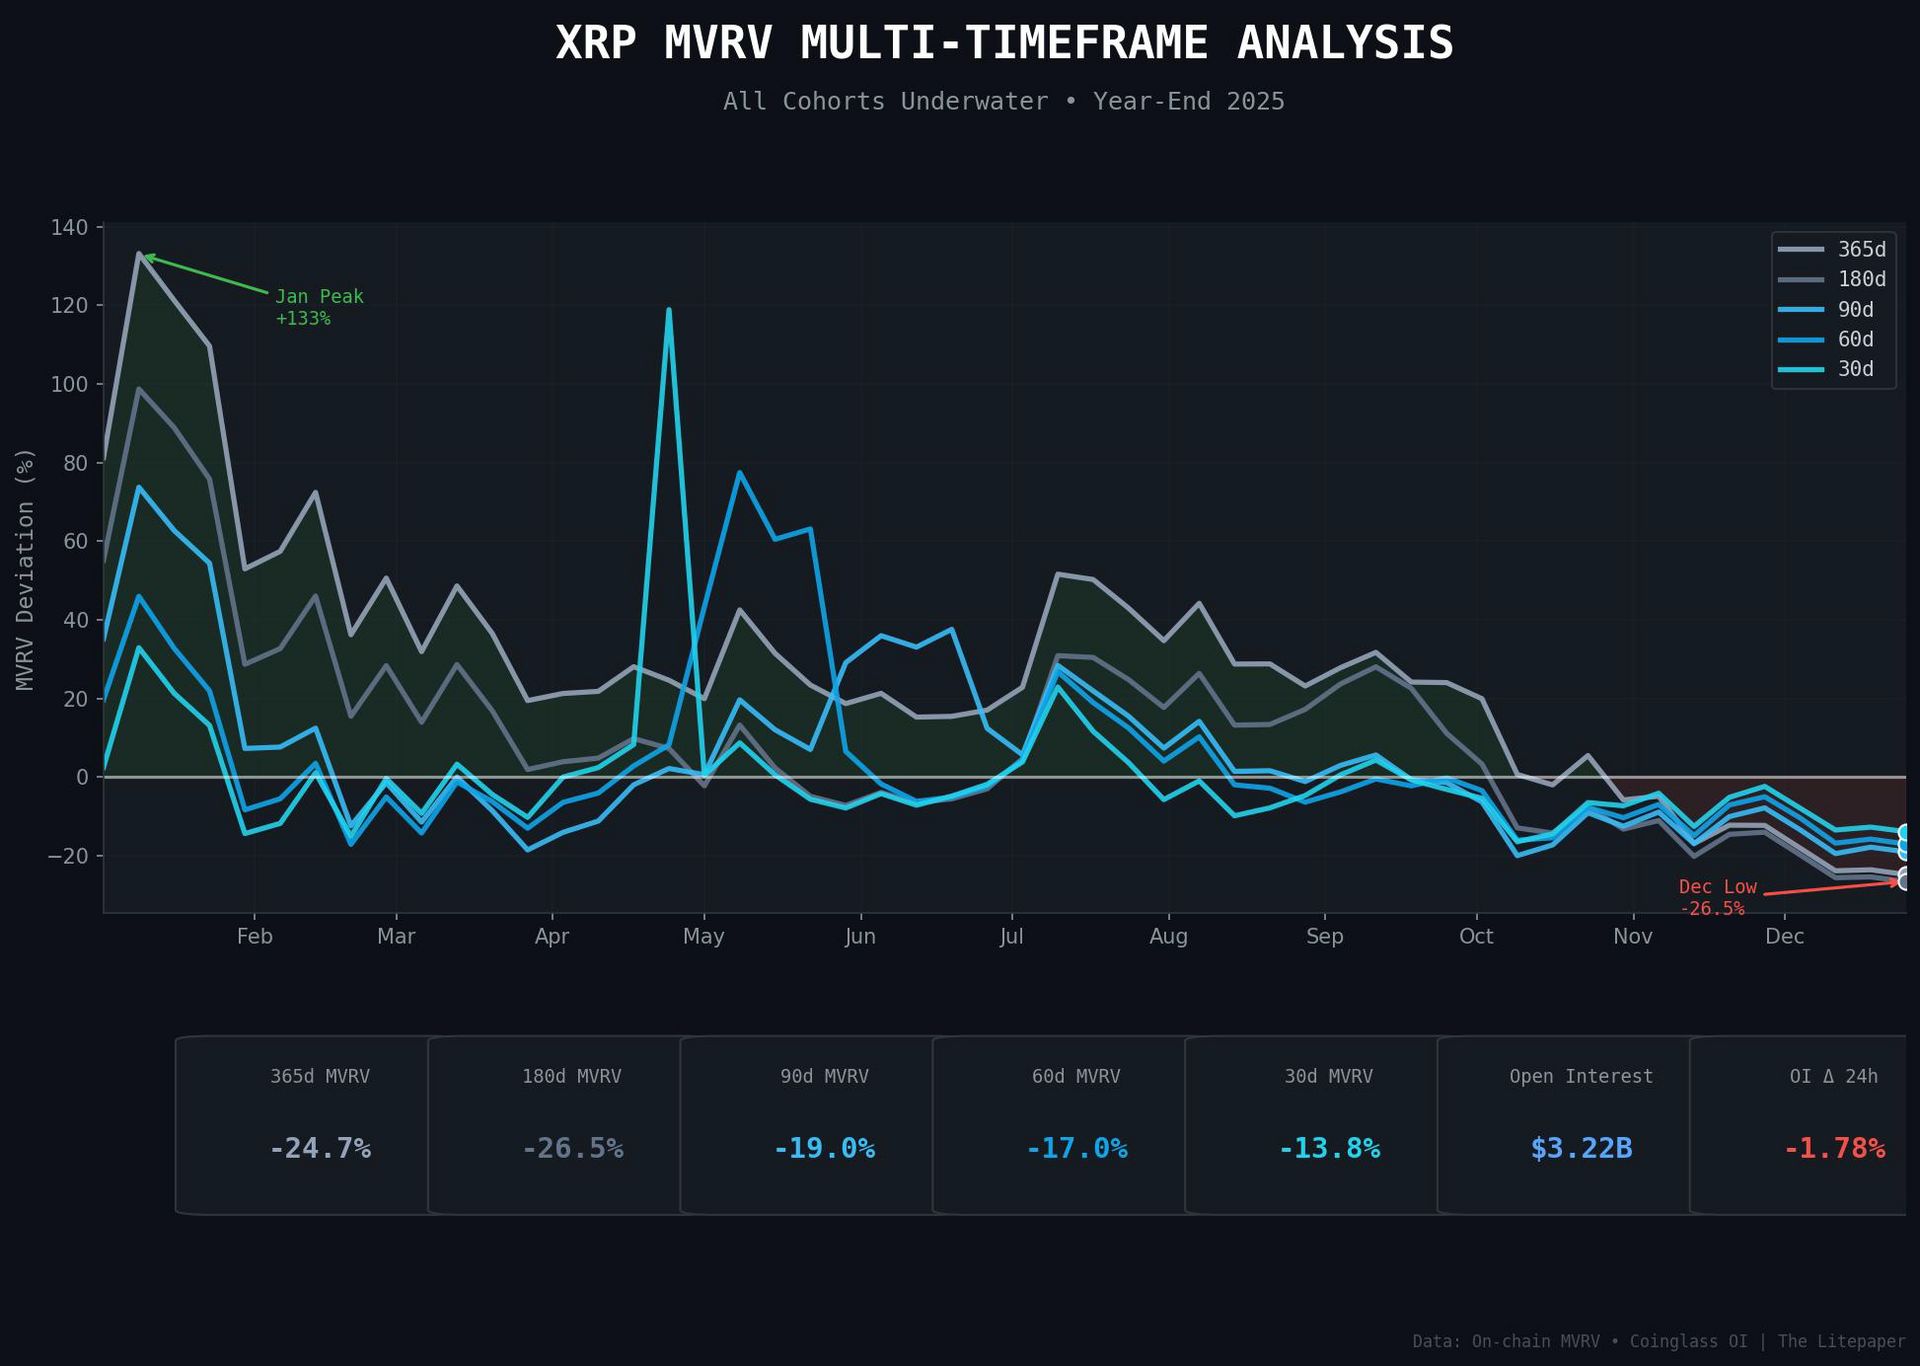
Click to enlarge.
Great balls of rocky mountain oysters Batman this is the longest hangover recovery ever. 🍾
Remember January 2025? The 365-day MVRV hit +133% – every holder from the prior year was sitting on a double-plus. Fast forward to year-end: that same cohort is now -24.7% underwater. The 180-day holders? Down -26.5%, the worst reading across BTC, ETH, and XRP.
Here’s what makes XRP’s structure uniquely full of suck: the OI/Volume ratio sits at 1.13 – higher than both BTC (0.93) and ETH (0.81). What I’m saying is there’s more leverage relative to actual trading activity, not less. And the 24-hour OI dip? Only -1.78% compared to BTC’s -4.83%.
The stubborn longs haven’t flushed.
The Tilt: Bearish
XRP needs a leverage flush that hasn’t happened. When OI/Vol is elevated and 24h deleveraging is the slowest of the majors, you’re looking at an asset where the pain trade is ahead, not behind.
HOWEVER – if any of you recall my own creation, the Leverage Absorption Ratio (LAR) – which I really need to do another newsletter focus over – there’s signs that the leverage is being absorbed. But just from this data, it looks sketchy.
Moving on: The 30d cohort at -13.8% underwater shows even recent buyers are getting smoked – no accumulation zone forming, just continuous distribution from January’s exit liquidity event.
Until that OI/Vol ratio drops below 1.0 and we see actual capitulation volume, XRP remains a relative underperformer. ⬇️
ON-CHAIN ANALYSIS
Cardano: The Deepest Hole in Crypto 😐️
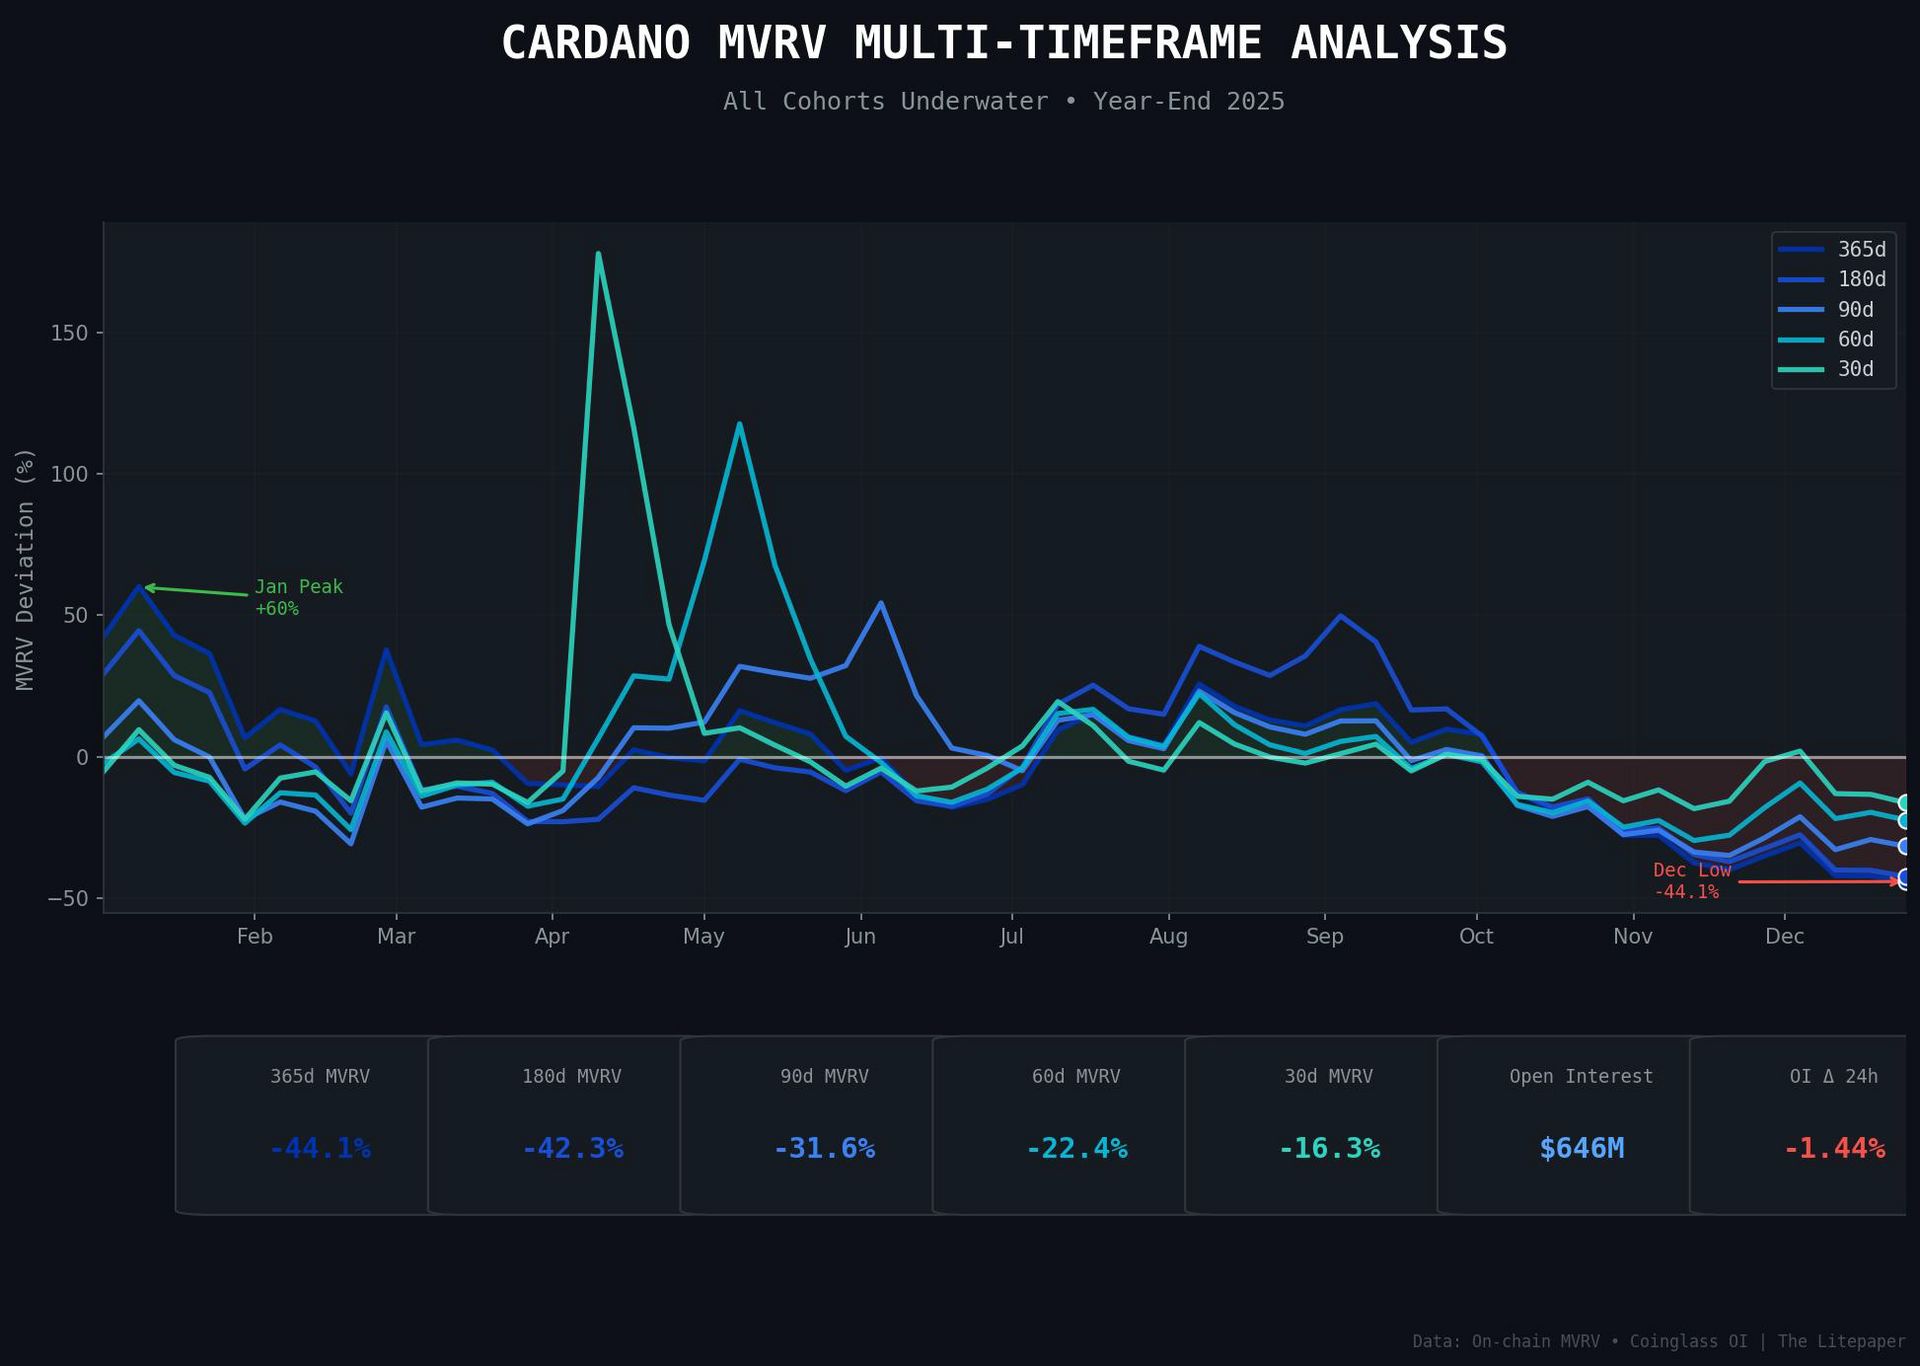
Click to enlarge.
Cardano’s MVRV chart looks like a family photo where everyone knows Dad’s leaving but nobody’s said it out loud yet. 👋
The 365-day holders are down 44%, the 180-day holders are down 42%, and somehow they’re all still at the dinner table pretending the peer-reviewed mashed potatoes are going to fix everything.
It’s the crypto equivalent of the dog sitting in a burning house saying “this is fine” – except the dog paid $3 for ADA and is now staring at $0.85 wondering if Hydra scaling will arrive before the flames reach the couch.
Every single timeframe is deep red: 90d at -31.6%, 60d at -22.4%, even the 30d cohort is -16.3% underwater. There’s no “recent buyers aren’t feeling it” silver lining here. Everyone who bought ADA this year is bleeding.
Here’s the one interesting data point: OI/Vol ratio sits at 0.63 – the lowest of all four assets we’ve covered. BTC is at 0.93, ETH at 0.81, XRP at 1.13. ADA’s leverage positioning is actually cleaner relative to actual trading activity.
The Tilt: Bearish
The depth of underwater MVRV across all timeframes is simply too brutal to ignore. Even with cleaner leverage, you’re looking at an asset where literally everyone is underwater and has been for months. No accumulation structure visible.
On-chain alone, it’s the weakest setup of the majors. 💀
ON-CHAIN ANALYSIS
Chainlink: The Best of a Bad Bunch 👍️

Click to enlarge.
The 180-day holders are down -30.9%, the 365-day at -29.3%. Not pretty. But here’s what separates LINK from the XRP and ADA carnage: the gradient. 📊
The 30-day cohort sits at only -7.8%. Compare that to XRP’s -13.8% or ADA’s truly punching-bag-of-the-majors -16.3%. Recent LINK buyers aren’t getting smoked nearly as hard.
The August peak hit +55% on the 180d MVRV – healthy euphoria. LINK’s highs were more sustainable, which means the reversion to mean is less violent. I mean, if it was a stock the stonk traders would be having panic attacks, but this is crypto so the broken leg LINK is experiencing is more like a stubbed toe in TradFi.
Now the leverage picture: OI/Vol ratio at 0.92 mirrors Bitcoin’s 0.93 almost exactly. The 24h OI drop of -2.93% is moderate. LINK’s derivatives market is acting like a large-cap, not a speculative alt.
The Tilt: Neutral
This isn’t a “back up the truck” call. The depth of underwater MVRV is still concerning, and we need to see shorter timeframes flip positive before confirming accumulation. But LINK has the structural ingredients that XRP and ADA lack: clean leverage, a healthier gradient, and no trapped January euphoria crowd.
Oracle infrastructure plays tend to lag rallies but compound gains in sustained bull markets. If BTC confirms its base, LINK is positioned to outperform the alt pack.
Watch the 30d MVRV – if it crosses positive while longer timeframes stabilize, that’s a yuge sign for bulls. 📶
LINKS
Links That Don’t Suck 🔗
🥈 Is Silver At The Risk Of A Bubble? This Analyst Reportedly Thinks So
5️⃣ Five Cryptocurrencies That Beat The Broader Market In A Volatile 2025
🚣 Crypto Markets Drift Into Year-End With Bitcoin, Ethereum Range-Bound
🏦 Bitwise, Grayscale, Trump Media Lead Wall Street’s Year-End ETF Frenzy
Get In Touch 📬
Email me, Jonathan Morgan, feedback; I’d love to hear from you. 📧
Follow me on Stocktwits 🫂 And Sponsor this newsletter 😎
Terms & Conditions 📝
Securities Disclaimer: STOCKTWITS IS NOT A TAX ADVISOR, BROKER, FINANCIAL ADVISOR OR INVESTMENT ADVISOR. THE SERVICE IS NOT INTENDED TO PROVIDE TAX, LEGAL, FINANCIAL OR INVESTMENT ADVICE, AND NOTHING ON THE SERVICE SHOULD BE CONSTRUED AS AN OFFER TO SELL, A SOLICITATION OF AN OFFER TO BUY, OR A RECOMMENDATION FOR ANY SECURITY. Trading in such securities can result in immediate and substantial losses of the capital invested. You should only invest risk capital, and not capital required for other purposes. You alone are solely responsible for determining whether any investment, security or strategy, or any other product or service, is appropriate or suitable for you based on your investment objectives and personal and financial situation. You should also consult an attorney or tax professional regarding your specific legal or tax situation. The Content is to be used for informational and entertainment purposes only and the Service does not provide investment advice for any individual. Stocktwits, its affiliates and partners specifically disclaim any and all liability or loss arising out of any action taken in reliance on Content, including but not limited to market value or other loss on the sale or purchase of any company, property, product, service, security, instrument, or any other matter. You understand that an investment in any security is subject to a number of risks, and that discussions of any security published on the Service will not contain a list or description of relevant risk factors. In addition, please note that some of the stocks about which Content is published on the Service have a low market capitalization and/or insufficient public float. Such stocks are subject to more risk than stocks of larger companies, including greater volatility, lower liquidity and less publicly available information. Read the full terms & conditions here. 🔍
Author Disclosure: The author of this newsletter holds positions in AVAX, ADA, PUDGY, WLC, IMX, XTZ, NEAR, HBAR, ALGO, INJ, LTC, LINK, ZEC, XLM, and FET. 📋