Stocktwits Crypto Data Dive – Week 29

OVERVIEW
Stocktwits Crypto Data Dive – Week 29

Welcome to the Stocktwits Crypto Data Dive for Week 29 of 2025! 📊
In this issue, we’ll dive into the data to keep you informed about the progress of the overall crypto market and shine a spotlight on emerging and established trends.
What You’ll Find In The Stocktwits Crypto Data Dive has three main objectives:
-
Total and Altcoin caps, stamped with YTD moves and the gap to ATH.
-
Seven-layer market-cap recap (TMC ex-stables, ex-top-50, and five more flavors).
-
Crypto Index Performance covering 12 indices.
-
The Liquidation Station boards the train with 30-day totals plus a 7-day heatmap for maximum schadenfreude.
-
Market Heatmap, Social Volume Heatmap, Active Address Heatmap.
-
ETF scorecards for BTC and ETH still tracking 7- and 30-day flows.
So, without further delay, let’s jump right into the data from week 29 and explore its intriguing insights! 🚀
CRYPTO
Crypto Market Cap Update
What is the broader trend within the crypto market? The simplest way to track this is by using three market cap charts. So let’s see what we got. 🔭
*the price levels and performance values may be very different from what you read in your mailbox vs. what’s happening in the live market. This is especially true when crypto faces a new bull or bear run.
Total Market Cap
-
All-Time High: $3.81 trillion
-
YTD: +17%
-
From ATH: 0%

Click to enlarge.
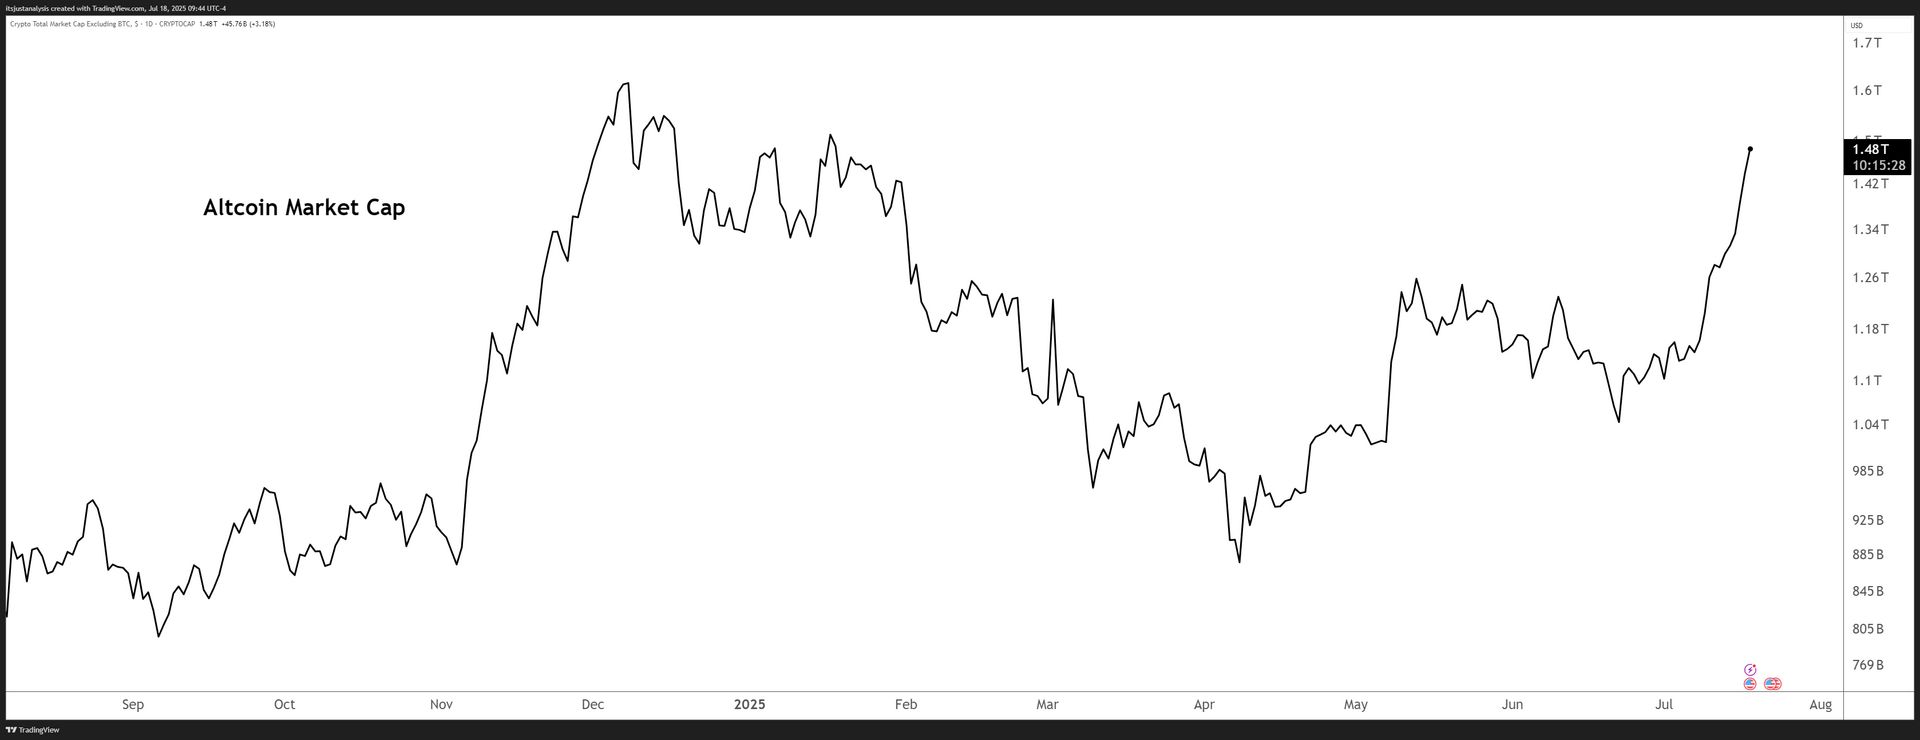
Altcoin Market Cap
-
All-Time High: $1.63 trillion
-
YTD: +8%
-
From ATH: -8%
Click to enlarge.
CRYPTO
Total Market Cap (TMC) Performance For 2025
|
Index |
Value |
Weekly Performance |
|---|---|---|
|
TMC Excluding BTC and ETH |
$810B |
+13% |
|
TMC Excluding BTC and Stablecoins |
$868B |
+17% |
|
TMC Excluding BTC, ETH, and Stablecoins |
$575B |
+17% |
|
TMC Excluding Stablecoins |
$3T |
+7% |
|
TMC Excluding Top 10 |
$225B |
+13% |
|
TMC Excluding Top 50 |
$57B |
+13% |
|
TMC Excluding Top 100 |
$12B |
+12% |
CRYPTO
Crypto Index Performance For 2025
|
Index |
Weekly Performance |
|---|---|
|
AI |
+12% |
|
Decentralized Finance |
+15% |
|
Decentralized Physical Infrastructure |
+13% |
|
Exchange Tokens |
+9% |
|
Layer 1 |
+7% |
|
Meme |
+13% |
|
Proof-Of-Stake |
+14% |
|
Proof-Of-Work |
+3% |
|
Real World Asset Tokenization |
+25% |
|
Rehypothecated |
+12% |
|
Smart Contracts |
+14% |
|
Stablecoins |
+1% |
CRYPTO
Liquidation Station 😱
Interested in how much has been flushed out of leveraged long and short positions? Who’s getting hurt the most? This is the best place to get an idea of how leveraged positions are doing. 🔴
30-day Total Liquidations 📆
What You’re Looking At
-
Green bars above zero = longs blown out because price fell.
-
Red bars below zero = shorts blown out because price ripped.
-
Left-hand scale is U.S. dollars (millions); the dashed line near the top sits at $1B.
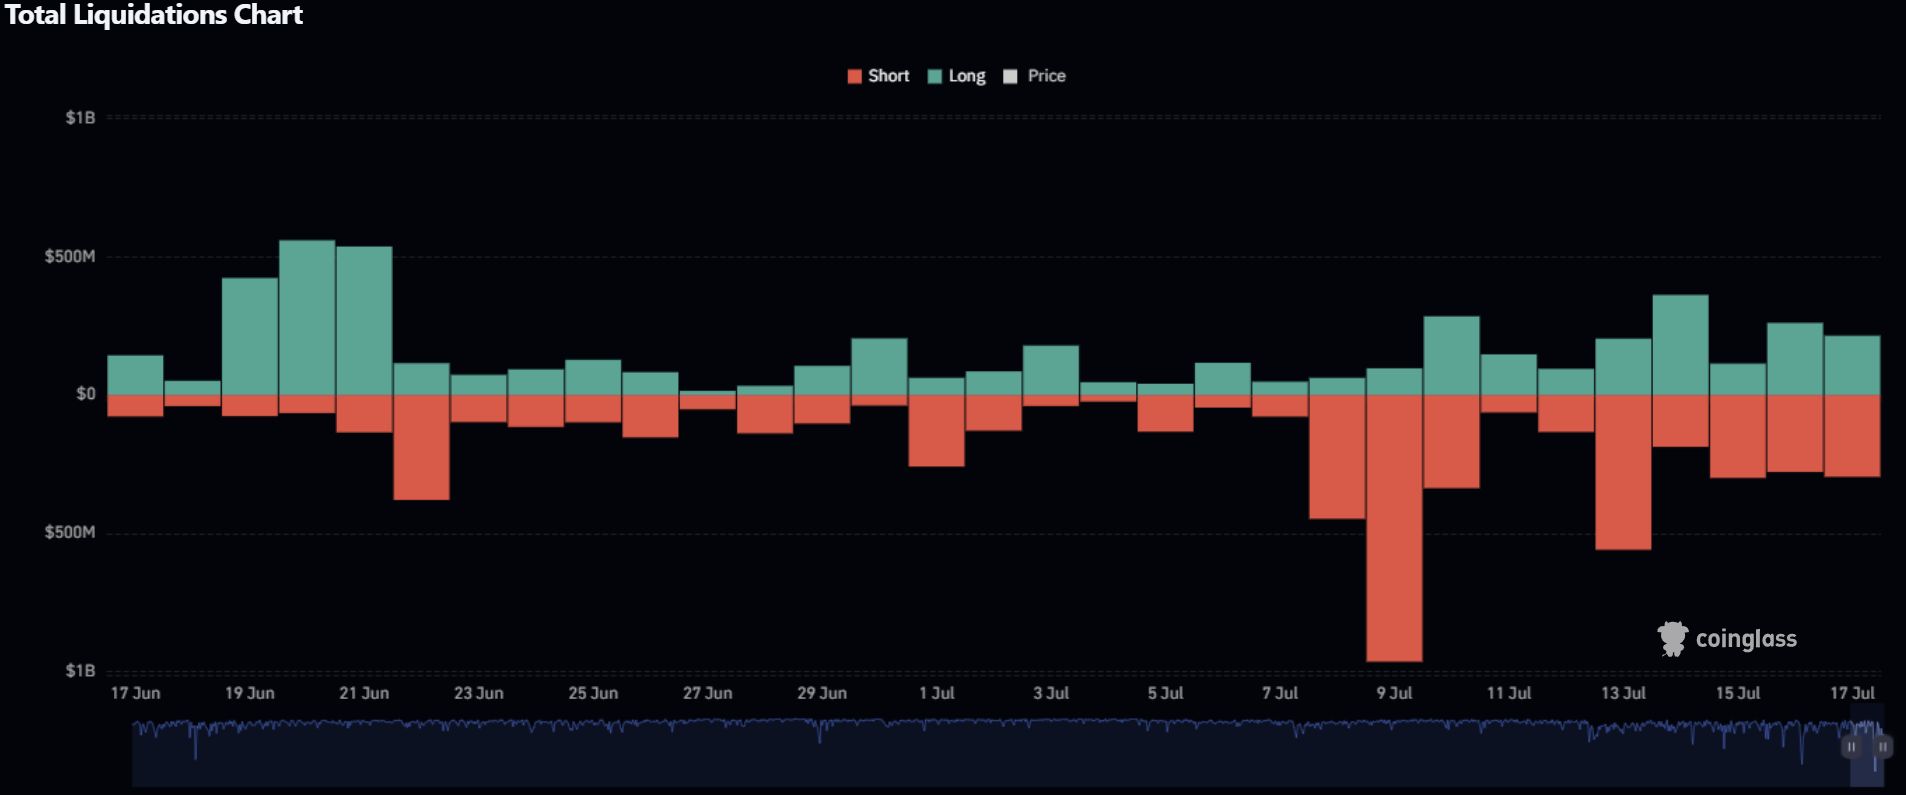
30-day Total Crypto Liquidation Chart – Click to enlarge.
-
June 19 – June 21 – three-day cluster, roughly $1B in long liquidations as hawkish Fed commentary killed risk appetite.
-
June 23 – snap-back rally torched $350M in shorts—all those “fade the bounce” trades aged poorly.
-
July 1 – month-end window dressing cleared $300M in shorts when BTC drifted higher.
-
July 9 – biggest spike of the window: $1B in shorts vaporised as BTC ripped toward $120 K.
-
July 14 – July 15 – bullish euphoria overstayed; nearly $700M longs flushed when BTC stalled just under the new high.
7-day Liquidation Heat Map 🌡️
What You’re Looking At
-
Rows = coins, columns = timestamps.
-
Color = head-count of forced liquidations (legend tops at 2 000).
-
A cell showing “BTC 1,600” means 1,600 separate BTC positions were liquidated.
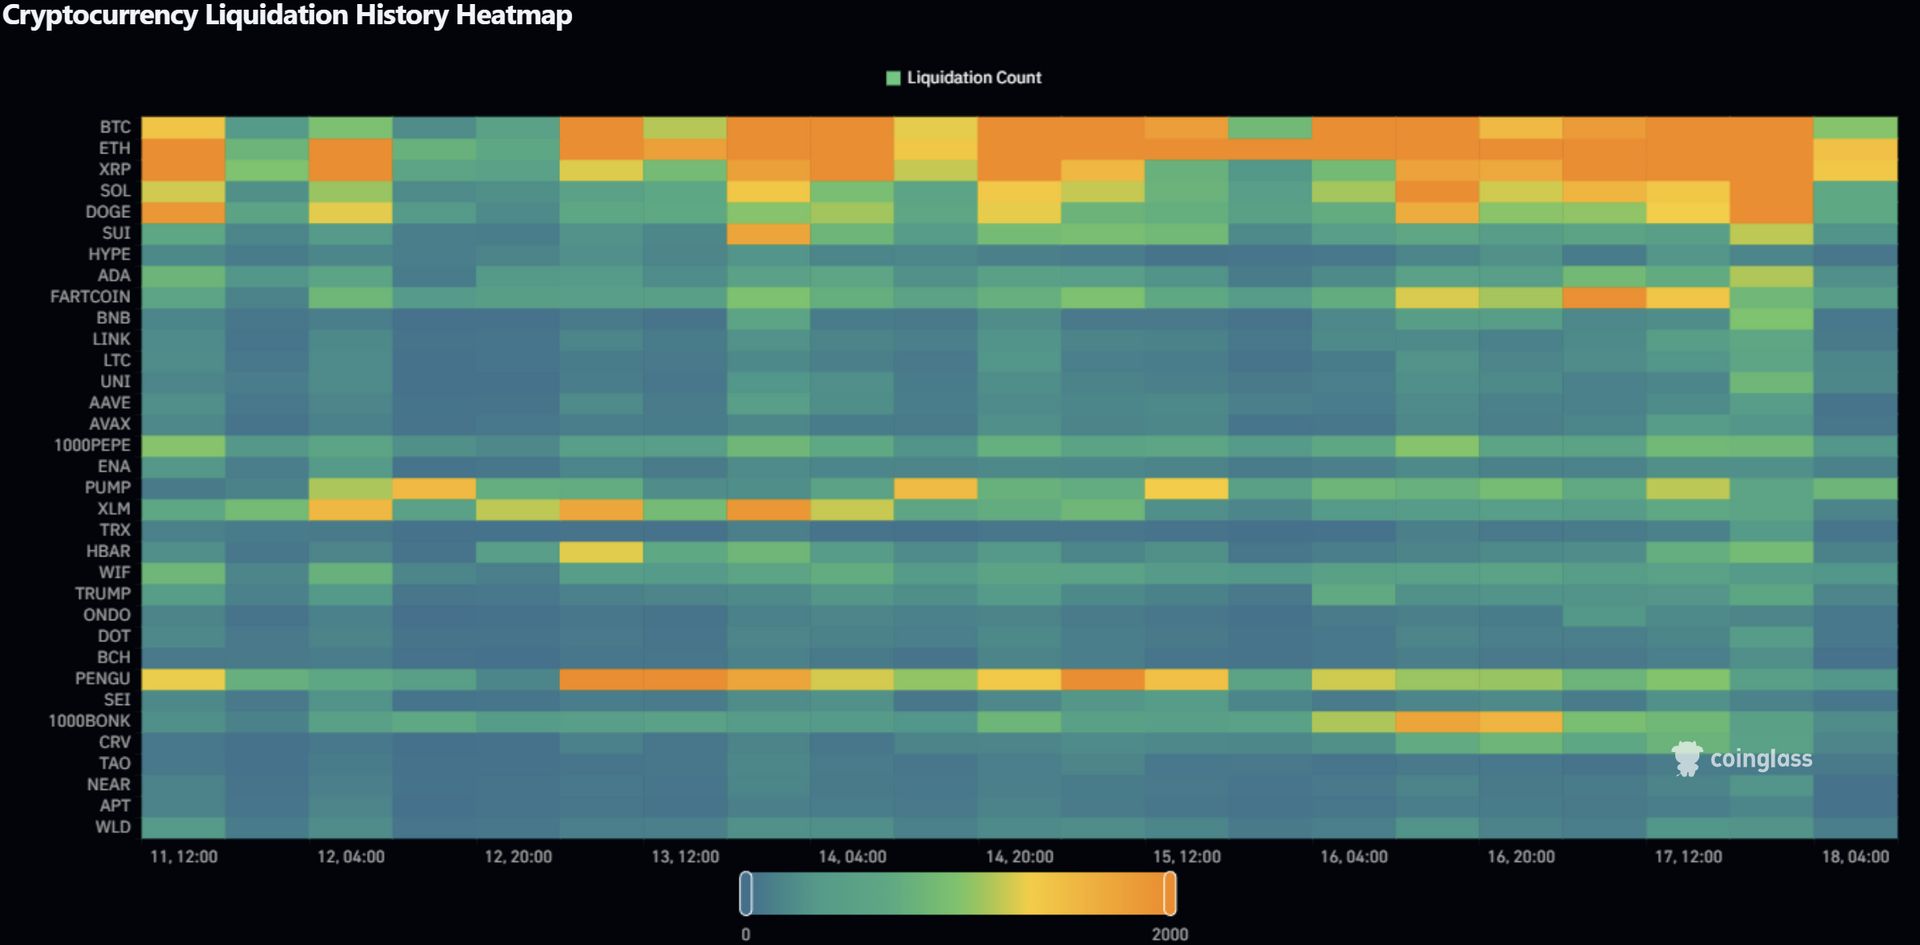
7-day Cryptocurrency Liquidation Heatmap – Click to enlarge.
-
July 11 – U.S. PPI surprise: BTC 1,600 liquidations, ETH 1,400, XRP tilts orange as traders yank risk.
-
July 12 – July 12 – XRP and ETH orange streaks (>1,500) amid fresh SEC rumor mill; BTC stays green but busy.
-
July 13 – July 14 – broad orange wall: BTC tags the 2,000 cap; ETH/SOL/XRP each >1,500 as BTC’s breakout accelerates.
-
July 15 – alt-coin rotation: meme names (PUMP, 1000PEPE, PENGU) flash yellow after TikTok hype, while majors cool to green.
-
July 17 – final pop: BTC & ETH greens turn yellow again (>1,000) following hotter-than-expected Chinese GDP data.
Some Interesting Insights 👓️
Leverage roulette is alive and well: Two $1B-class short purges (June 19-21 longs, July 9 shorts) inside a single month prove both sides keep re-loading the gun.
Head-count records keep breaking: The 2,000 liquidations-per-hour cap, new in July, was tagged twice this week, up from last month’s 1,200 ceiling.
Macro headlines remain the kill switch: Fed talk, U.S. inflation beats, SEC noise, and Chinese data lined up within minutes of every orange column. Ignore the data calendar and you’ll star in the next wipe-out.
Early-warning rule still pays: When BTC or ETH cells flip yellow/orange, alt-coins light up soon after—trim risk or tighten stops on that signal.
Risk cue to tattoo on your monitor: Any day showing >$600M liquidated or any hour with >1,500 forced closes almost always precedes a violent counter-move inside 48 hours. Trade size like you actually want to keep your collateral.🧠
SPONSORED
Stocktoberfest 2025: Where Markets Meet the Coast

Stocktoberfest 2025 returns Oct 20-22 at the iconic Hotel del Coronado, bringing together retail investors, public company execs, and analysts for three days of real conversations, market insights, and beachside networking – all with a stein in hand. 🍺
✔️ Panels, workshops, and unfiltered discussions
✔️ Golf, sailing, yoga excursions
✔️ Sunset Biergarten showdowns and private dinners
Come for the markets. Stay for the sunsets and steins. 🌅🍻
🎟️ Tickets are moving fast, grab yours → Exclusive Early-Bird Pricing
HEATMAP
Total Crypto Market Heatmap 🌡️
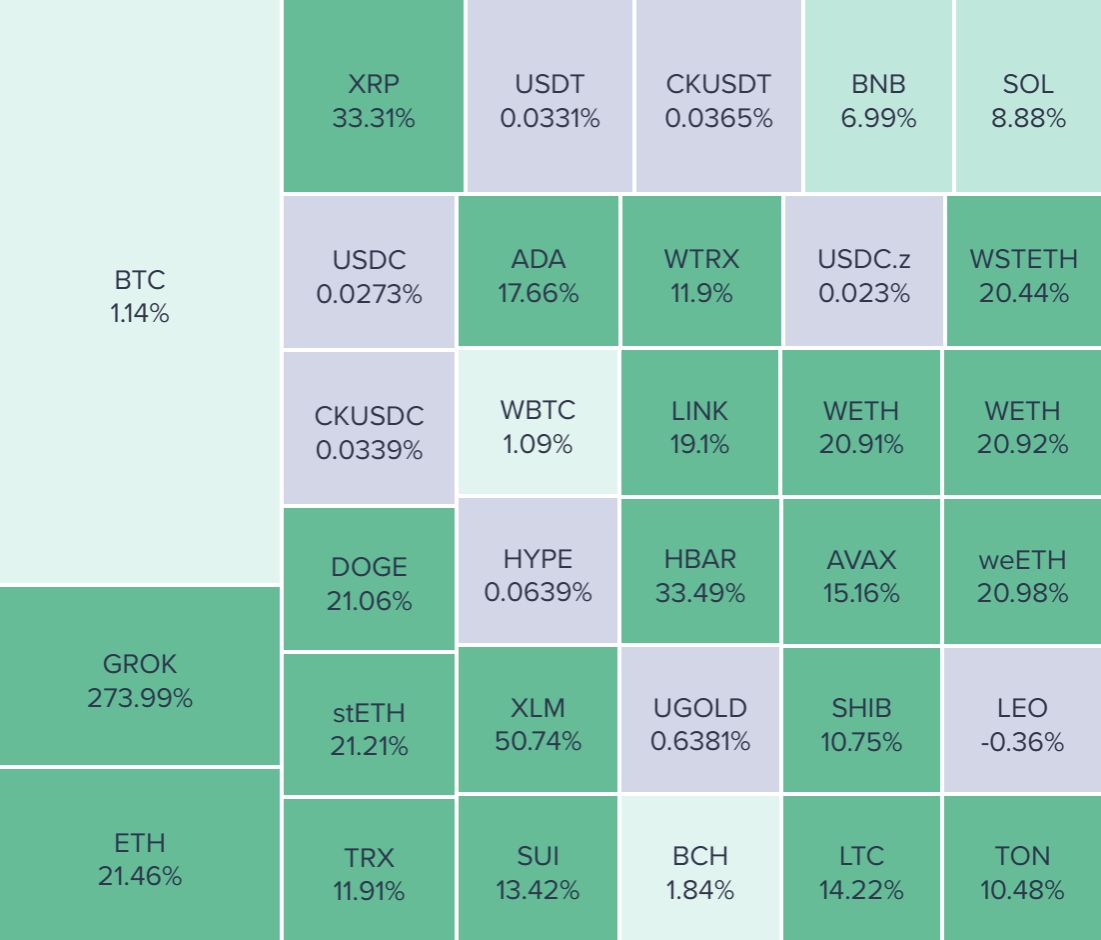
Weekly Heat Map – Source: Santiment – Click to enlarge.
Social Volume Heatmap 🗨️
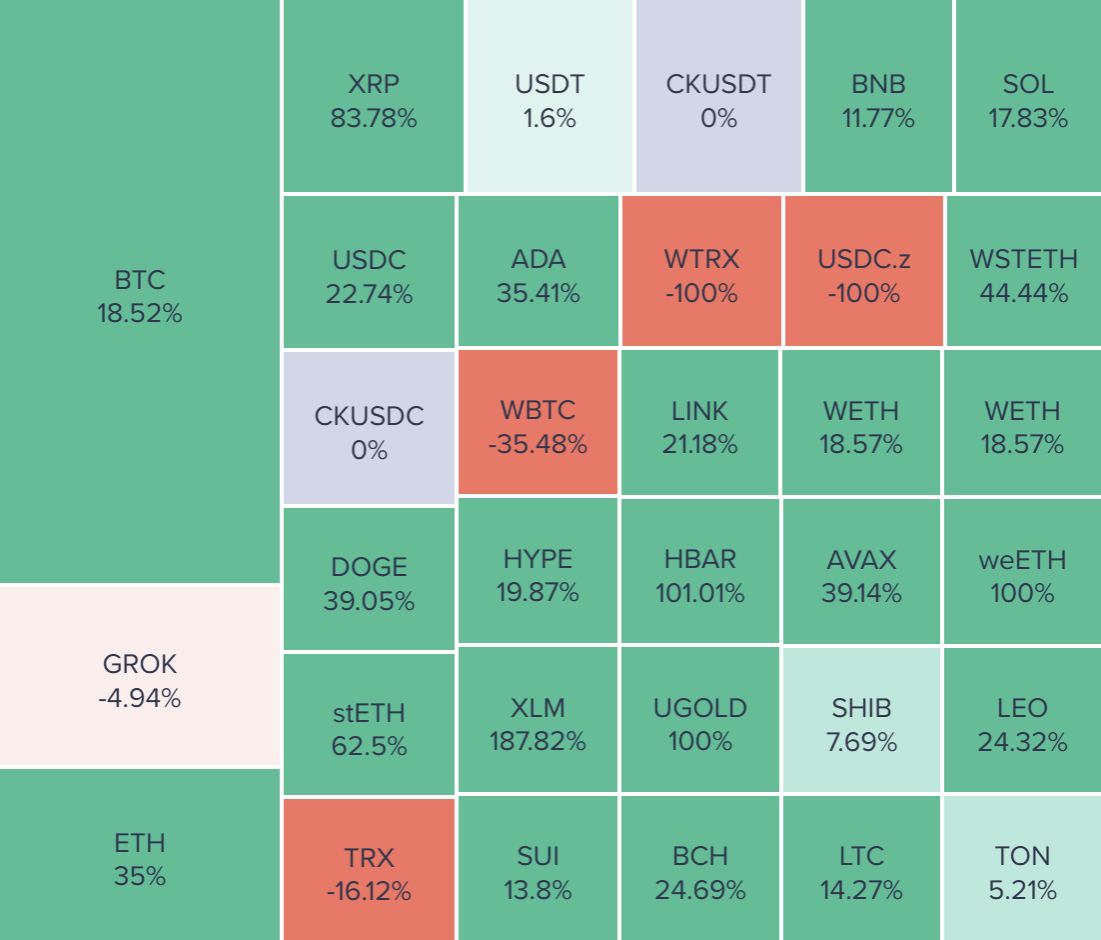
Weekly Heat Map – Source: Santiment – Click to enlarge.
Active Addresses Heatmap 📫️
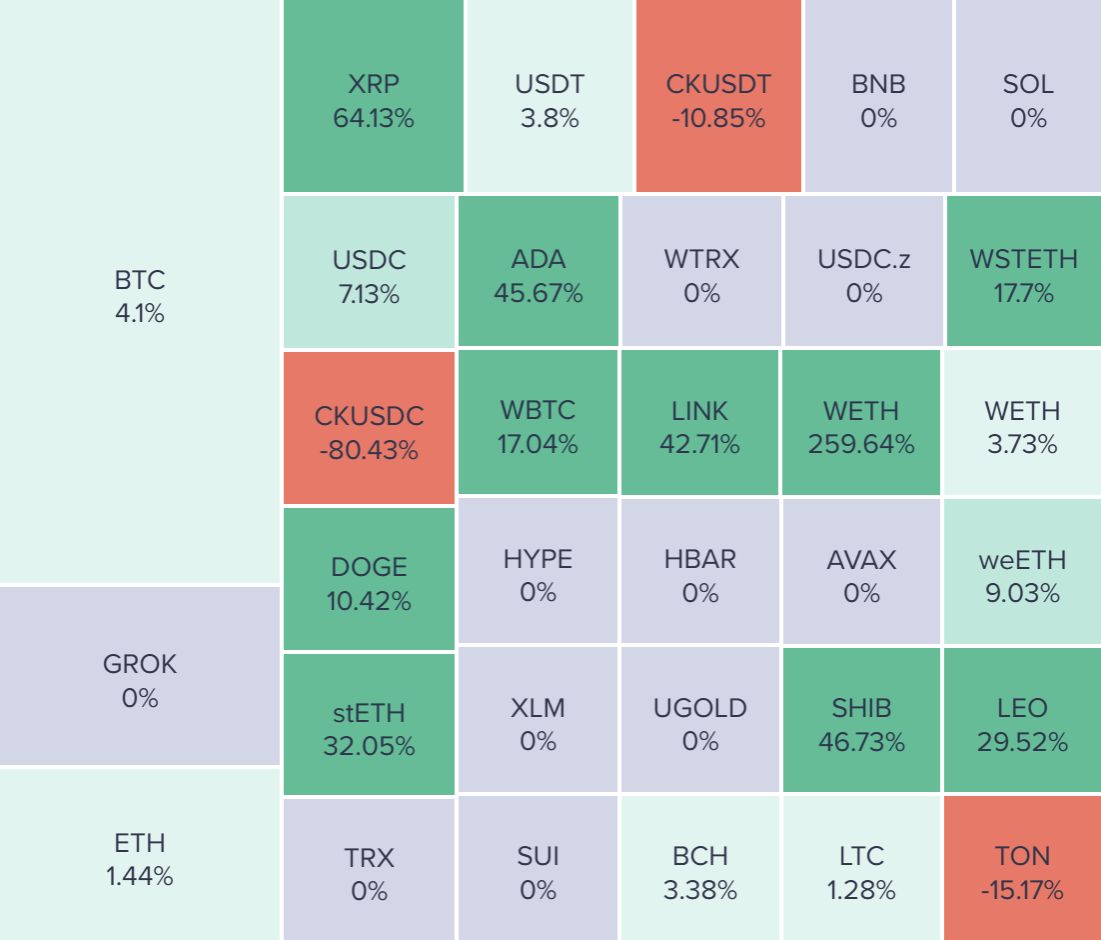
Weekly Active Addresses Heat Map – Source: Santiment – Click to enlarge.
CRYPTO
BTC ETF HODLINGS 🧲
|
ETF |
Current BTC |
7-Day Change |
30-Day Change |
|---|---|---|---|
|
BlackRock |
720,050 |
18,300 |
46,110 |
|
Fidelity |
358,310 |
-2,210 |
-909 |
|
Grayscale |
215,170 |
-18,210 |
-18,680 |
|
Ark Invest |
46,960 |
-1,730 |
819 |
|
Bitwise |
40,960 |
902 |
2,030 |
|
Purpose Investments |
21,050 |
-142 |
-389 |
|
VanEck |
16,290 |
466 |
827 |
|
21Shares |
13,200 |
-133 |
-117 |
|
Wisdom Tree |
13,190 |
147 |
400 |
|
ETC Group |
12,020 |
-252 |
-312 |
|
Valkyrie |
5,810 |
0 |
32 |
|
Invesco |
5,410 |
45 |
313 |
|
Franklin Templeton |
5,300 |
58 |
258 |
|
Bosera Funds |
1,640 |
4 |
3 |
|
Total |
1,475,360 |
-2,755 |
30,385 |
CRYPTO
ETH ETF HODLINGS 🔐
|
ETF |
Current ETH |
7-Day Change |
30-Day Change |
|---|---|---|---|
|
BlackRock |
2,140,000 |
249,050 |
486,110 |
|
Grayscale |
1,750,000 |
37,410 |
46,430 |
|
Fidelity |
324,520 |
308 |
-11,330 |
|
Bitwise |
124,000 |
12,040 |
21,770 |
|
21Shares |
108,050 |
-368 |
244 |
|
Purpose Investments |
106,190 |
238 |
-3,690 |
|
VanEck |
86,070 |
6,320 |
10,510 |
|
ETC Group |
45,980 |
1,090 |
996 |
|
Wisdom Tree |
23,580 |
1,860 |
2,840 |
|
Franklin Templeton |
19,360 |
3 |
5,310 |
|
Invesco |
10,210 |
1,100 |
1,100 |
|
Bosera Funds |
6,690 |
-6 |
-137 |
|
Total |
4,744,650 |
309,045 |
560,153 |
Get In Touch 📬
Follow our social channels for great, real-time content on Stocktwits and Twitter. And check out our YouTube channel for in-depth video content! 📲
Email me (Jonathan Morgan) your feedback; I’d love to hear from you. 📧
Want to sponsor this newsletter and reach hundreds of thousands of crypto enthusiasts? Reach us here. 👍
Terms & Conditions 📝
Securities Disclaimer: STOCKTWITS IS NOT A TAX ADVISOR, BROKER, FINANCIAL ADVISOR OR INVESTMENT ADVISOR. THE SERVICE IS NOT INTENDED TO PROVIDE TAX, LEGAL, FINANCIAL OR INVESTMENT ADVICE, AND NOTHING ON THE SERVICE SHOULD BE CONSTRUED AS AN OFFER TO SELL, A SOLICITATION OF AN OFFER TO BUY, OR A RECOMMENDATION FOR ANY SECURITY. Trading in such securities can result in immediate and substantial losses of the capital invested. You should only invest risk capital, and not capital required for other purposes. You alone are solely responsible for determining whether any investment, security or strategy, or any other product or service, is appropriate or suitable for you based on your investment objectives and personal and financial situation. You should also consult an attorney or tax professional regarding your specific legal or tax situation. The Content is to be used for informational and entertainment purposes only and the Service does not provide investment advice for any individual. Stocktwits, its affiliates and partners specifically disclaim any and all liability or loss arising out of any action taken in reliance on Content, including but not limited to market value or other loss on the sale or purchase of any company, property, product, service, security, instrument, or any other matter. You understand that an investment in any security is subject to a number of risks, and that discussions of any security published on the Service will not contain a list or description of relevant risk factors. In addition, please note that some of the stocks about which Content is published on the Service have a low market capitalization and/or insufficient public float. Such stocks are subject to more risk than stocks of larger companies, including greater volatility, lower liquidity and less publicly available information. Read the full terms & conditions here. 🔍
Author Disclosure: The author of this newsletter holds positions in ADA, LTC, IMX, LINK, WMT, COPI, MIN, AGIX, ALGO, DOGE, ZEC, AVAX, XLM, XTZ, and NEAR. 📋