The Bench Is Getting Hot

The Backdrop is Opportunistic
When the market is in a sustained uptrend, my default posture is simple.
Be opportunistic.
Assume more can go right than wrong, and let price tell you where to place your next bet.

Market Overview Chart
That’s what my market overview chart is showing.
SPY is in a sustained uptrend, RSI is holding in a bullish regime, and the longer-term participation gauge, S&P 500 members above their 200-day, is firm but not euphoric.
It is not a “melt-up” participation breakout.
It is a healthy backdrop that still leaves room for opportunity.
In that environment, the edge is not predicting the next headline.
The edge is diagnosing where leadership is expanding under the surface.
Let’s get into it.
Why look beyond the “obvious” leaders?
The U.S. market is structurally dominated by large-cap tech.
Everyone knows that and most portfolios reflect that, whether intentionally or not.
That is not a criticism. It is just reality.
The unintended consequence is that many investors have very little exposure to the benchwarmers, the areas of the market that do not dominate media cycles or dinner-table conversations, but are quietly resolving higher.
This is where technical analysis matters.
Price lets us go below the surface.
It allows us to be agnostic to sector labels, narratives, CEOs, and headlines.
Price is the truth, and our job is to listen to it.
The Benchwarmers are Getting in The Game
When I look at sector breadth through the lens of shorter-term trend into longer-term trend, the message is pretty clean.
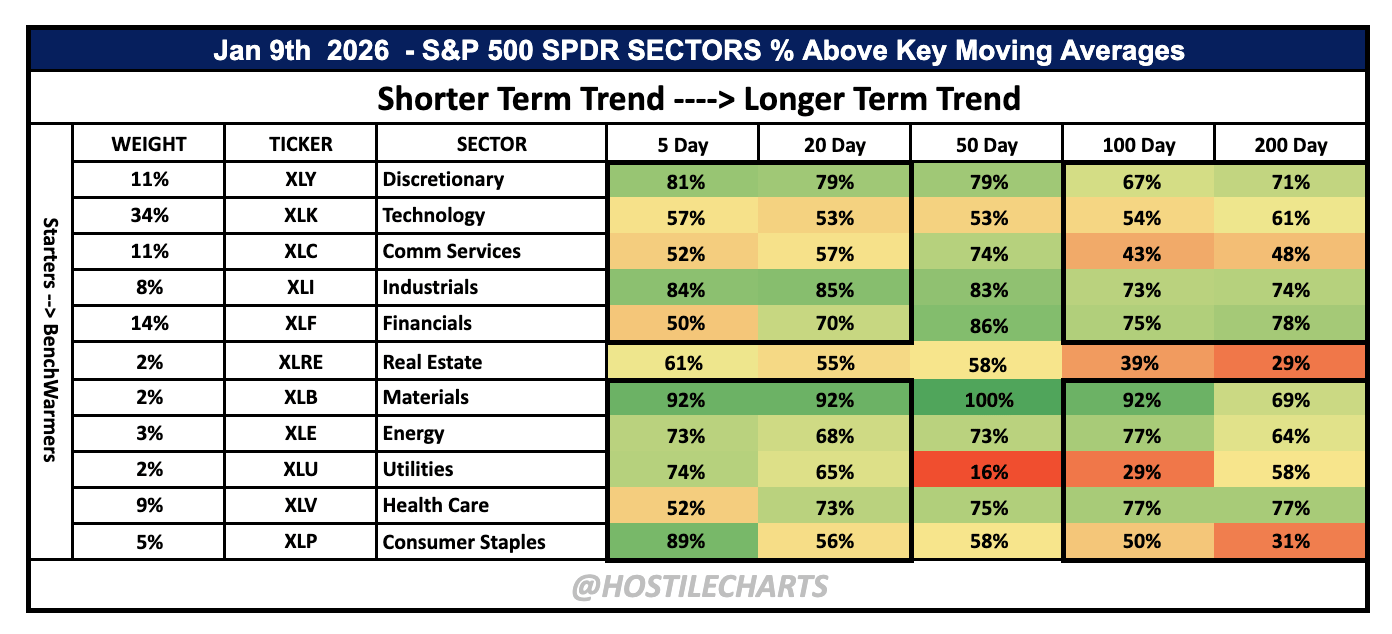
Hostile Breadth Dashboard
Industrials, Financials, and Materials are showing strong multi-timeframe alignment. High participation on the 5-day and 20-day, reinforced by solid participation on the 50, 100, and 200-day. That is what leadership looks like.
A few quick observations:
-
Industrials are not just one or two names. This is broad.
-
Financials look like leadership, not a defensive placeholder.
-
Materials stand out as one of the cleanest looks on the board.
The bigger point is participation is expanding beyond the usual suspects.
That matters in a Bull Market.
7 Actionable Market Areas
I am not here to be the truth. Price is the truth.
I am here to communicate what the tape is currently saying, and where the risk can be defined cleanly.
I’m seeing actionable setups in a lot of areas outside of Tech at the moment.
1) Industrials Breaking Out
This is the type of alignment that tends to show up in real expansions, not just in late-cycle, narrow rallies.

-
Industrials are not one or two names. You are seeing breadth across groups, suppliers, machinery, transport pockets, and more.
2) Financials Are Clean

-
Financials are acting like leadership, not like a defensive placeholder. Some charts are consolidating, but the longer-term alignment is doing the heavy lifting.
3) Materials, nobody’s favorite trade
Materials are a great example of the benchwarmer thesis in real time.
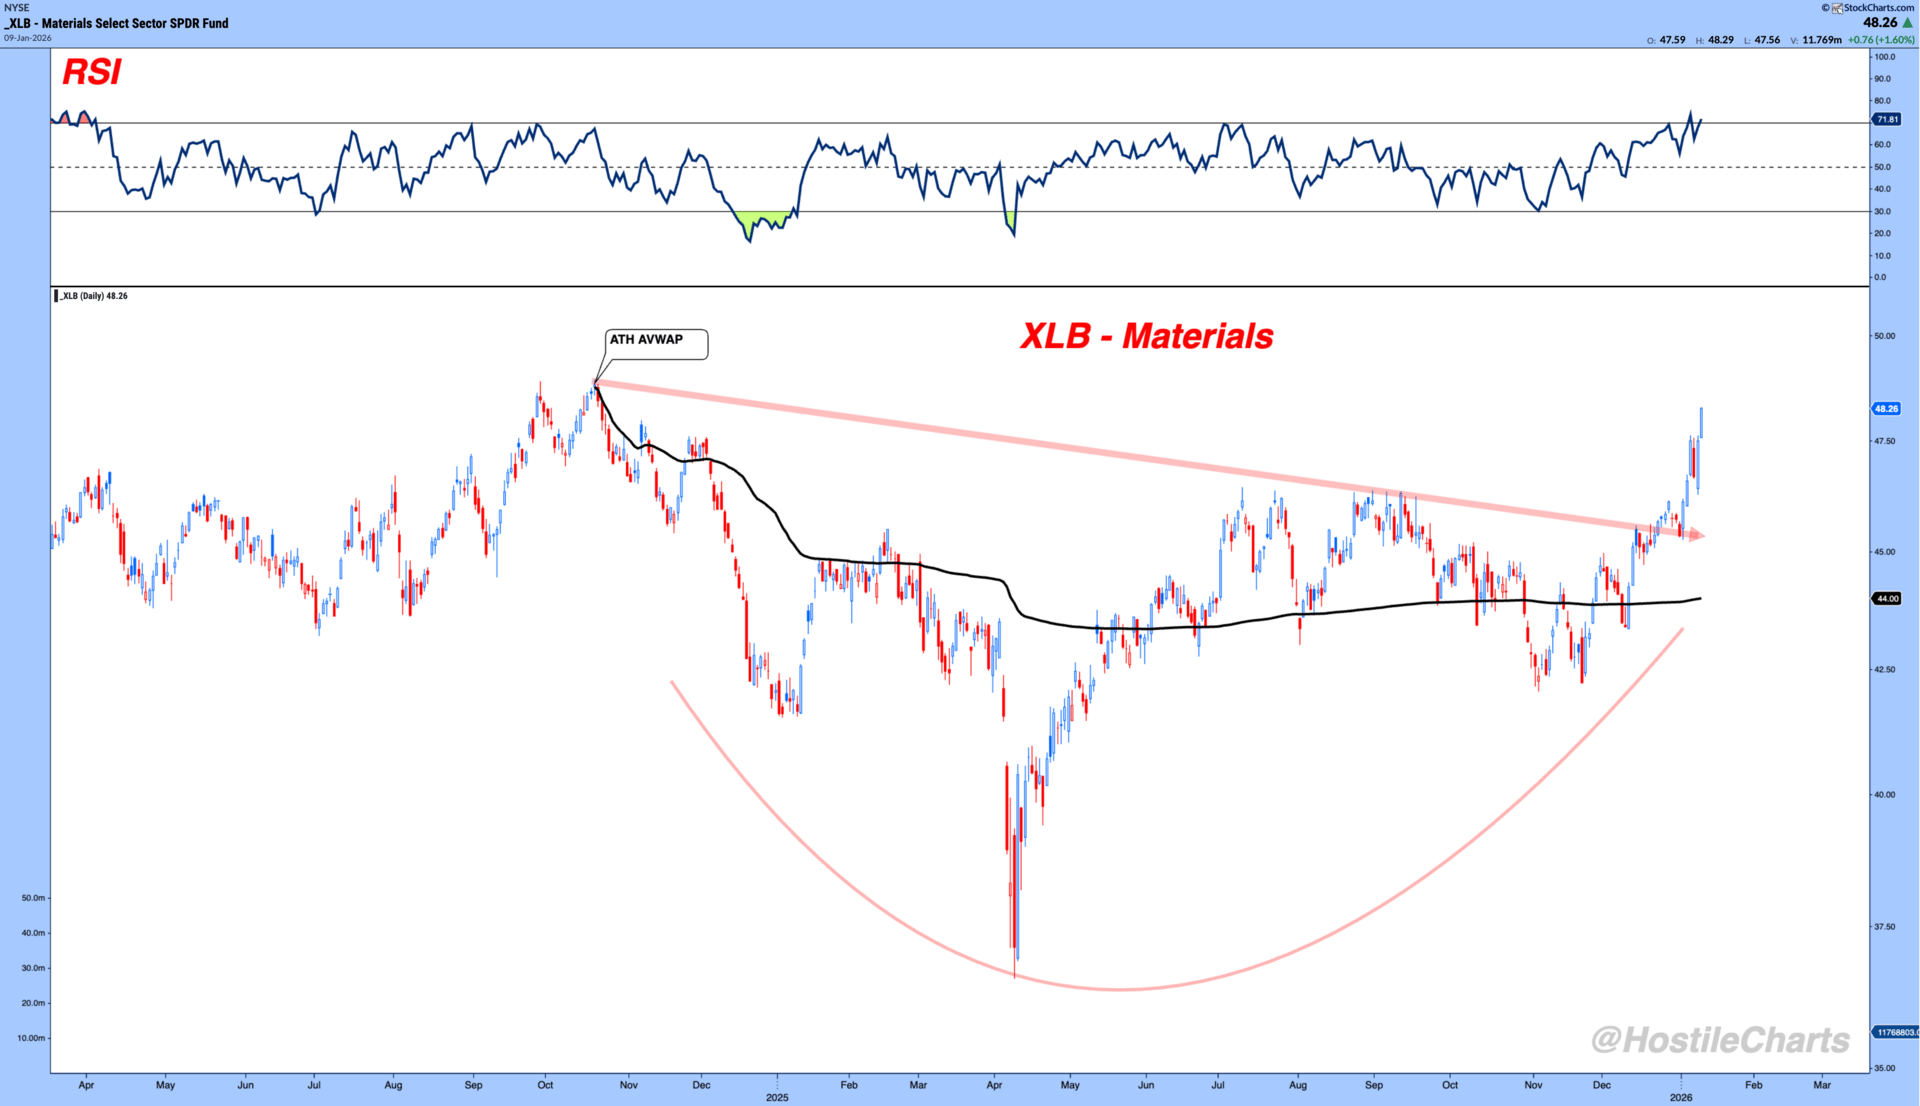
-
MLM is a clean base breakout look on the weekly context without feeling like some parabolic, exhausted momentum move.
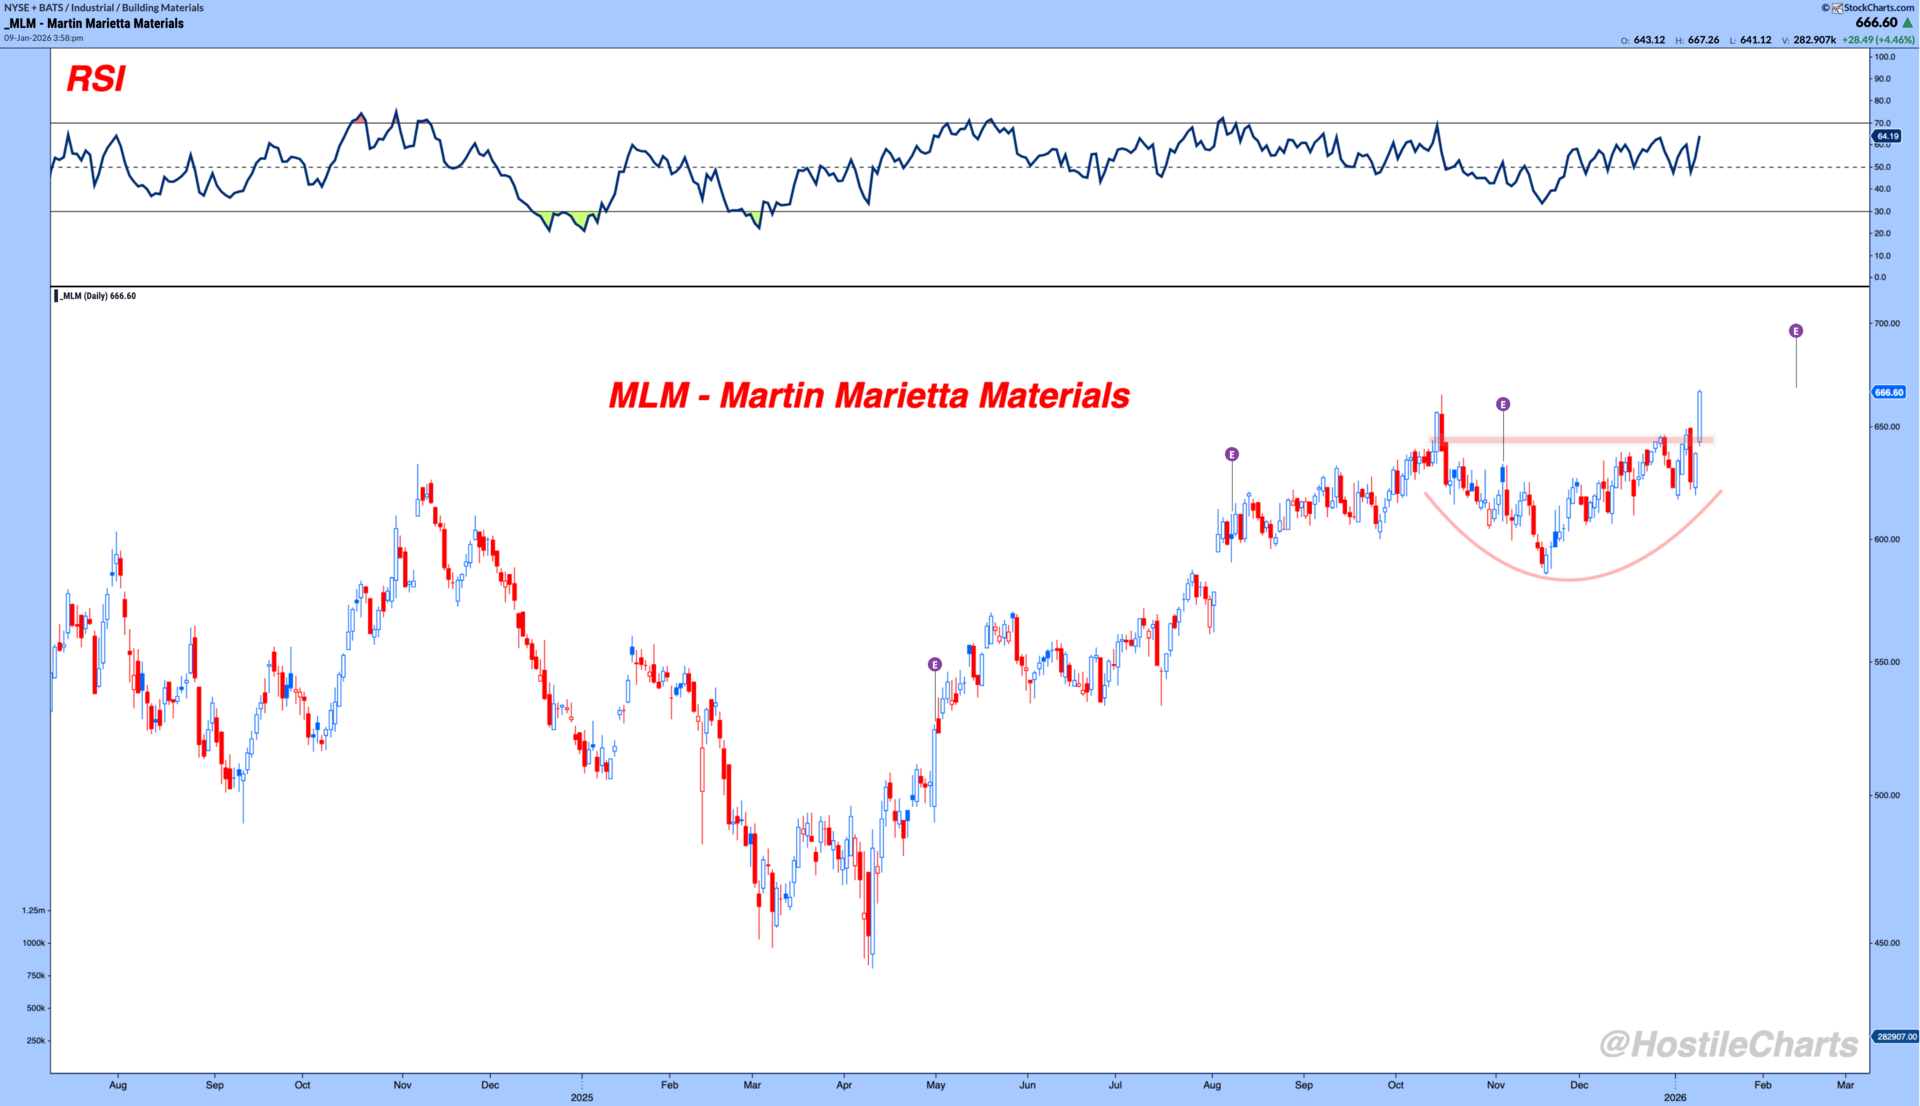
-
VMC is similar, a consolidation resolving higher, with the kind of structure that allows you to define risk against an obvious level.

This is also where your line-drawing point matters.
The line is not an academic exercise. The line is where you would manage risk.
Round numbers and obvious consolidation shelves matter because they are where the market has already shown its hand.
4) INFL, inflation beneficiaries without the inflation narrative
This is one of the more useful “theme without the theme” charts.
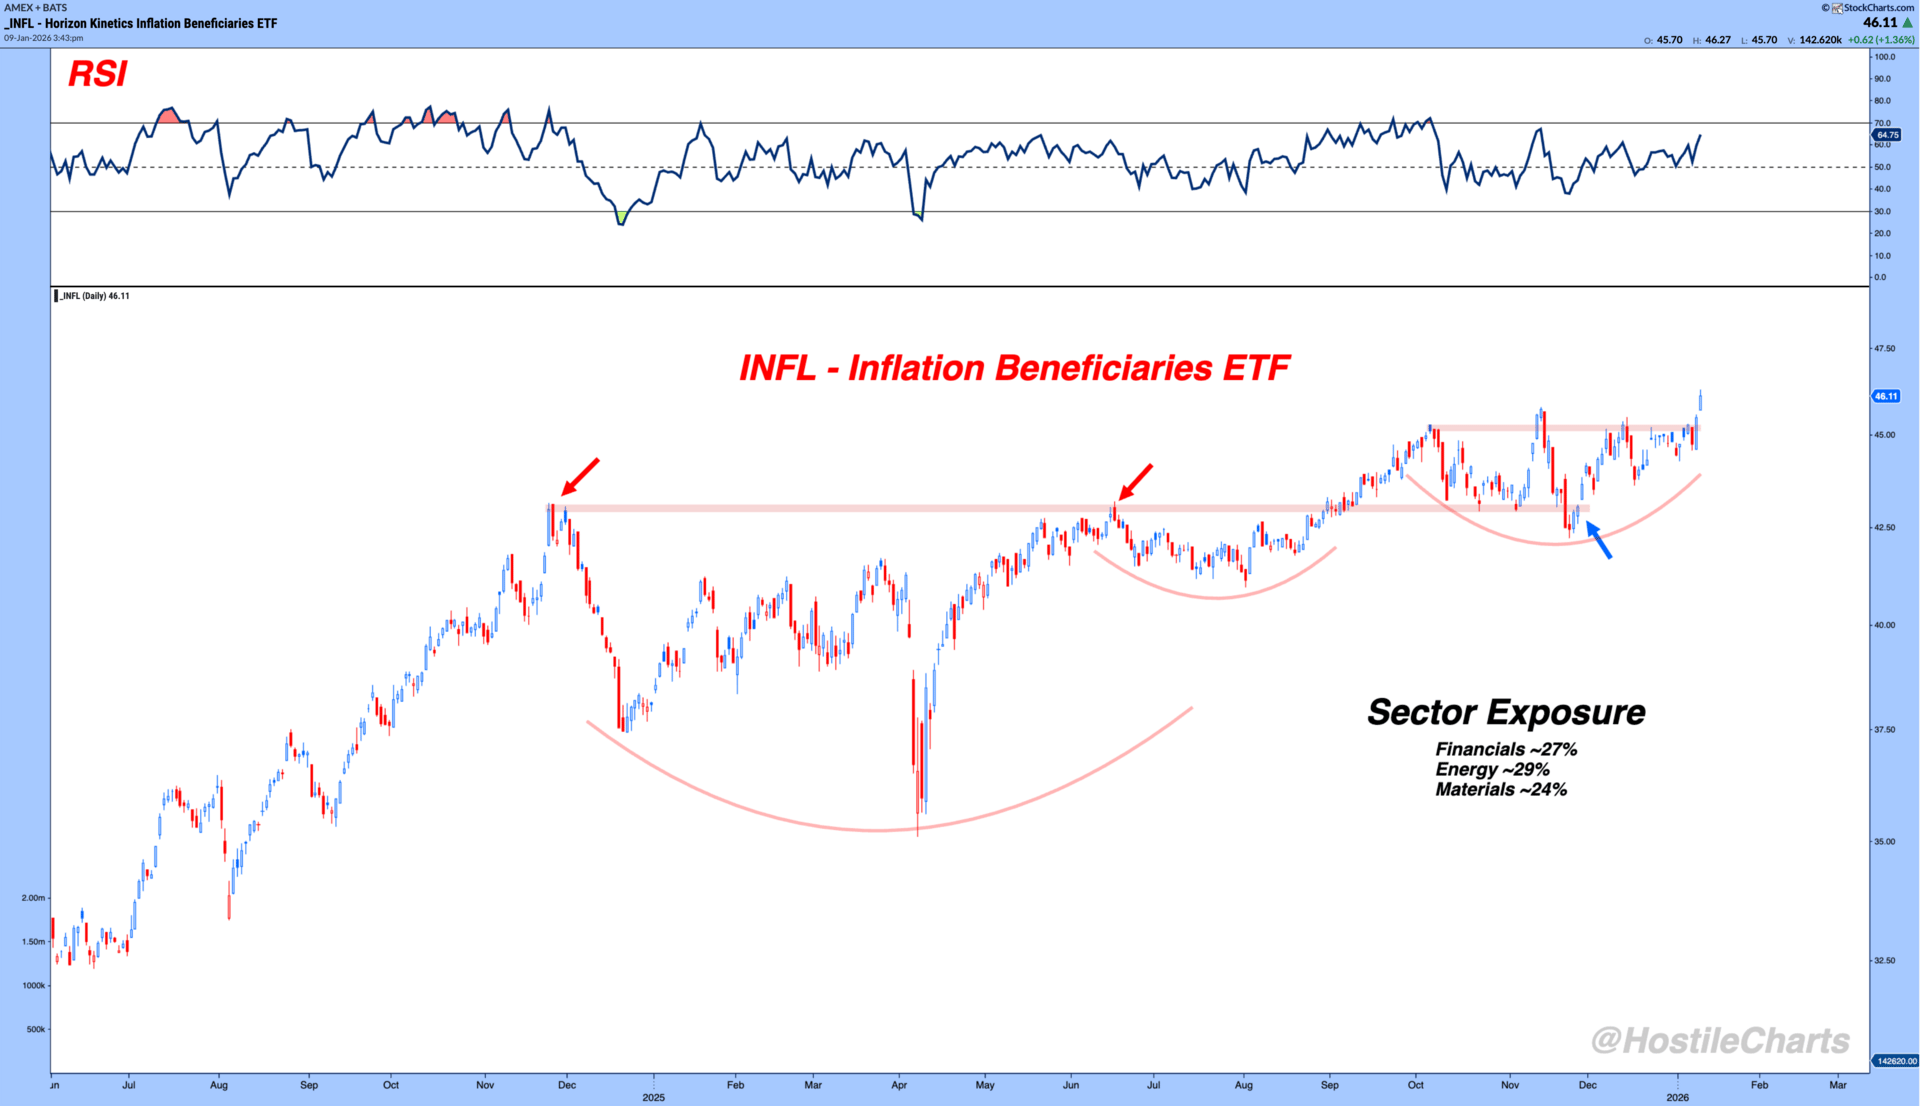
-
INFL has that base-on-base behavior, RSI holding above 50, and a clear level where risk can be defined. This is not a hyperinflation call.
-
If we were entering a hyperinflation regime, you would expect to see it reflected more aggressively in bonds. Instead, bonds are chopping.
To me, this reads more like cyclical participation improving.
It is not about a story, it is about where capital is flowing.
5) Brokers, dealers, and exchanges, risk appetite signal

The IAI chart is a textbook example of a long consolidation resolving higher, sitting well above a rising 200-day.
This matters because it is a “tell” on the environment.
If market participants genuinely believed economic conditions and liquidity were about to deteriorate, you would not expect this group to be breaking out.
6) Housing and home construction, early trend change behavior
Housing is one of those areas that can quietly confirm a lot of other cyclical action.

The lens you used is the right one. In a bottoming process:
-
Step one is downtrend to no trend.
-
You see that through the 200-day moving average slope shifting from negative to neutral.
-
Then you get the battle at the 200-day, back and forth, and eventually a resolution attempt.
On the ITB and XHB relationship chart, that is exactly what it looks like.
It may be a little extended short-term depending on timeframe, but zooming out, it reads like a “just getting started” transition, not a late-stage blow off.
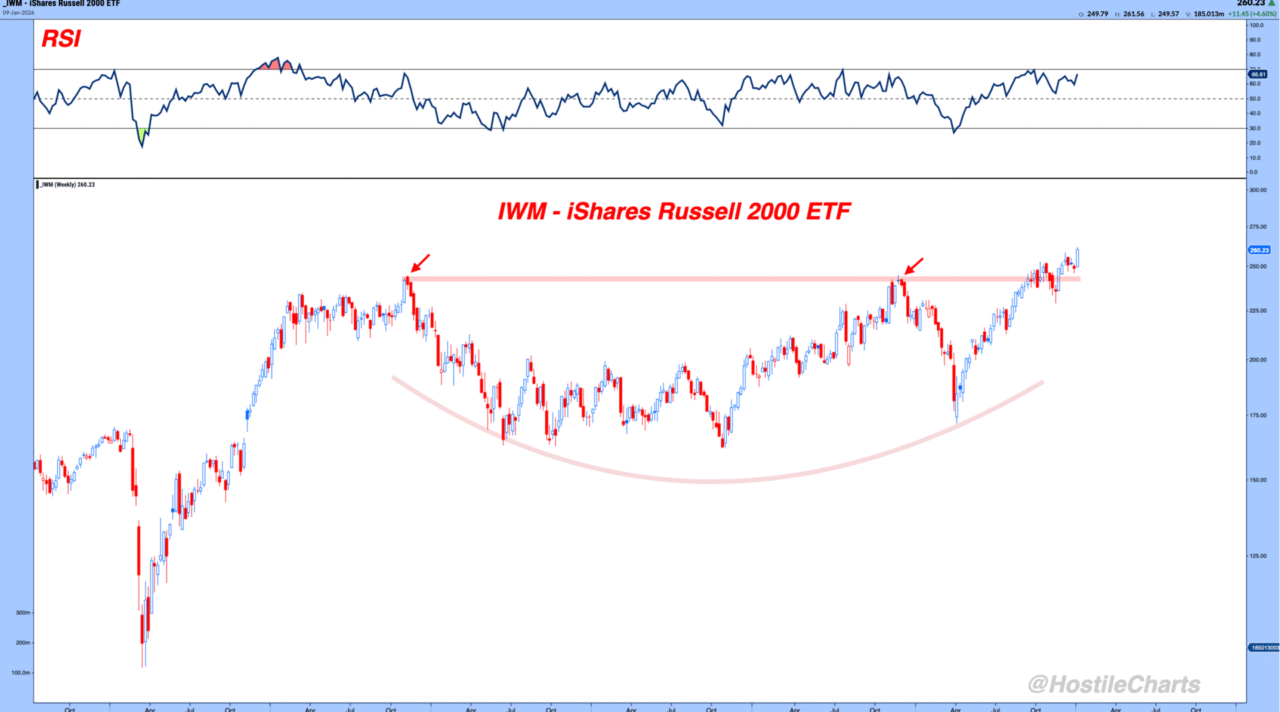
7) Small caps, opportunity set without overstating the case

This breakout speaks for itself.
My Two Cents
Most investors already own the starters. That is the default in a tech-dominated market.
The opportunity right now is that the benchwarmers are warming up, and in several areas, they are already stepping onto the field.
If you want alpha without chasing narratives, keep it simple.
Follow trend. Watch participation. Let price lead.
Then manage risk like an adult.
Anyway, that’s my two cents.
My Weekly Show – Thompson’s Two Cents
🚀 Throw it on 1.5x speed and let it rip.
👍 Give it a like. It’s the easiest way to show me some love.
The Sunday Stalk List | Ep. 25
If you want clean charts, clear setups, and tactical insights — this one’s for you.
It hits inboxes every Sunday so you know exactly what to keep an eye on for the week ahead.
Cheers,
Larry Thompson, CMT CPA
Sign Up For Thompson’s Two Cents

