The Breadth Nuance
Let’s talk about Breadth
There’s a lot of confusion right now around whether breadth is confirming this rally.
Honestly? That’s a good thing.
Confusion means the crowd isn’t aligned yet and when they finally come around… those of us who did the work get paid.
That’s the game.
Like any field of study, there are people who do it to pay the bills and people who do it because they love it.
Passion shows up in the details.
Passion wakes up at 6 a.m. on a Saturday to pore over sector-level breadth charts and separate signal from noise.
Let’s get into it.
The Surface View: “Breadth Isn’t Confirming”
If you’ve been following the usual market commentary, you’ve probably seen this one:
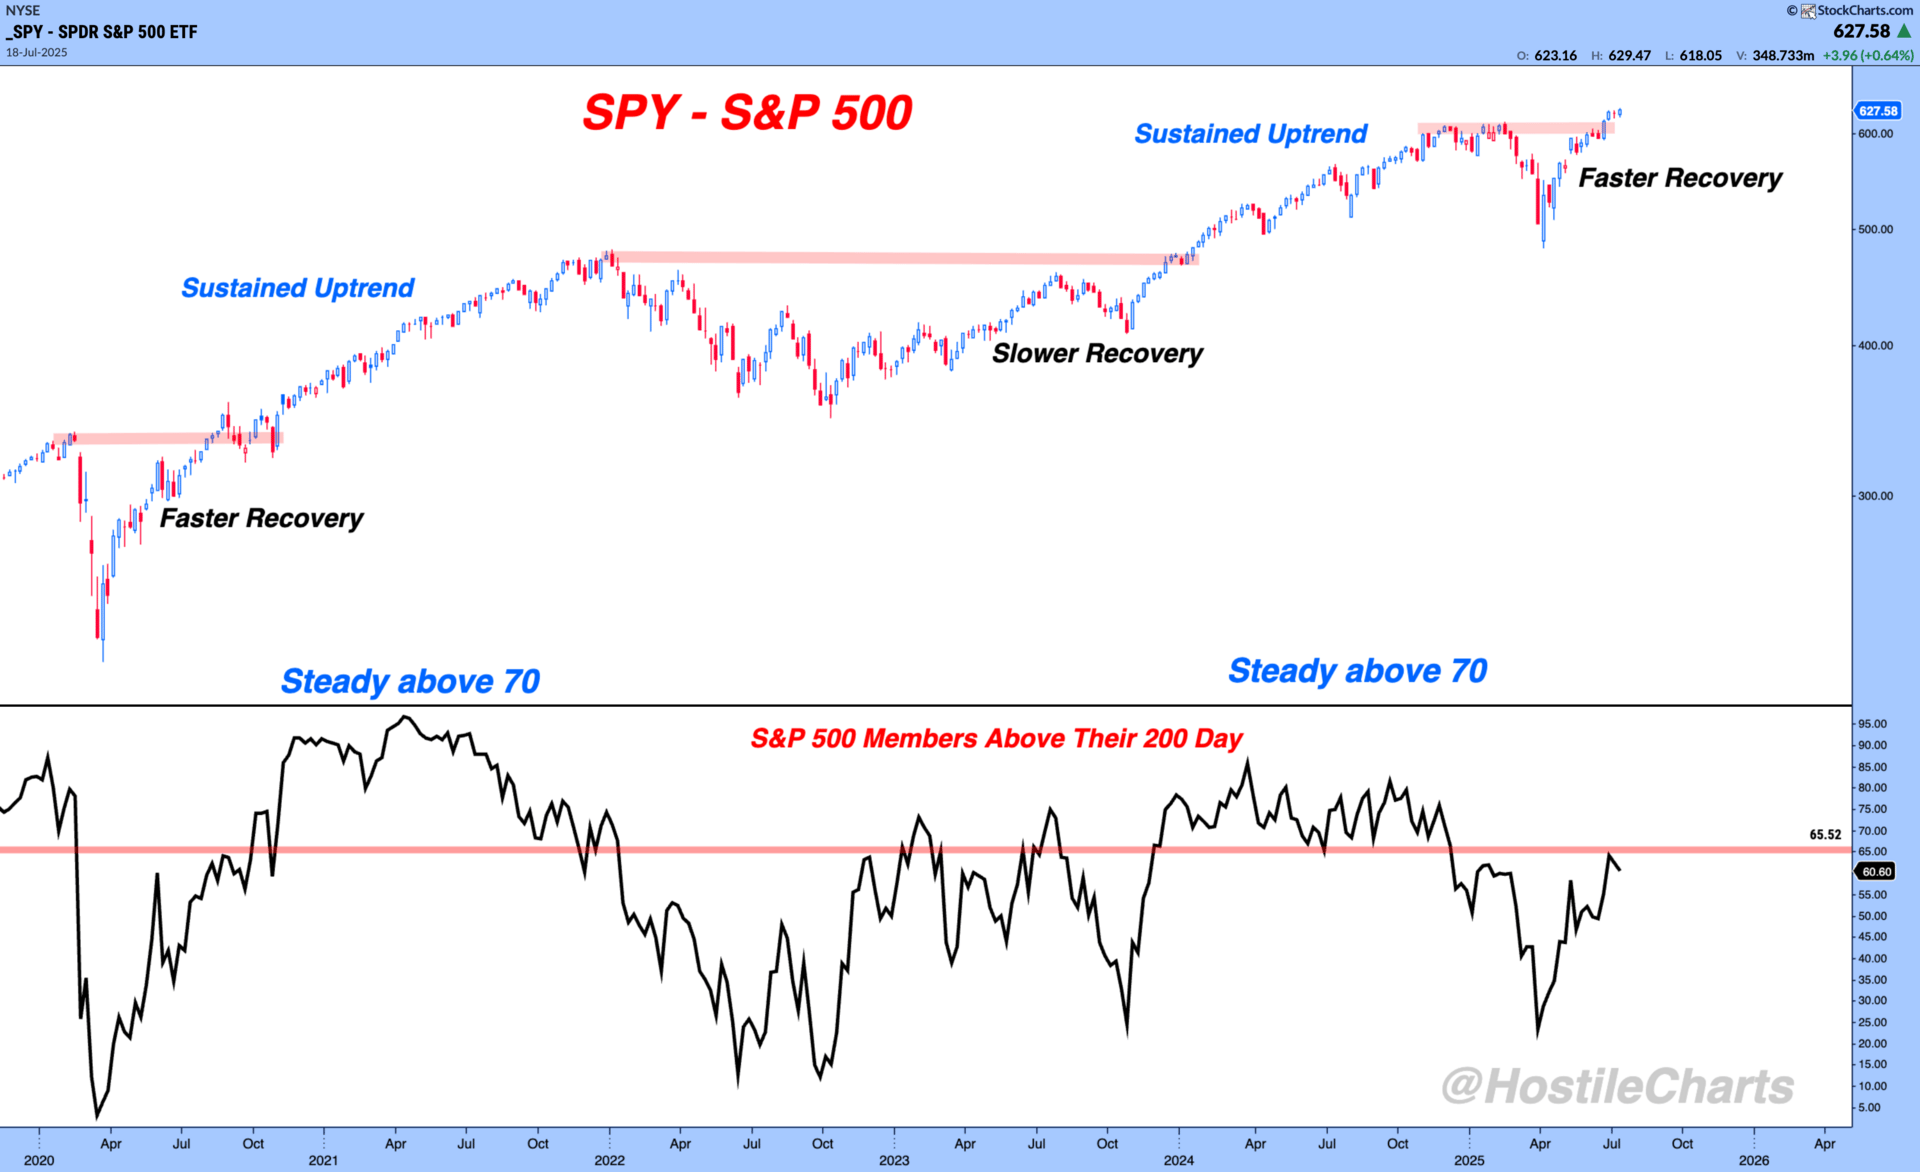
“The percentage of S&P 500 stocks above their 200-day moving average hasn’t cleared 70%, so breadth isn’t confirming.”
– Breadth Gurus Online

It’s true that 70% has been a meaningful threshold in past recoveries.
We saw this in 2020, 2021, and 2023. Each time, crossing above 70% coincided with a sustained uptrend.
But let’s be clear: 70% isn’t a magic number.
There’s nothing special about that exact level. It’s not a secret unlock code. In market analysis, we want robust tools built on logic not rigid thresholds divorced from context.
Models should guide interpretation, not dictate blind adherence. When you treat a model like law, you stop thinking and in markets, that’s when the damage happens.
What matters isn’t the precision of the level. It’s the concept of broad participation.
The logic is simple: strong, healthy markets tend to be driven by more than just a handful of names. When 70% or more of the index is trending above its long-term average, it shows strength is spread across the field.
That’s what we’re after. Not perfection but broad participation.
So even if we’re sitting at 60% like we are now, it doesn’t automatically disqualify the rally.
It just means we need to dig deeper and understand where that strength is or isn’t showing up.
Sector-Level Breadth Tells a Different Story
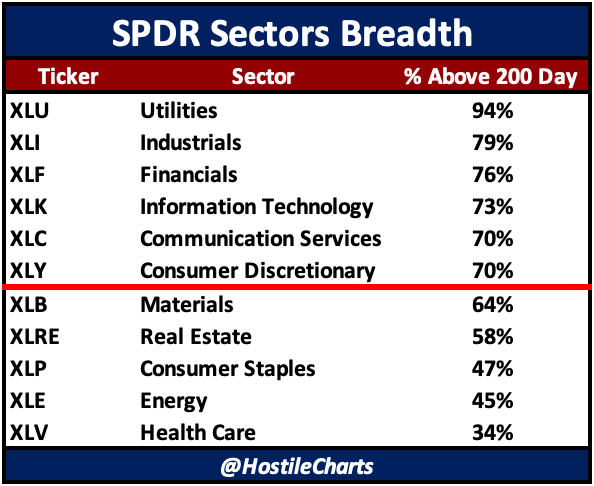
The S&P 500 isn’t one thing. It’s 11 sectors, each with its own structure and sensitivity to the economic cycle. And when we break down % of stocks above their 200-day moving averages by sector, we get a clearer picture of the puzzle.

The Leaders
-
Industrials $XLI ( ▼ 0.22% ) : 79% – Classic cyclical leadership. Healthy participation.
-
Financials $XLF ( ▲ 0.06% ) : 76% – Impressive strength from a cyclical sector.
-
Technology $XLK ( ▼ 0.07% ) : 73% – Still participating broadly, not just mega caps.
-
Communication Services $XLC ( ▼ 0.46% ) : 70% – Holding firm.
-
Consumer Discretionary $XLY ( ▲ 0.89% ) : 70% – Another risk-on sector confirming.
That’s a strong core of offensive leadership – the kind of participation you expect in a Bull Market.
And then there’s Utilities $XLU ( ▲ 1.68% ) at 94%. On paper, that’s a defensive sector, but context matters. Utilities are now tied to AI infrastructure demand and power buildouts, not just yield-chasing. So it may be acting more cyclical than it looks.
The Laggards
-
Materials $XLB ( ▲ 0.23% ) : 64% – Middle of the road, but not dragging.
-
Real Estate $XLRE ( ▲ 0.29% ) : 58% – Sensitive to rates, not surprising here.
-
Consumer Staples $XLP ( ▼ 0.27% ) : 47% – Weak participation, typical in risk-on tapes.
-
Energy $XLE ( ▼ 0.81% ) : 45% – Still digesting macro and commodity shifts.
-
Health Care $XLV ( ▼ 0.66% ) : 34% – Clearly risk-off positioning.
This is where the weakness in index-level breadth is coming from, not from the sectors that drive bull markets, but from the ones that typically hold up during corrections.
What This Tells Us
On the surface, people may say breadth isn’t confirming. But if you get your hands dirty and look underneath, you see that offense is on the field.
-
The index-level breadth is being pulled down by sectors you want to lag in a strong tape.
-
Cyclical leadership is thriving, with broad strength above the 200-day in the sectors that matter most for risk-on rallies.
-
This is the kind of leadership we should expect as the market transitions from recovery to uptrend.
I remain bullish here. The data supports the idea that a sustained uptrend is not only possible. It’s already taking shape.
Don’t let one data point define your entire view.
Don’t be afraid of nuance.
Context isn’t a complication, it’s a competitive advantage.
Hope y’all see that.
My Weekly Show – Thompsons Two Cents
🎥 Check out the latest episode of Thompson Two Cents Live!
I go live every Friday at 5 PM EST.
Breaking down some key market themes heading into the weekend.
This week, I break down:
-
The strong bid we’ve seen in speculative stocks.
-
Highlight a few setups I like.
-
Walk through one sector I’m avoiding..fow now.
🚀 Throw it on 1.5x speed and let it rip.
👍 Give it a like. It’s the easiest way to show me some support.
💬 Drop a comment or question – I always take the time to respond.
Cheers,
Larry Thompson, CMT CPA


