
The Death Cross: Statistically Meaningless, Emotionally Devastating 💗

TECHNICAL ANALYSIS
Special Cryptowits Newsletter Today 🥳

The death cross gets headlines every single time. Bitcoin’s 50-day moving average crosses below the 200-day and suddenly everyone’s a bear.
I pulled every Bitcoin death cross since 2011. All 13 of them. The data tells a different story than the doom merchants want you to believe.
TL;DR: Half of them were fake-outs. The average 1-year return after a death cross is +88%. And there are two rules – one technical, one on-chain – that tell you which type you’re dealing with. Both have 100%* historical accuracy.
TECHNICAL ANALYSIS
All The Death Crosses ☠️
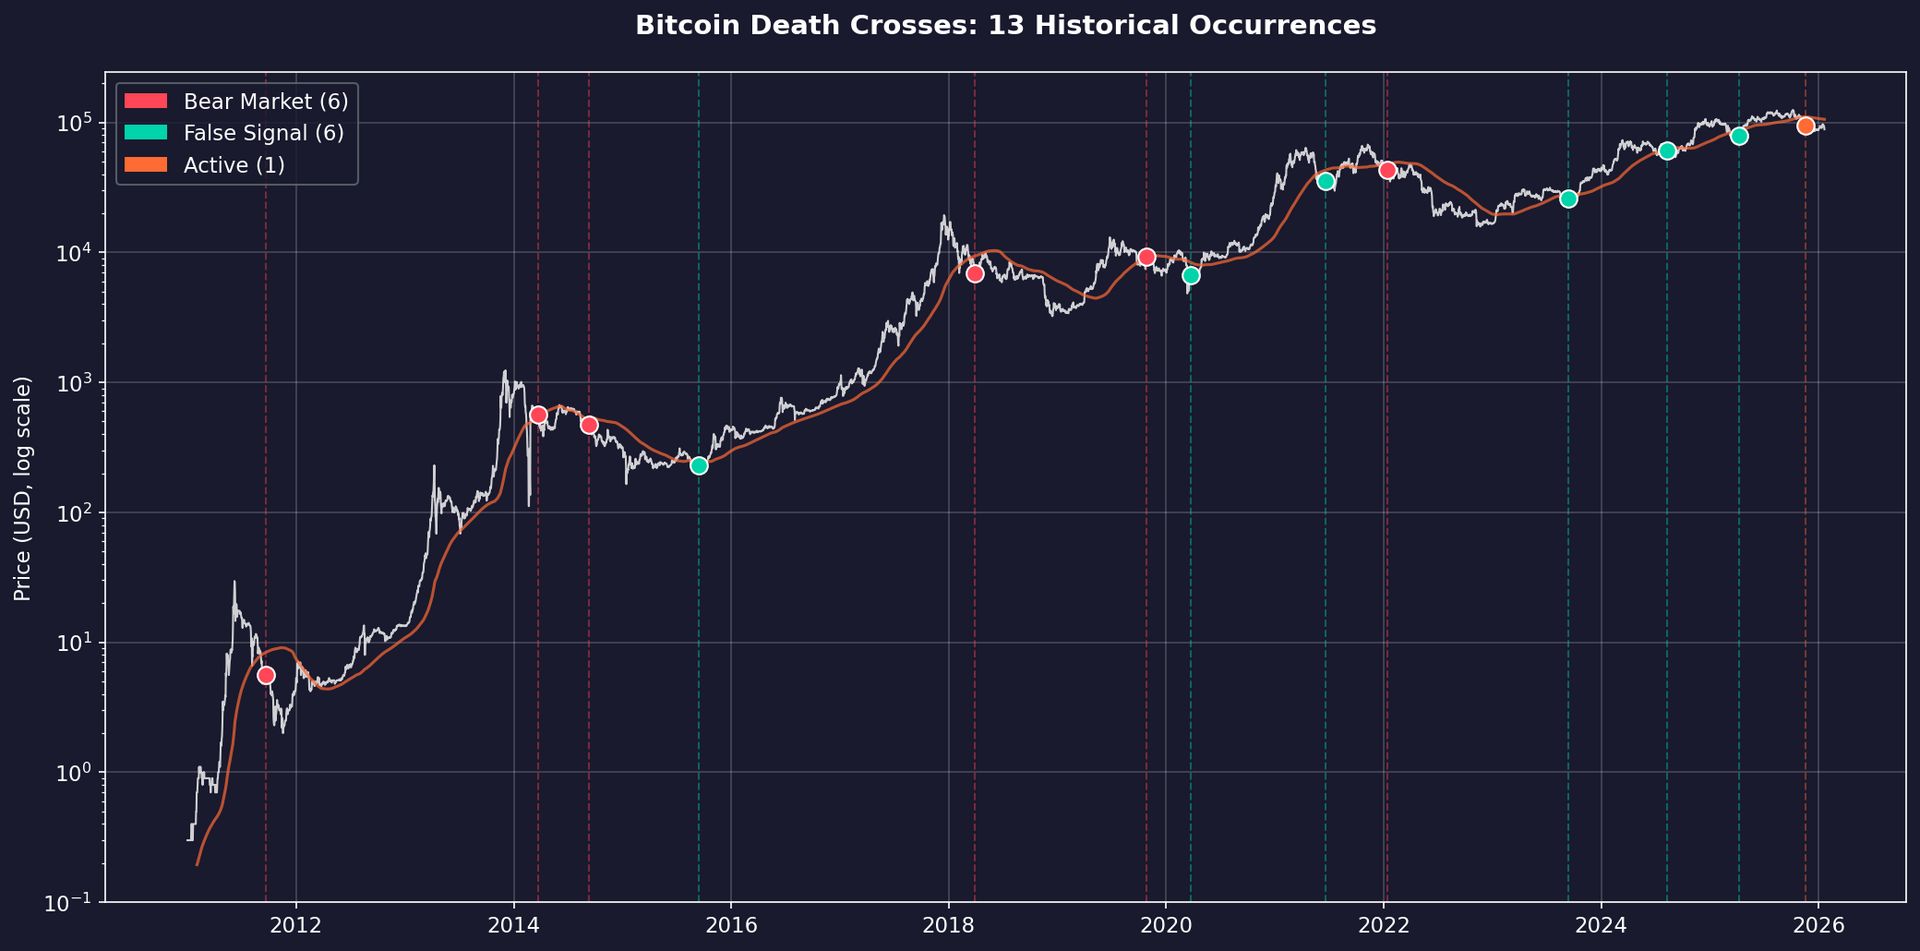
The death cross is when the 50-day simple moving average crosses below the 200-day SMA. It’s supposed to signal a shift from bullish to bearish market structure. 🤔
Click to enlarge.
Here’s every one that’s ever happened:
-
Sep 21, 2011: $5.60. Max drawdown -64%. Resolved in 141 days. 1-year return +120%. Bear.
-
Mar 24, 2014: $568. Max drawdown -37%. Resolved in 109 days. 1-year return -57%. Bear.
-
Sep 9, 2014: $475. Max drawdown -67%. Resolved in 308 days. 1-year return -50%. Bear.
-
Sep 14, 2015: $230. Max drawdown -3%. Resolved in 44 days. 1-year return +165%. False signal.
-
Mar 30, 2018: $6,854. Max drawdown -54%. Resolved in 390 days. 1-year return -40%. Bear.
-
Oct 26, 2019: $9,231. Max drawdown -30%. Resolved in 115 days. 1-year return +41%. Bear.
-
Mar 25, 2020: $6,679. Max drawdown -12%. Resolved in 57 days. 1-year return +668%. False signal.
-
Jun 19, 2021: $35,513. Max drawdown -19%. Resolved in 88 days. 1-year return -42%. False signal.
-
Jan 14, 2022: $43,073. Max drawdown -64%. Resolved in 389 days. 1-year return -51%. Bear.
-
Sep 12, 2023: $25,835. Max drawdown -3%. Resolved in 48 days. 1-year return +122%. False signal.
-
Aug 10, 2024: $60,932. Max drawdown -14%. Resolved in 79 days. 1-year return +96%. False signal.
-
Apr 7, 2025: $79,163. Max drawdown -6%. Resolved in 45 days. False signal.
-
Nov 16, 2025: $94,260. Max drawdown -14% so far. Still active. TBD.
The Lagging Indicator Problem
The cross basically confirms what price had already shown. It didn’t predict anything.
September 2011: Price was 33% below the 200 SMA at the cross. March 2018: Price was 27% below. March 2020: Price was 20% below.
The death cross is a rear-view mirror indicator. By the time it triggers – the damage is usually done. Usually. 🔴
TECHNICAL ANALYSIS
Death Crosses Are A Coin Flip 🪙
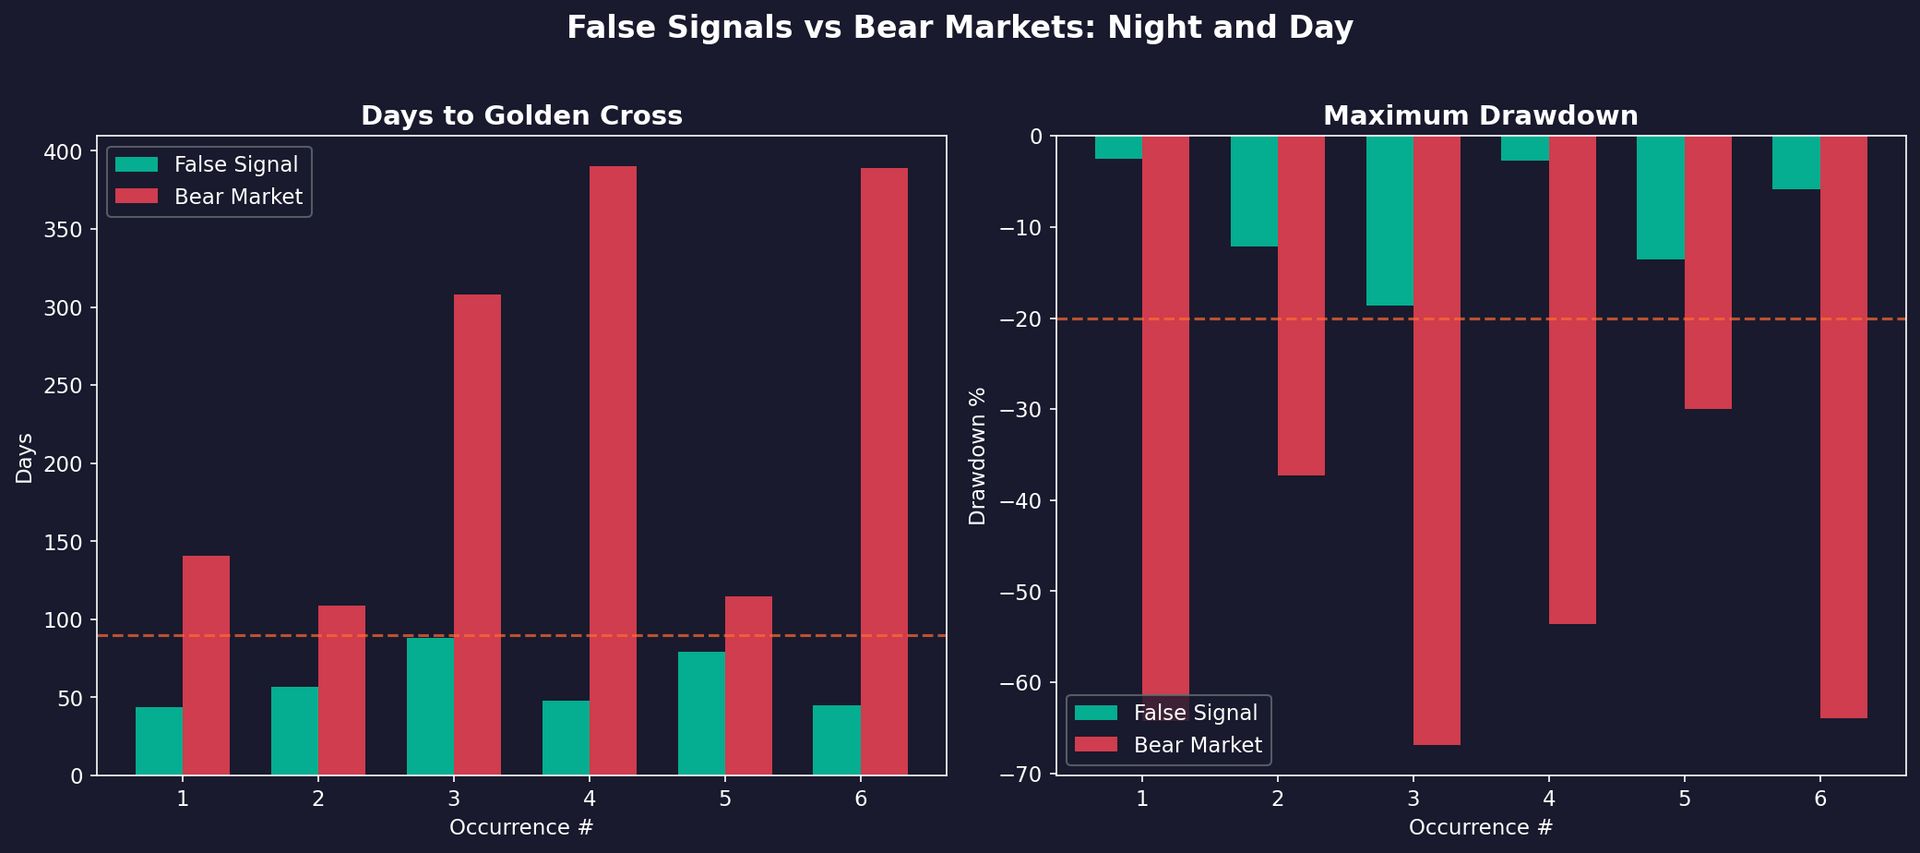
Of the 12 resolved death crosses – exactly half were noise. 🤯
Click to enlarge.
False Signals (6)
Sep 2015, Mar 2020, Jun 2021, Sep 2023, Aug 2024, Apr 2025
-
Resolved in 44-88 days
-
Max drawdowns: -3% to -19%
-
Quick and painless-ish
Real Bears (6)
Sep 2011, Mar 2014, Sep 2014, Mar 2018, Oct 2019, Jan 2022
-
Took 109-390 days to resolve
-
Max drawdowns: -30% to -67%
-
Extended pain
50/50 split. The death cross alone tells you nothing about which scenario you’re in.
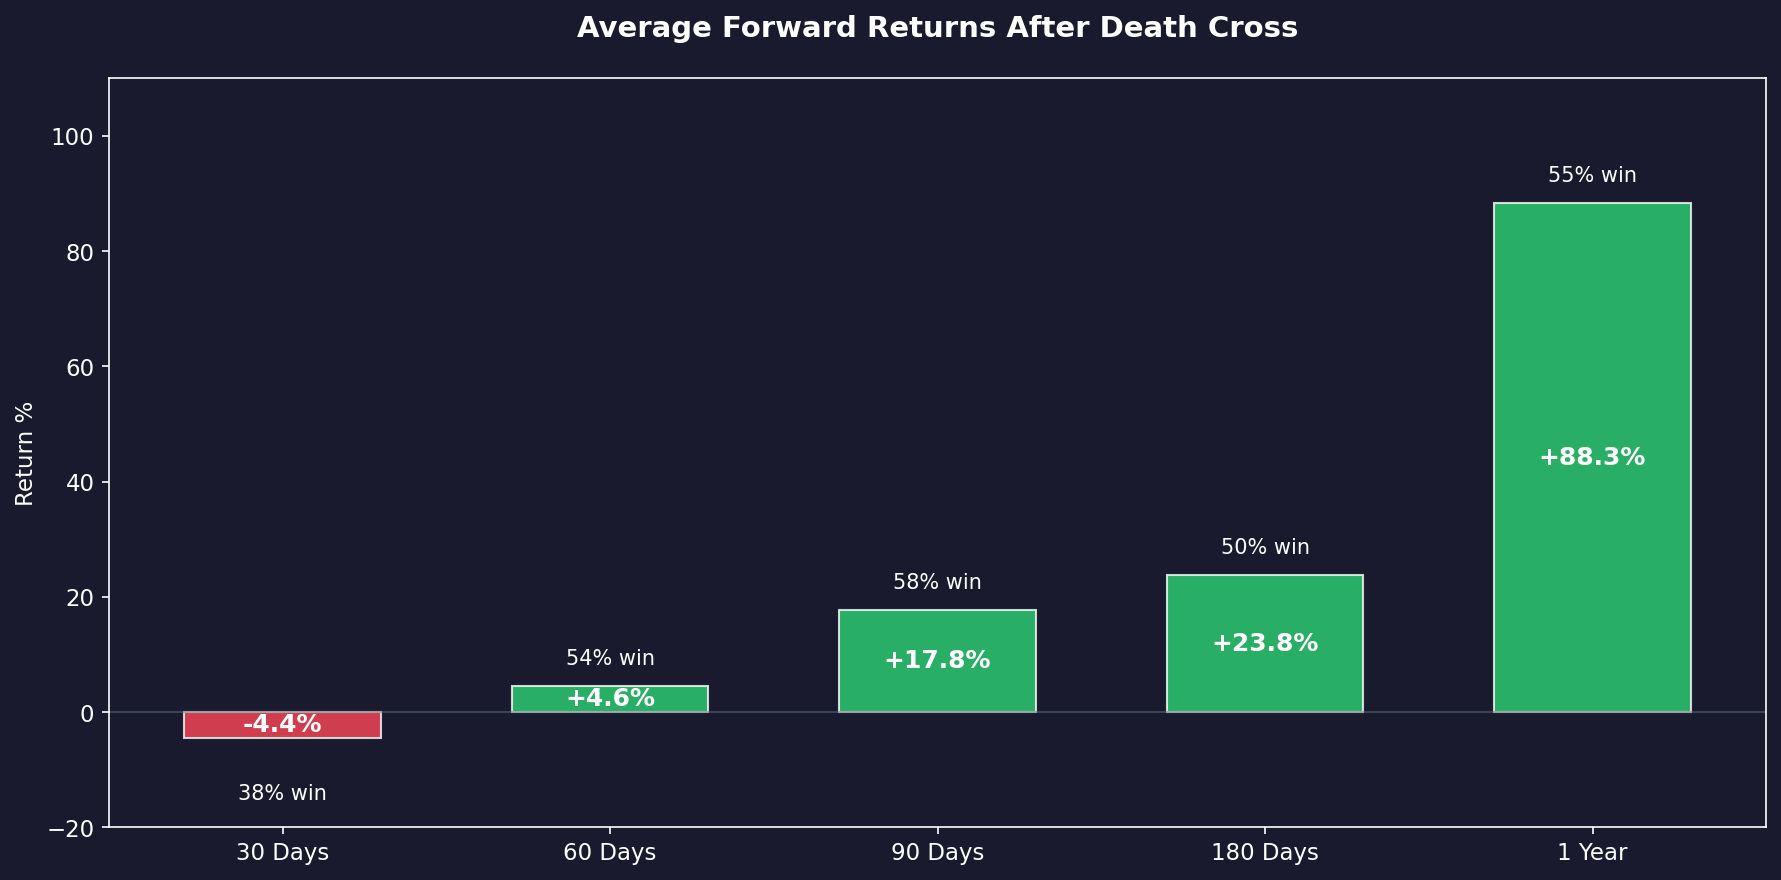
Forward Returns After A Death Cross
Click to enlarge.
-
30 days: -4% average (38% win rate)
-
90 days: +18% average (58% win rate)
-
1 year: +88% average (55% win rate)
A “bearish” signal with positive average returns. Make it make sense.
The One Thing That’s Always True*
Every single death cross price has eventually been exceeded. 100%* recovery rate. If you bought every death cross and held – you made money every time. The catch: you needed conviction to sit through drawdowns as deep as -67%. 😶
TECHNICAL ANALYSIS
Finding An Edge 🔪
Here’s where this gets useful. Two rules – one technical, one on-chain – that actually tell you what you’re dealing with. 👇️
The 90-Day Rule (Technical)
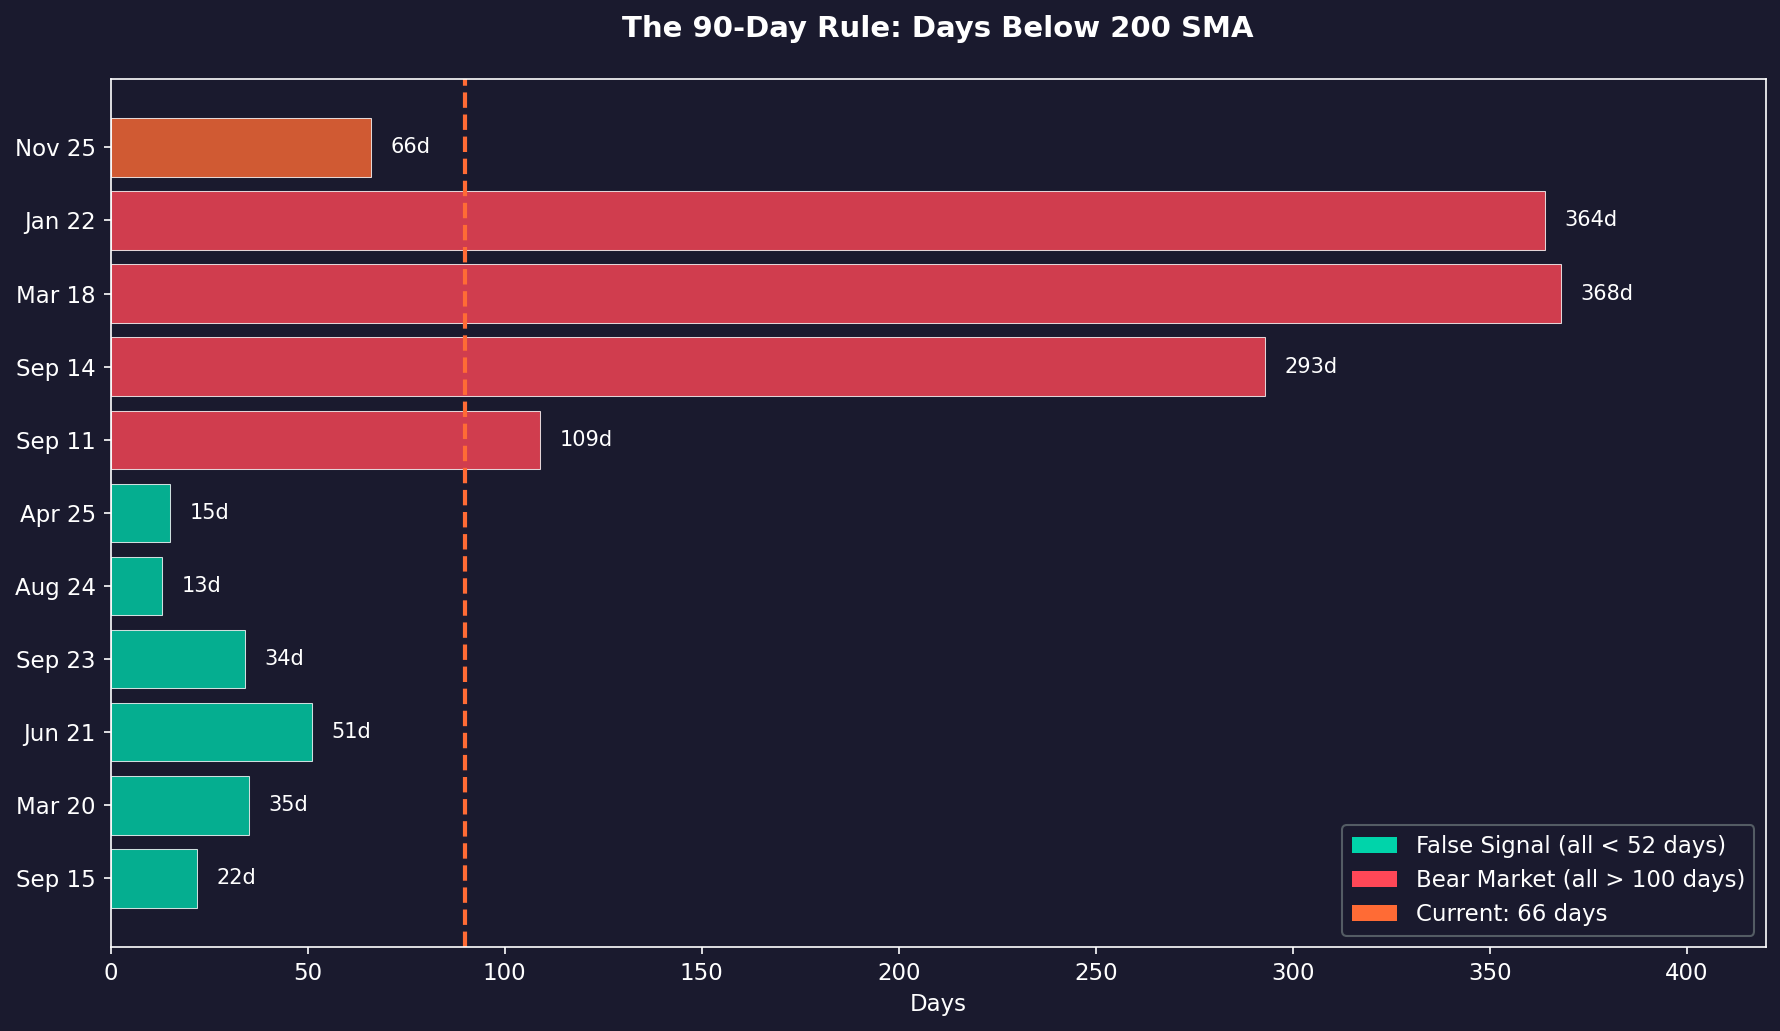
Track how long price stays below the 200 SMA after the death cross.
Click to enlarge.
False signals – days below 200 SMA:
-
Sep 2015: 22 days
-
Mar 2020: 35 days
-
Jun 2021: 51 days
-
Sep 2023: 34 days
-
Aug 2024: 13 days
-
Apr 2025: 15 days
All under 52 days.
Real bears – days below 200 SMA:
-
Sep 2011: 109 days
-
Sep 2014: 293 days
-
Mar 2018: 368 days
-
Jan 2022: 364 days
All over 100 days.
The rule: If price is still below the 200 SMA at day 90 – it’s a bear market, well, probably. If price reclaims the 200 SMA before day 90 – it’s a false signal.
Historical accuracy: 100%*.
Day 45 works as an early warning (86% accuracy). Day 90 is the verdict.
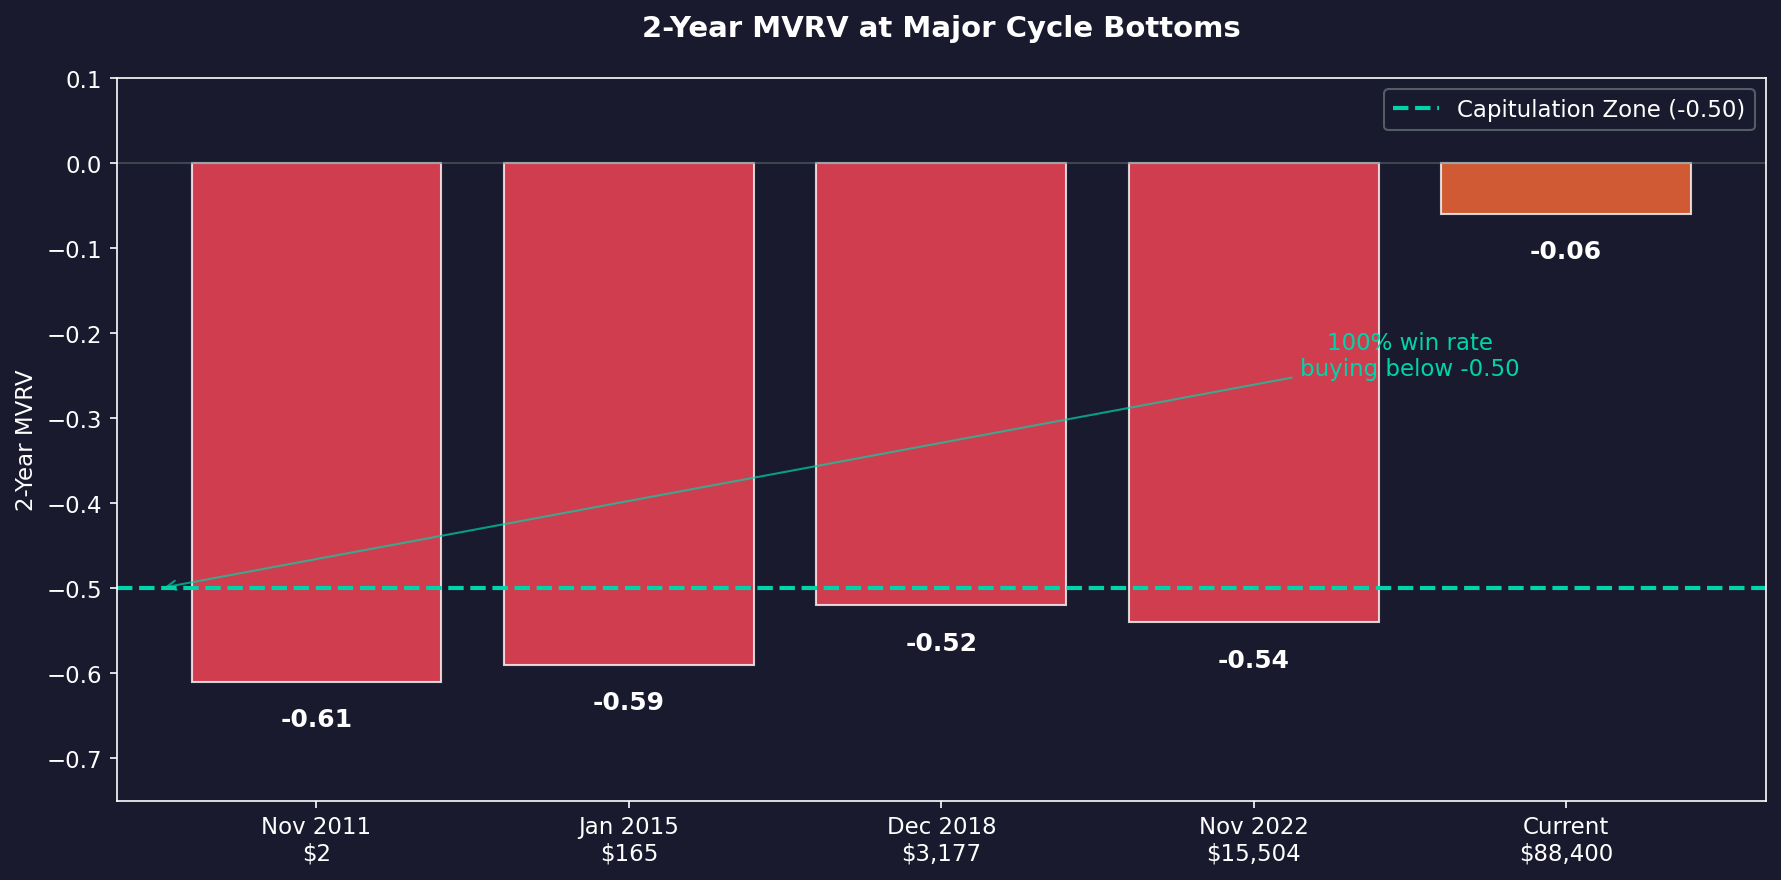
The -0.5 Rule (On-Chain)
The 2-year MVRV compares market cap to realized cap – measuring whether holders are in profit or loss vs their cost basis. When it goes deeply negative – capitulation.
Click to enlarge.
When 2-year MVRV drops below -0.5:
-
90-day forward return: +73% average
-
1-year forward return: +234% average
-
Win rate: 100%*
Every major cycle bottom hit this zone:
-
Nov 2011: 2y MVRV = -0.61 (bottom at $2)
-
Jan 2015: 2y MVRV = -0.59 (bottom at $165)
-
Dec 2018: 2y MVRV = -0.52 (bottom at $3,177)
-
Nov 2022: 2y MVRV = -0.54 (bottom at $15,504)
False signal bottoms – 2y MVRV stayed above -0.15:
-
Jun 2021: +0.02
-
Sep 2024: +0.14
-
Apr 2025: +0.08
Real bear bottoms – 2y MVRV dropped below -0.50:
-
Oct 2011: -0.64
-
Jan 2015: -0.59
-
Dec 2018: -0.52
-
Nov 2022: -0.54
The pattern is clean*. False signals don’t see capitulation. Real bears do.
How They Work Together
-
The 90-Day Rule tells you what kind of death cross you’re in – real bear or noise.
-
The -0.5 Rule tells you when to buy if it’s a real bear.
-
Use the first to identify. Use the second to time.
TECHNICAL ANALYSIS
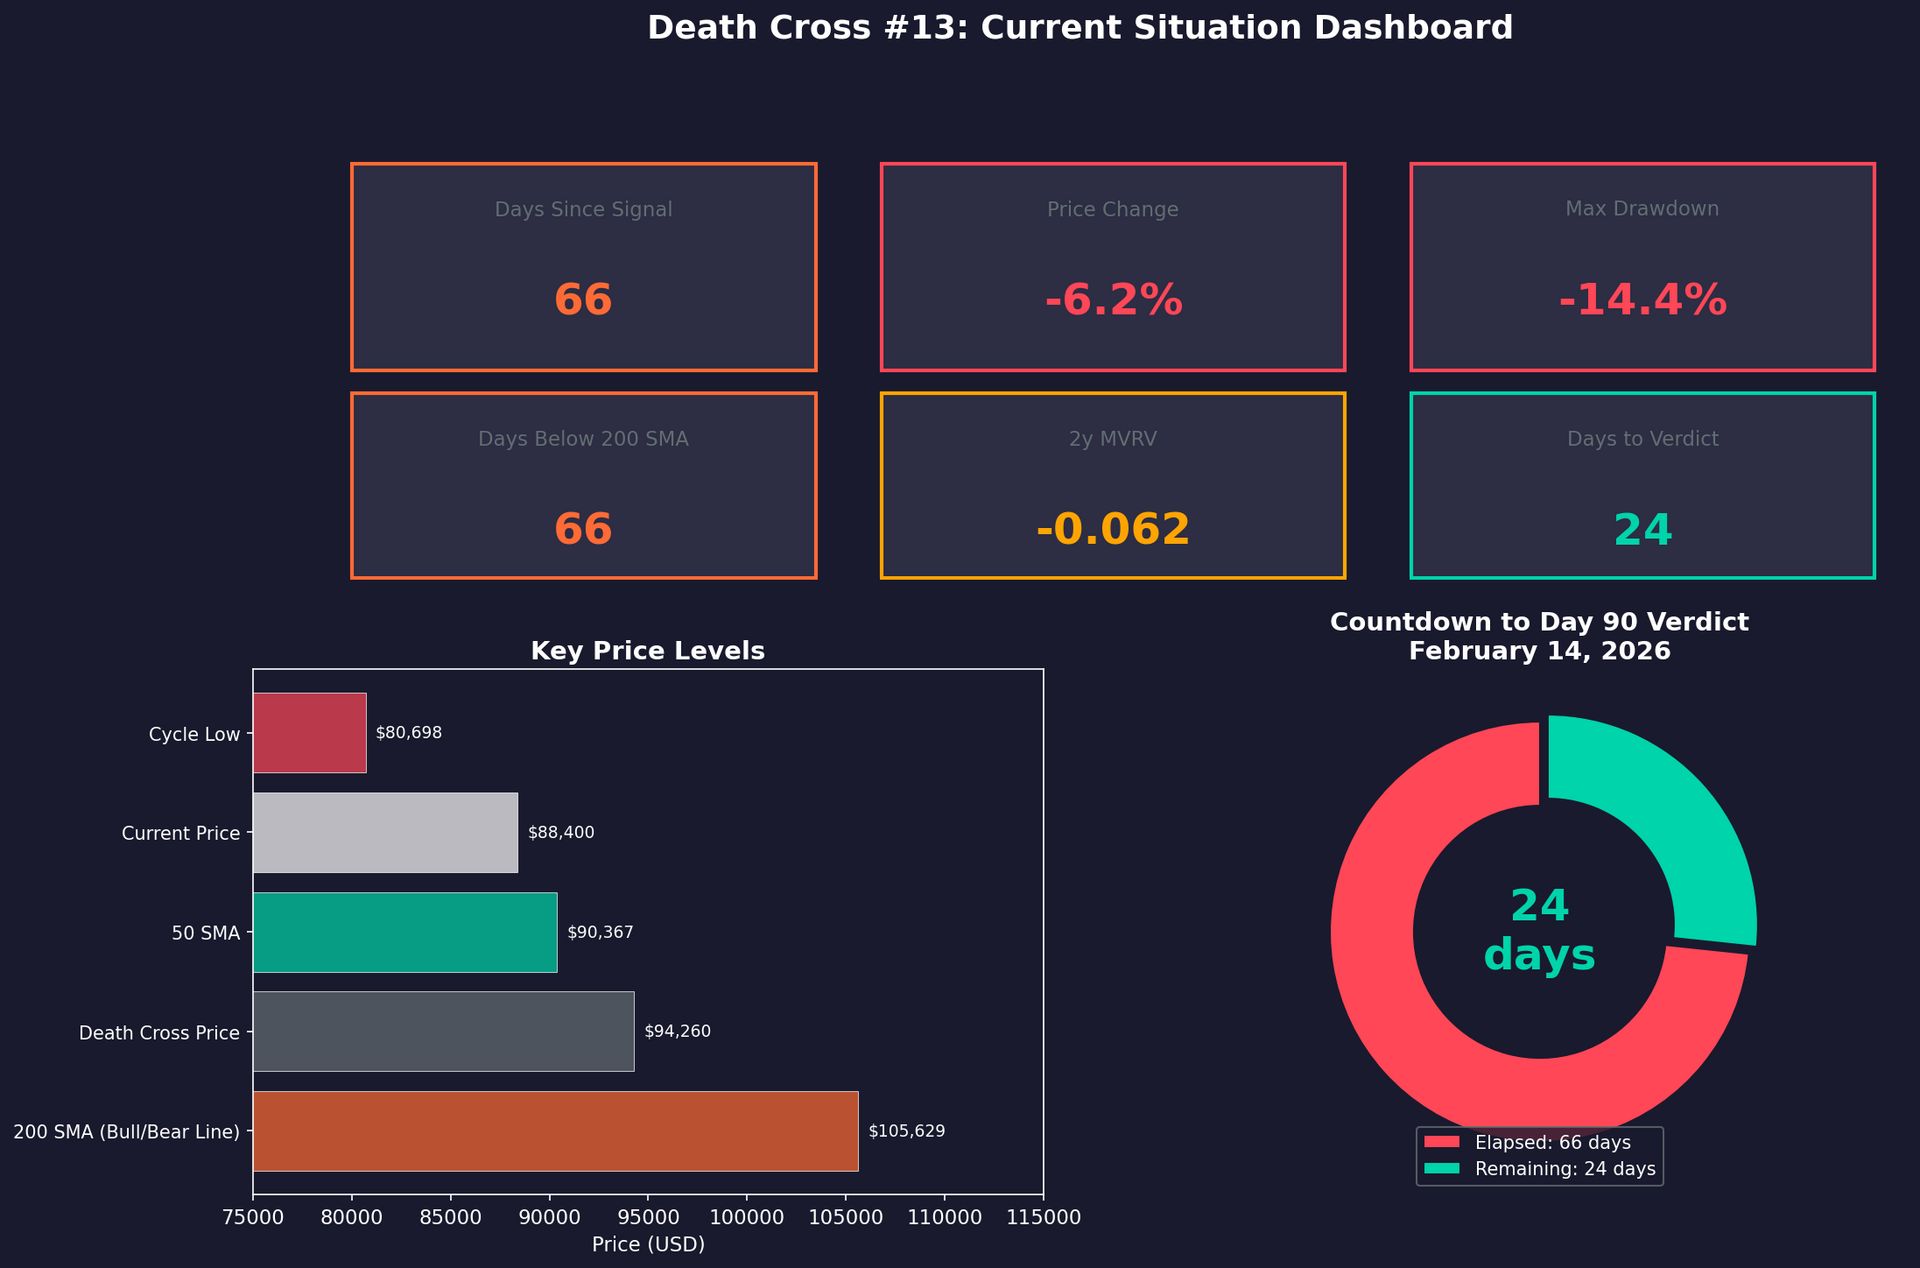
The Current Death Cross ⚠️
Bitcoin is currently in/on Death Cross number 13. An unlucky number. 😐️
Click to enalrge.
Current stats as of January 20, 2026:
-
Death cross date: November 16, 2025
-
Days since signal: 66
-
Price at signal: $94,260
-
Current price: $88,400 (-6%)
-
200 SMA: $105,629
-
50 SMA: $90,367
-
Cycle low so far: $80,698 (Nov 21)
-
Days below 200 SMA: 66
-
2-year MVRV: -0.062
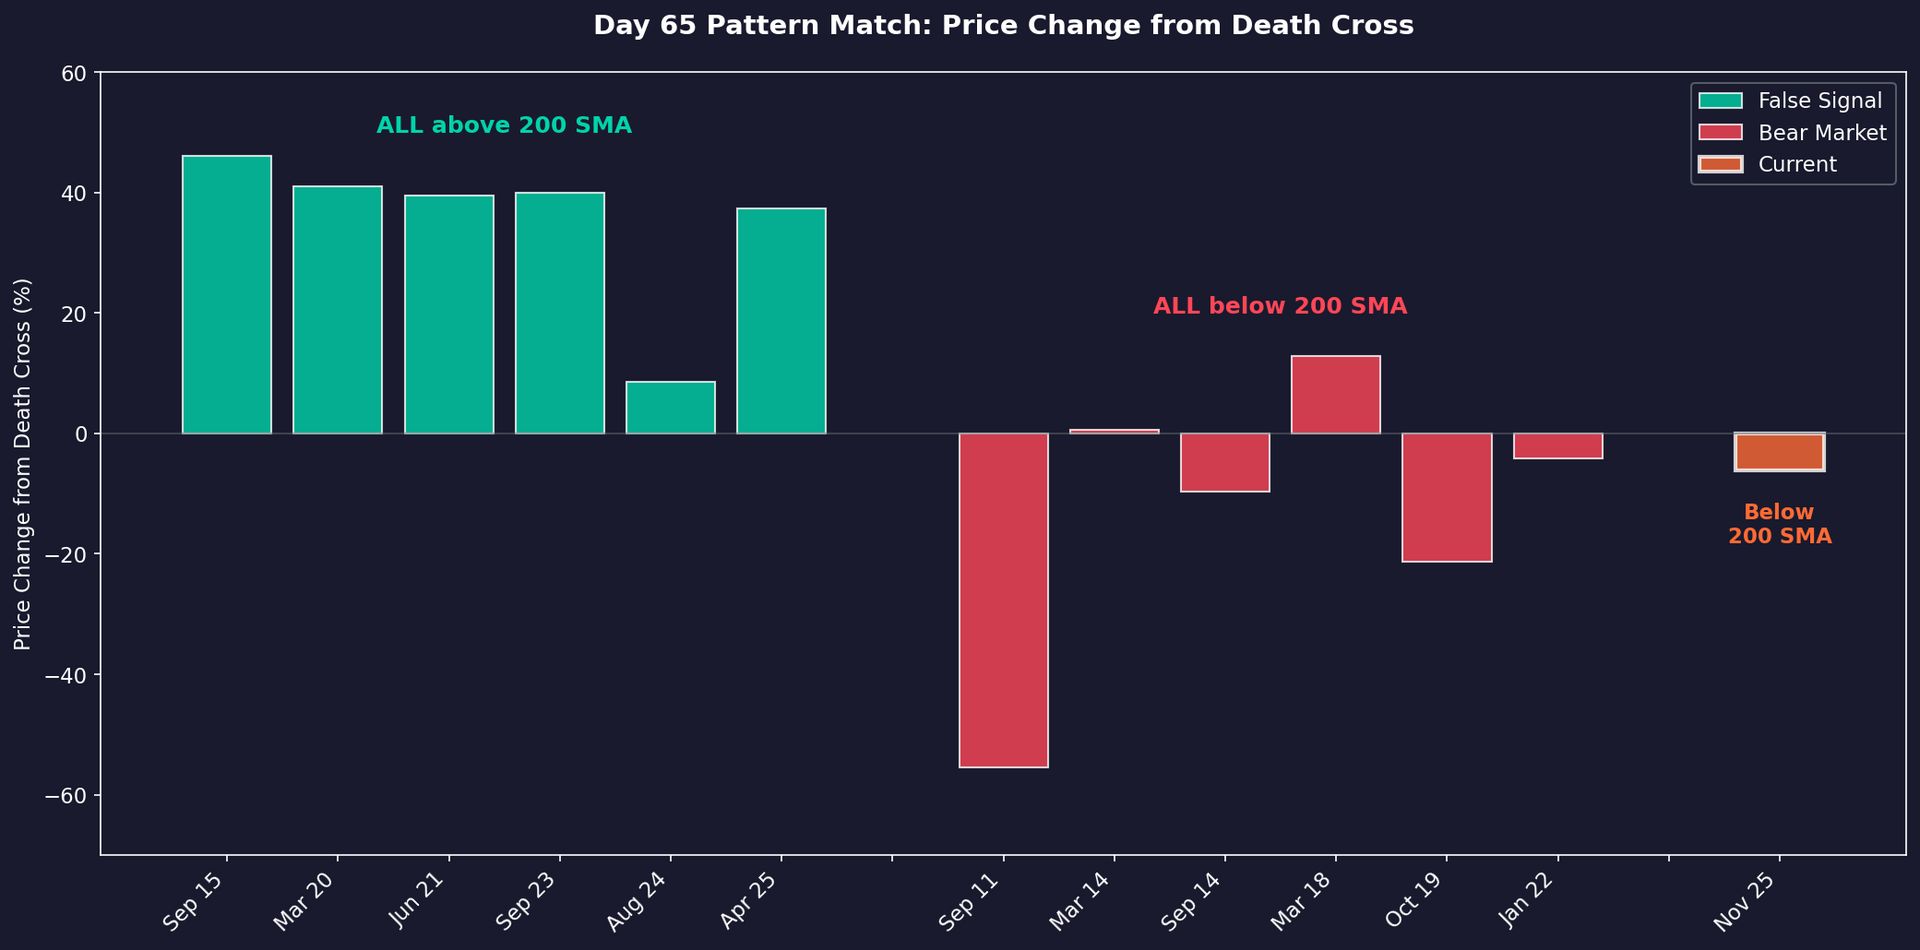
The Day 65 Pattern Match
At day 65 – every* historical death cross had already shown its hand.
Click to enlarge.
False signals at day 65: Price was ABOVE the 200 SMA in all six cases.
-
Sep 2015: +46% from DC price, above 200 SMA
-
Mar 2020: +41%, above 200 SMA
-
Jun 2021: +40%, above 200 SMA
-
Sep 2023: +40%, above 200 SMA
-
Aug 2024: +9%, above 200 SMA
-
Apr 2025: +37%, above 200 SMA
Bear markets at day 65: Price was BELOW the 200 SMA in all six cases.
-
Sep 2011: -55%, below 200 SMA
-
Mar 2014: +1%, below 200 SMA
-
Sep 2014: -10%, below 200 SMA
-
Mar 2018: +13%, below 200 SMA
-
Oct 2019: -21%, below 200 SMA
-
Jan 2022: -4%, below 200 SMA
Current (Nov 2025): -6%, below 200 SMA
Every false signal had reclaimed the 200 SMA by day 65. This one hasn’t.
That’s the single most important data point right now.
The Conflicting Signals
-
Bearish: 66 days below 200 SMA – matches bear market pattern
-
Neutral: 2y MVRV at -0.062 – far from capitulation
-
Unclear: Halving cycle (576 days post-halving) – historical window for post-euphoria corrections
The technical picture looks bearish. The on-chain picture is ambiguous. Either we’re near the bottom of a false signal – or we’re early innings of something worse. 😭
TECHNICAL ANALYSIS
So… What Happens Next? Three Scenarios🤔
Scenario 1: Late False Signal
-
Price rallies +19% and reclaims $105,629 before Feb 14
-
Would be unprecedented – no false signal has been this late
-
Requires a catalyst
-
Probability: Low
Scenario 2: Real Bear Market
-
Price stays below 200 SMA past day 90 (Feb 14)
-
2y MVRV eventually drops toward -0.50
-
Historical bear drawdowns from DC: -30% to -67%
-
Applied to current: $66K to $31K
-
Probability: Elevated given day 65 pattern
Scenario 3: Extended Chop
-
Price oscillates without resolution
-
Similar to Oct 2019 – 115 days to golden cross, -30% max drawdown, no MVRV capitulation
-
Frustrating for everyone
-
Probability: Moderate
The Verdict Date
February 14, 2026 – Day 90.
-
If price closes above $105,629 before then – false signal. 100%* historical accuracy.
-
If price is still below $105,629 – bear market. 100%* historical accuracy.
24 days to find out. Wait, it’s the 21st now, 23 days left to find out. 📆
TECHNICAL ANALYSIS
* The * Fine * Print *
Notice all those asterixesesss? These: * * * * * ? 🫢
Let’s be honest about what “100% accuracy” really means here.
The sample size is small. The 90-Day Rule is based on 12 resolved death crosses. Twelve. One weird cycle and the pattern breaks. “100% accuracy” on n=12 is just pattern recognition.
The -0.5 MVRV Rule has triggered 4 times. Four. Yes, buying at -0.5 has always been profitable within a year. But four data points across 15 years isn’t a trading system.
“Everything recovers” is true but misleading: The question isn’t whether you make money eventually. It’s how long you sit underwater and how much pain you absorb getting there. I mean, I like to get in on things when there down as much as anyone else, I just don’t want to be kicked in the nuts for 300+ days either.
Real bear death crosses – time to recover the entry price:
-
Sep 2014: DC at $475. Bottom at $157 (-67%). Didn’t see $475 again for 14 months.
-
Mar 2018: DC at $6,854. Bottom at $3,177 (-54%). Didn’t recover for 13 months.
-
Jan 2022: DC at $43,073. Bottom at $15,504 (-64%). Didn’t see $43K again for 2 years.
If this is a real bear and you bought at $94K – history says you might wait 1-2 years to break even. And you’d sit through -30% to -65% drawdown in the meantime. That’s the pain zone.
The “all clear” buy signal at -0.5 MVRV isn’t comfortable either. The conditions that create a -0.5 reading – mass capitulation, exchanges blowing up, macro panic – aren’t exactly easy to buy into.
What this analysis gives you:
-
A framework for identifying which type of death cross you’re in (not a guarantee)
-
Historical thresholds that have worked before (not a promise they’ll work again)
-
Context for the current setup relative to past setups (not a prediction)
The rules are useful. The patterns are real. But small samples are small samples. Trade accordingly. 🧠
Get In Touch 📬
Email me, Jonathan Morgan, feedback; I’d love to hear from you. 📧
Follow me on Stocktwits 🫂 And Sponsor this newsletter 😎
Terms & Conditions 📝
Securities Disclaimer: STOCKTWITS IS NOT A TAX ADVISOR, BROKER, FINANCIAL ADVISOR OR INVESTMENT ADVISOR. THE SERVICE IS NOT INTENDED TO PROVIDE TAX, LEGAL, FINANCIAL OR INVESTMENT ADVICE, AND NOTHING ON THE SERVICE SHOULD BE CONSTRUED AS AN OFFER TO SELL, A SOLICITATION OF AN OFFER TO BUY, OR A RECOMMENDATION FOR ANY SECURITY. Trading in such securities can result in immediate and substantial losses of the capital invested. You should only invest risk capital, and not capital required for other purposes. You alone are solely responsible for determining whether any investment, security or strategy, or any other product or service, is appropriate or suitable for you based on your investment objectives and personal and financial situation. You should also consult an attorney or tax professional regarding your specific legal or tax situation. The Content is to be used for informational and entertainment purposes only and the Service does not provide investment advice for any individual. Stocktwits, its affiliates and partners specifically disclaim any and all liability or loss arising out of any action taken in reliance on Content, including but not limited to market value or other loss on the sale or purchase of any company, property, product, service, security, instrument, or any other matter. You understand that an investment in any security is subject to a number of risks, and that discussions of any security published on the Service will not contain a list or description of relevant risk factors. In addition, please note that some of the stocks about which Content is published on the Service have a low market capitalization and/or insufficient public float. Such stocks are subject to more risk than stocks of larger companies, including greater volatility, lower liquidity and less publicly available information. Read the full terms & conditions here. 🔍
Author Disclosure: The author of this newsletter holds positions in AVAX, ADA, PUDGY, WLC, IMX, XTZ, NEAR, HBAR, ALGO, INJ, LTC, LINK, ZEC, XLM, and FET. 📋