Chart of the Day – Citi Surprise Index vs SFR9 (Fed Funds Rate Proxy)

Source: Bloomberg
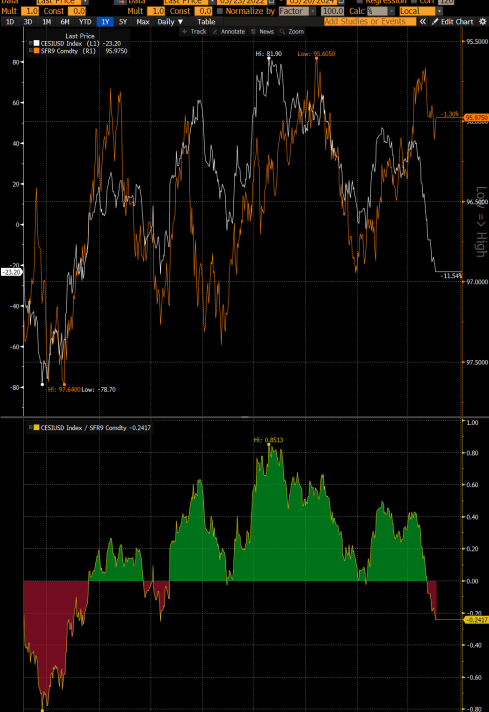
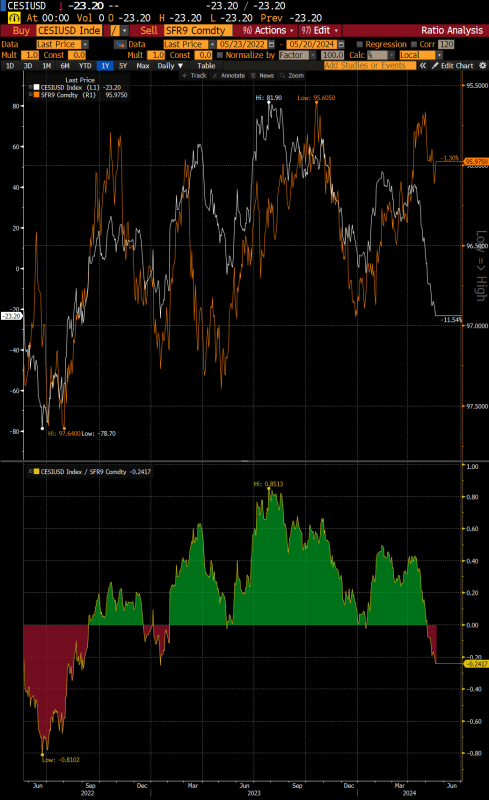
Trigger Warning: Chart of the Day: Citi Surprise Index vs SFR9 (proxy for federal funds rate 9 months forward)
My hypothesis is that the US economy has begun to slow due to the long and variable lags of monetary policy finally starting to offset the positive benefits that have come from higher government deficits putting interest expense “stimmys” into the hands of households and corporations that have locked in low cost borrowings executed during the depths of Covid.
So the economy is starting to roll over and certainly is faltering against elevated expectations (hence Citi surprise breakdown). However, because of the sticky inflation which was confirmed again last week with supercore CPI running 4.9% yoy (chart below) and what is looking like an April core PCE which is likely to come in near 0.3% mom, the Fed is really in no position to address the slowdown in growth with more accommodation because the economy is not on any sustainable path back to 2% inflation.
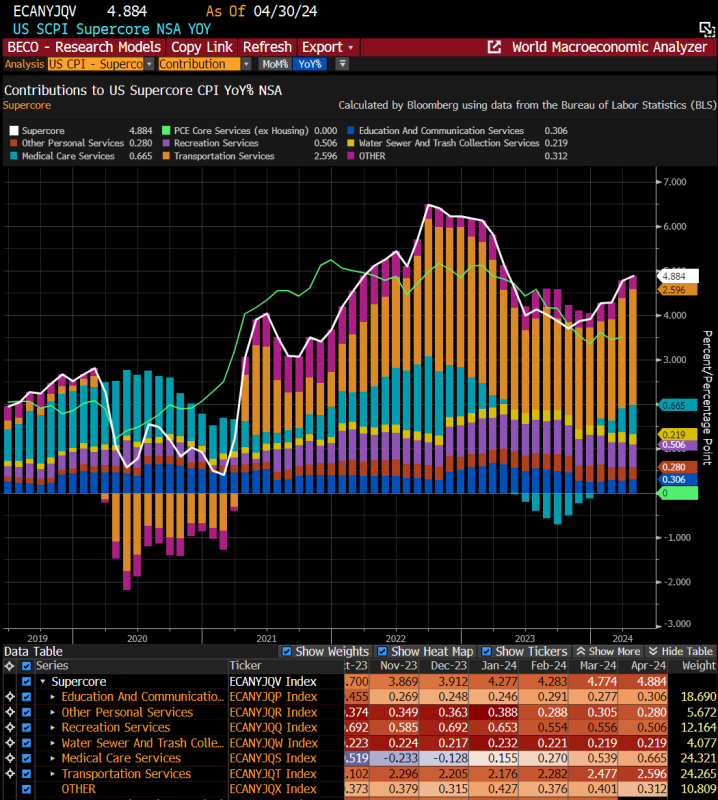
Source: Bloomberg, BLS
So there is a gap opening up here where the economy has begun to stall but the Fed is not going to do anything about it. And the longer the Fed is forced to stay on hold because of the elevated inflation, the more likely that the economy is going to falter further which means even when they eventually start to cut, the actual impact on the economy will be muted (also the reduction in interest rate “stimmys” paid to households and corporates will fall, moderately hitting spending too).
I think we are opening up an air pocket of risk here where growth is faltering, the Fed is forced into higher for longer because of sticky inflation and Treasury is selling more bonds every day and isn’t providing any incremental pump to the economy before the next QRA in end of July.
We are about to exit options expiry week and move into a 5 week expiry cycle which will dilute the vanna/charm buyback flows of hedges in the earlier part of the “window of weakness” for a longer period this time which means the potential that something macro shaking up the markets has a higher probability for the next 2-3 weeks because the daily buyback flows are lower. We are starting in a positive gamma regime with CTAs and vol control funds more long than not.
If we begin to get a pick up in rates volatility as more hawkish Fed speak (Waller and Minutes next week) signals to the market that the Dot plot is going to show a median of only 1 cut for 2024 with several members looking for no cuts (maybe even 1 member with a hike), or if we get oil price moving higher post the Xi/Putin meeting and into BRICS central bankers meetings later this month in Moscow ahead of the June OPEC+ meeting, perhaps we could be setting the stage for a more dangerous trading environment between the May and June expiry. Obviously, we have the Fed meeting on the same day as CPI on the 12th and we also have a significant tax payment liquidity drain that will be made on June 17th which could add fireworks to the liquidity situation around the time.
Stocks are at the highs, vol is at the lows. I’m on the record short small caps. I’m not going anywhere. I think hedging makes sense here.
Have you enjoyed this content? Then please sign up at LaDuc Trading where I host a Slack Channel and provide real-time market commentary throughout the trading day.
Important Disclaimer: This website is for educational purposes only. The Alethea Narrative and its authors are not financial advisors and nothing posted should be considered investment advice. The securities discussed are considered highly risky so do your own due diligence.


