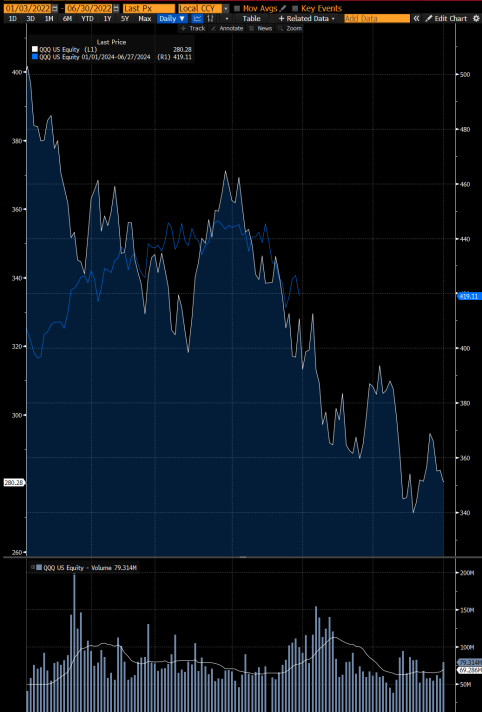
Chart of the Day: Nasdaq 2022 Analog

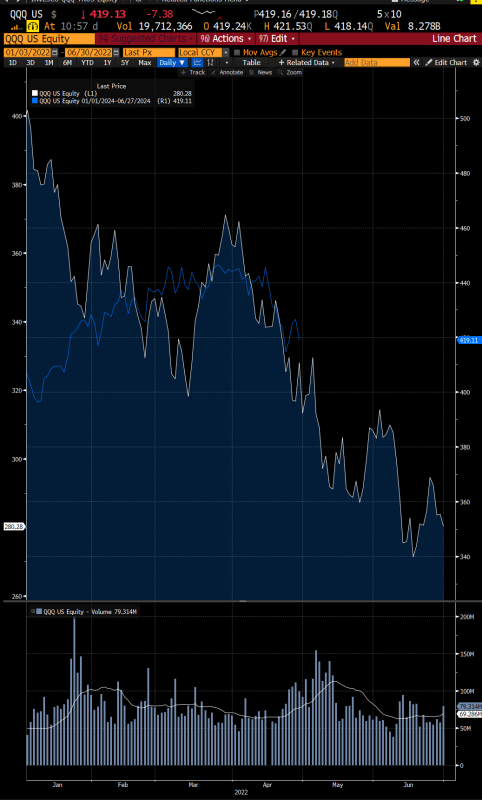
Analogs are usually just a fool’s errand but they are still fun to play with. This one looks at the YTD performance of the Nasdaq vs the performance of Nasdaq in the first half of 2022.
Back then, stocks really struggled when accelerating inflation momentum was becoming more firmly entrenched in the economy and the Fed was going to have to react with larger interest rate hikes to slow it down.
This time around, we have the market rapidly pricing out the interest rate cuts that were expected to start the year and that the Fed had been forecasting. We have gone from expected 6 rate cuts in 2024 to now barely 1 expected. This has started to tighten financial conditions and is becoming a headwind for equities.
Will the performance repeat as we head into the “Sell in May” period? I am inclined to believe it will as I expected lower equity prices in the coming months as the Fed is forced to get more serious about bringing inflation back down to 2%.

