Stocktwits Crypto Data Dive – Week 13

Presented by
OVERVIEW
Stocktwits Crypto Data Dive – Week 13

Welcome to the Stocktwits Crypto Data Dive for Week 13 of 2026! 📊
In this issue, we’ll dive into the data to keep you informed about the progress of the overall crypto market and shine a spotlight on emerging and established trends.
What You’ll Find In The Stocktwits Crypto Data Dive has three main objectives:
-
Total and Altcoin caps, stamped with YTD moves and the gap to ATH.
-
Seven-layer market-cap recap (TMC ex-stables, ex-top-50, and five more flavors).
-
Crypto Index Performance covering 12 indices.
-
The Liquidation Station boards the train with 30-day totals plus a 7-day heatmap for maximum schadenfreude.
-
Market Heatmap, Social Volume Heatmap, Active Address Heatmap.
-
ETF scorecards for BTC and ETH still tracking 7- and 30-day flows.
So, without further delay, let’s jump right into the data from week 13 and explore its intriguing insights! 🚀
SPONSORED BY KRAKEN
Kraken Pro: Advanced Tools for Serious Crypto Traders
Kraken Pro is a powerful trading platform designed for advanced crypto traders seeking greater control, deeper insights and professional-grade tools. The platform provides access to spot, margin and derivatives trading within a single interface, enabling users to manage portfolios and execute strategies efficiently. Kraken Pro also features advanced charting, technical indicators and real-time market data to help analyze trends and identify opportunities quickly. With access to hundreds of crypto assets and advanced order types such as stop-loss and take-profit, traders can diversify strategies while managing risk. Built on Kraken’s security-focused infrastructure, Kraken Pro delivers institutional-grade performance with a modern interface designed for speed, flexibility and informed decision-making.
-
Kraken Disclosure: This post contains affiliate links, which means I may receive a commission at no cost to you if you make a purchase through a link.
-
Availability of margin trading services is subject to certain limitations and eligibility criteria. Trading using margin involves an element of risk and may not be suitable for everyone. Read Kraken’s Margin Disclosure Statement to learn more
-
Futures trading involves substantial risk and is not suitable for everyone. Losses may exceed the initial investment. Past performance is not necessarily indicative of future results. U.S. Futures services are offered by Kraken Derivatives U.S. View Risk Disclosure Statement.
-
Not investment advice. Crypto trading involves risk of loss and is offered to US customers through Payward Interactive, Inc. View legal disclosures atkraken.com/legal/disclosures.
*3rd Party Ad. Not an offer or recommendation by Stocktwits. See disclosure here.
CRYPTO
Crypto Market Cap Update
What is the broader trend within the crypto market? The simplest way to track this is by using three market cap charts. So let’s see what we got. 🔭
*the price levels and performance values may be very different from what you read in your mailbox vs. what’s happening in the live market. This is especially true when crypto faces a new bull or bear run.
Total Market Cap
-
All-Time High Close: $4.22 trillion
-
YTD: -21%
-
From ATH: -45%

Click to enlarge.
Altcoin Market Cap
-
All-Time High: $1.73 trillion
-
YTD: -20%
-
From ATH: -44%
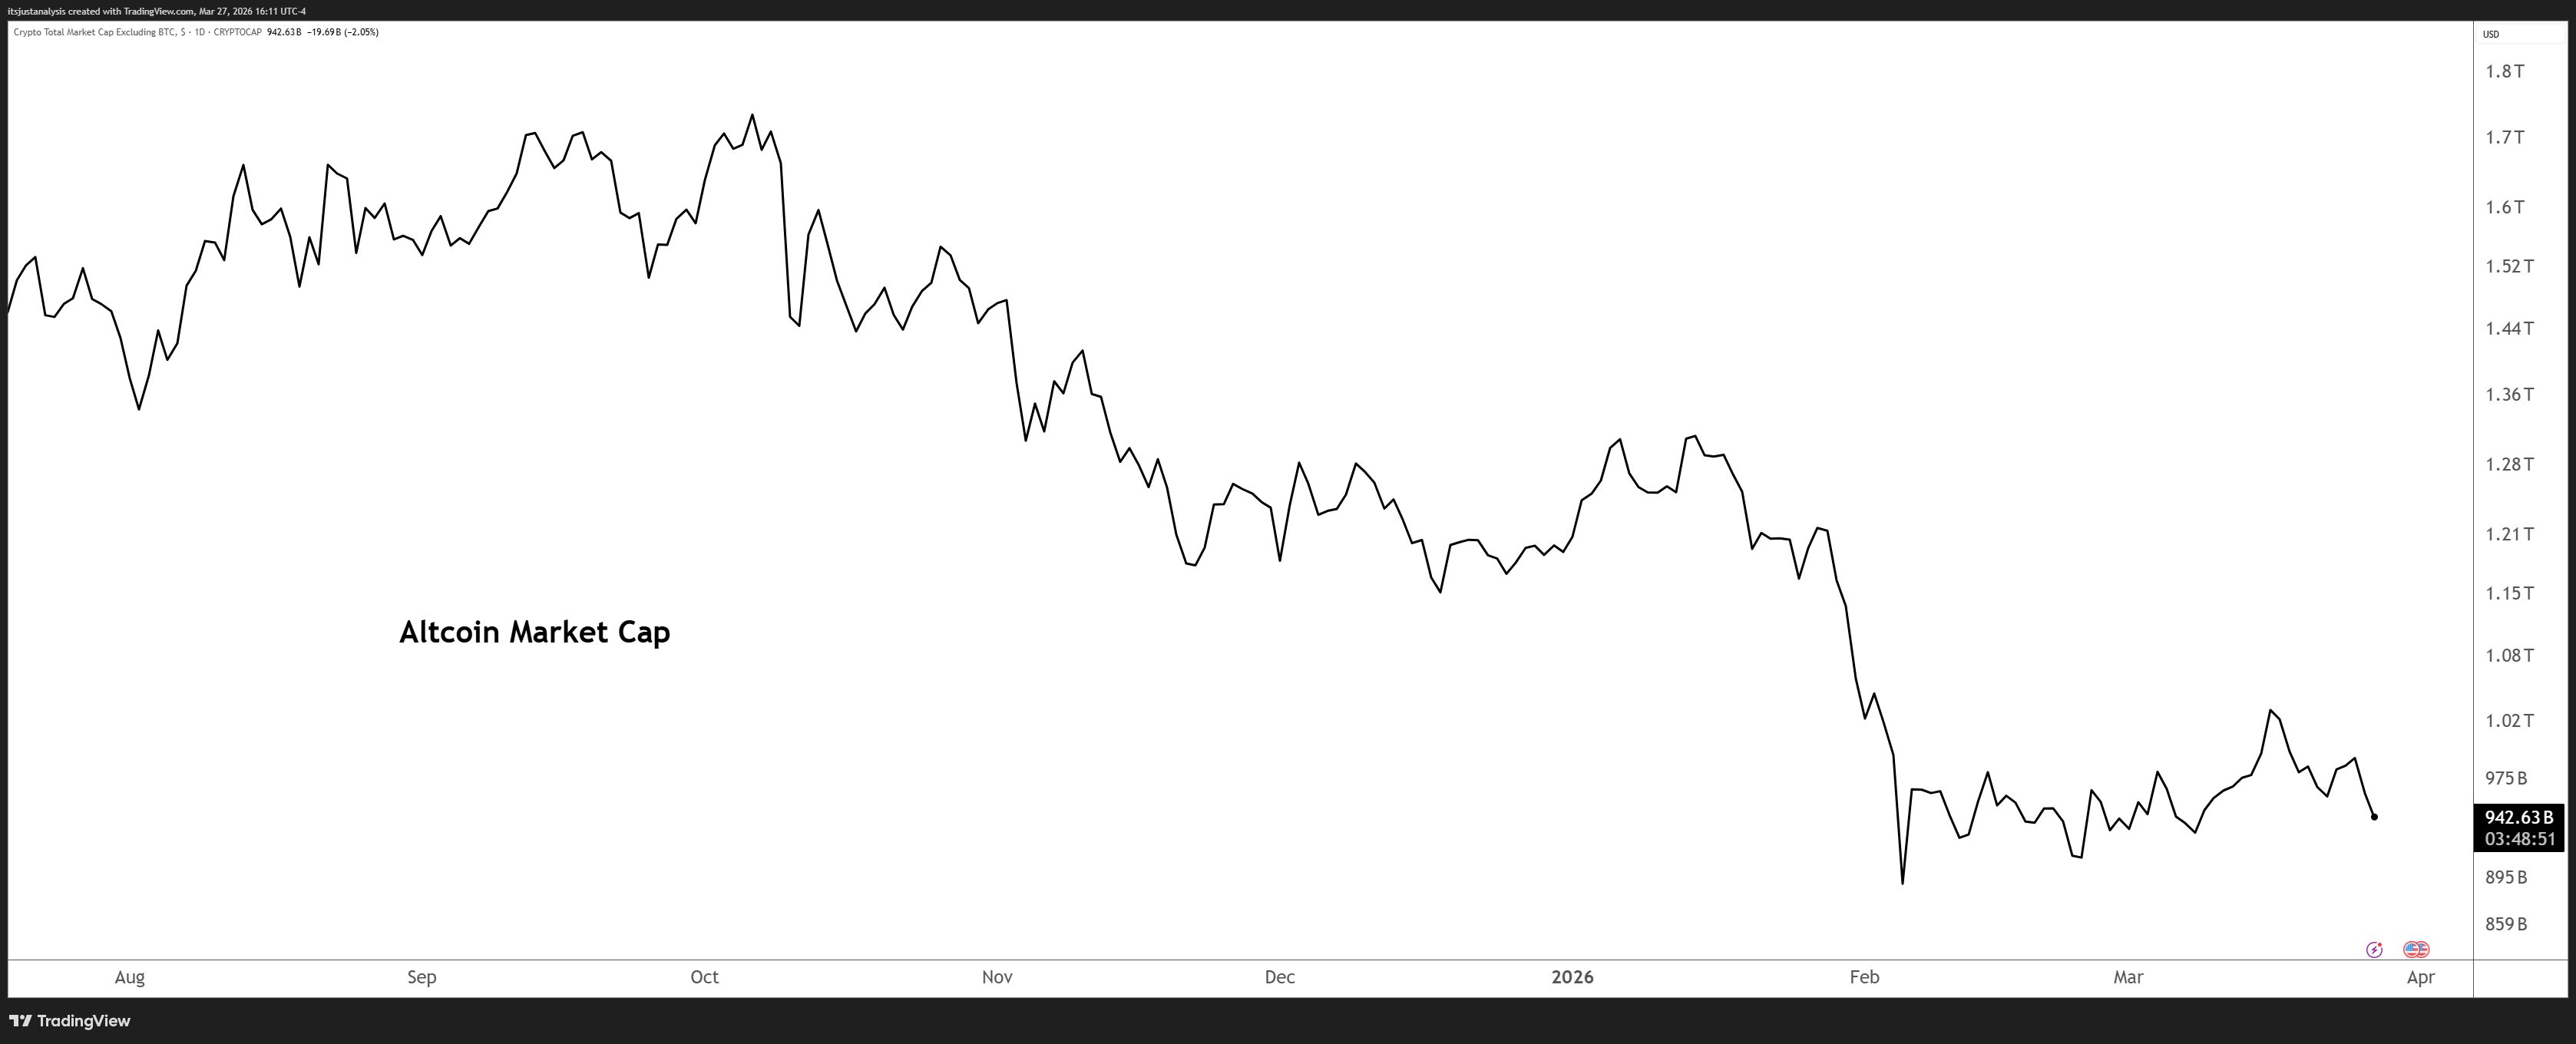
Click to enlarge.
STOCKTWITS
Missed An Issue This Week? I Got Ya Right Here 👇️
Here’s this week’s Cryptotwits newsletters. That you probably read already. Maybe. Probably.
Monday – DOGE And Gold Are On The Same Leaderboard And Nobody Thinks That’s Weird 😕
Wednesday – Peter Schiff Somewhere Staring At A Wall Right Now And Honestly I Hope He’s Okay 👨⚕️
Thursday – The Night Is Darkest Just Before The Dawn And It’s Been Dark For 46 Days So Statistically We’re Very Close 📆
Friday – Bitcoin’s Momentum Gauges Just Broke History 🤯
CRYPTO
Stocktwits Crypto Index RRG
Relative Rotation Graphs (RRG) help us visualize how a currency or sector performs compared to a benchmark – in this case, the U.S. Dollar Index (DXY). Think of the four colored sectors as stages in a race:
-
Leading Quadrant (green) – You’re a champ! 🏆 You’re ahead of everyone else, and the crowd is cheering. But watch out; you might be overdoing it.
-
Weakening Quadrant (yellow) – You’re slowing down 😓 and losing your lead. Maybe you’re a bit demoralized because your biggest fan didn’t show up. You’re now in the middle of the pack.
-
Lagging Quadrant (red) – Disaster strikes! 😱 You’re injured, exhausted, or just made a big mistake. You’re now in last place, and it’s a sad scene.
-
Improving Quadrant (blue) – Time for a comeback! 💪 Your motivation returns, the music swells, and you’re picking up speed. You’re back in the middle, catching up with the leaders.
Analyzing the RRG Examples
Example 1: Rapid Rotation
– If an instrument moves quickly through all four quadrants, it could indicate high volatility or erratic behavior. Traders may want to be cautious or use appropriate risk management strategies in such cases.
Example 2: Stuck in the Middle
– An instrument that remains close to the center of the RRG might be in a consolidation phase, lacking a clear trend or momentum. Traders might wait for a decisive move before entering a position.
Example 3: Consistent Leader
– If an instrument stays in the Leading Quadrant (top right) for an extended period, it could signify a strong, sustained uptrend. Traders might consider buying opportunities or riding the trend.
Example 4: Slow Recovery
– An instrument that gradually moves from the Lagging Quadrant (bottom left) to the Improving Quadrant (blue) and eventually to the Leading Quadrant (green) could indicate a slow but steady recovery. Traders might look for potential reversal or bottom-fishing opportunities.
The GIF below shows the past 21 days of movement on the RRG.

The GIF below shows the past 13 weeks of movement on the RRG.

Click to enlarge.
CRYPTO
Weekly Total Market Cap (TMC) Performance
|
Index |
Value |
Weekly Performance |
|---|---|---|
|
TMC Excluding BTC and ETH |
$701B |
-1% |
|
TMC Excluding BTC and Stablecoins |
$653B |
-2% |
|
TMC Excluding BTC, ETH, and Stablecoins |
$413B |
-2% |
|
TMC Excluding Stablecoins |
$1.97T |
-2% |
|
TMC Excluding Top 10 |
$170B |
0% |
|
TMC Excluding Top 50 |
$38B |
0% |
|
TMC Excluding Top 100 |
$6B |
-5% |
CRYPTO
Weekly Crypto Index Performance
|
Index |
Weekly Performance |
|---|---|
|
AI |
+4% |
|
Decentralized Finance |
-4% |
|
Decentralized Physical Infrastructure |
0% |
|
Exchange Tokens |
-2% |
|
Layer 1 |
-2% |
|
Meme |
+7% |
|
Proof-Of-Stake |
-3% |
|
Proof-Of-Work |
-2% |
|
Real World Asset Tokenization |
-1% |
|
Rehypothecated |
-3% |
|
Smart Contracts |
-3% |
|
Stablecoins |
0% |
STOCKTWITS
Latest Stocktwits Podcasts & Videos 😱
The Latest Cryptotwits Podcast – DeFi Hacks, MEV “Sandwich Tax,” and Why CME Wants 24/7 Futures
The Howard Lindzon Show – Truth Social Moves Markets + Why Young Traders Think the Market’s Rigged
Talking Tickers – AI Spending vs Layoffs: META Debate, ServiceNow Value Case, and HIMS Risk/Reward
Boardroom Exclusives – Emergent BioSolutions CEO Joe Papa on the Turnaround, Narcan, and Global Growth
StocktwitsTV – After the IPO: Swarmer CEO Explains the Moat, Data Flywheel, and Backlog
True Odds Podcast – Big Ten to Win It All? Conference Winner Market + Sweet 16 Picks
CRYPTO
Liquidation Station 😱
Interested in how much has been flushed out of leveraged long and short positions? Who’s getting hurt the most? This is the best place to get an idea of how leveraged positions are doing. 🔴
30-day Total Liquidations 📆
What You’re Looking At
-
Green bars above zero = longs blown out because price fell.
-
Red bars below zero = shorts blown out because price ripped.
-
Left-hand scale is U.S. dollars (millions); the dashed line near the top sits at $1B.
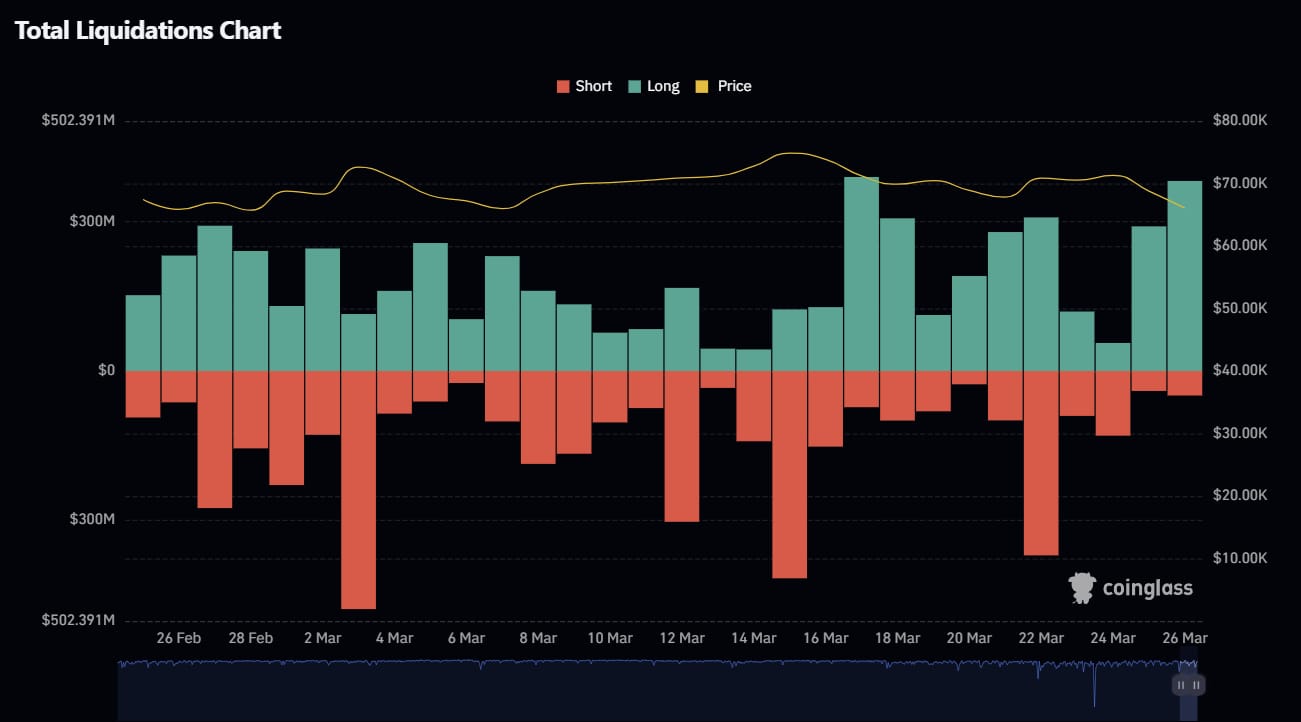
30-day Total Crypto Liquidation Chart – Click to enlarge.
-
Mar 3 – Mar 4 – One of the biggest short liquidations ($500M). Classic squeeze after downside fails.
-
Mar 12 – Another heavy short wipe ($300M). Traders keep shorting the range lows like it’s a personality trait.
-
Mar 15 – Mar 16 – Follow-through short liquidations ($350M-$400M) as price rotates up again.
-
Mar 22 – Mar 23 – Noticeable long liquidation cluster ($300M) during a pullback.
-
Late period (Mar 25 – Mar 26) – Longs step back in and get clipped again on minor weakness.
What You’re Looking At
-
Rows = coins, columns = timestamps.
-
Color = head-count of forced liquidations (legend tops at 2,000).
-
A cell showing “BTC 1,600” means 1,600 separate BTC positions were liquidated.
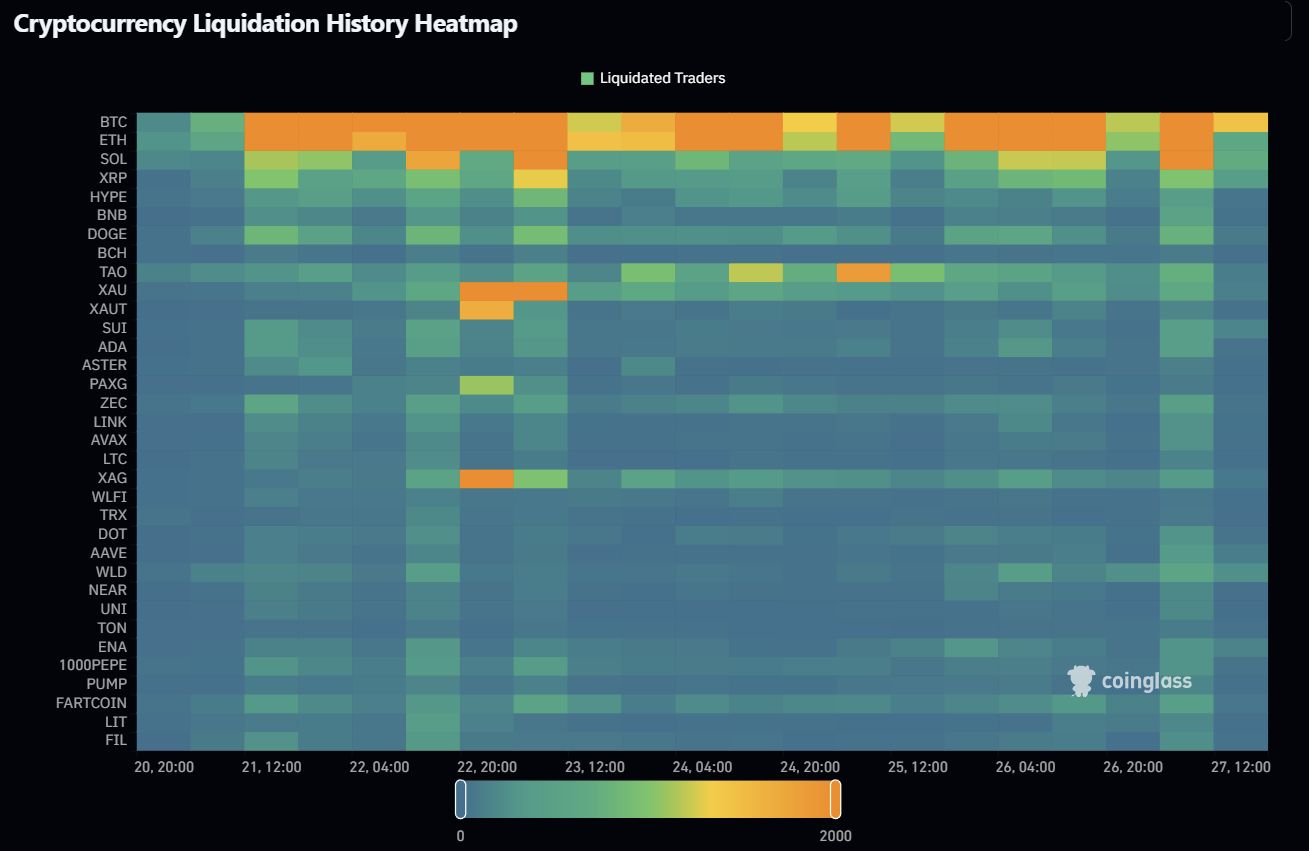
7-day Cryptocurrency Liquidation Heatmap – Click to enlarge.
-
Mar 21 – Mar 22 – Early spike across BTC/ETH, first real flush of the week.
-
Mar 22 20:00 – Mar 23 12:00 – Strong cluster, aligns with one of the bigger short squeezes.
-
Mar 24 – Mar 25 – Continued activity, but already cooling off. Less aggressive participation.
-
Mar 25 12:00 – Mar 26 04:00 – Another wave across majors, not as intense as earlier.
-
Mar 26 – Mar 27 – Tapers off. Market basically shrugs and goes back to sideways nonsense.
Some Interesting Insights 👓️
-
Monthly confirms range-bound chop with repeated liquidation cycles.
-
Weekly shows localized bursts, not structural stress.
-
Shorts keep getting squeezed at the wrong spots, longs get clipped on pullbacks.
-
No trend. No breakout. Just a machine that harvests overconfidence.
Terms & Conditions 📝
Securities Disclaimer: STOCKTWITS IS NOT A TAX ADVISOR, BROKER, FINANCIAL ADVISOR OR INVESTMENT ADVISOR. THE SERVICE IS NOT INTENDED TO PROVIDE TAX, LEGAL, FINANCIAL OR INVESTMENT ADVICE, AND NOTHING ON THE SERVICE SHOULD BE CONSTRUED AS AN OFFER TO SELL, A SOLICITATION OF AN OFFER TO BUY, OR A RECOMMENDATION FOR ANY SECURITY. Trading in such securities can result in immediate and substantial losses of the capital invested. You should only invest risk capital, and not capital required for other purposes. You alone are solely responsible for determining whether any investment, security or strategy, or any other product or service, is appropriate or suitable for you based on your investment objectives and personal and financial situation. You should also consult an attorney or tax professional regarding your specific legal or tax situation. The Content is to be used for informational and entertainment purposes only and the Service does not provide investment advice for any individual. Stocktwits, its affiliates and partners specifically disclaim any and all liability or loss arising out of any action taken in reliance on Content, including but not limited to market value or other loss on the sale or purchase of any company, property, product, service, security, instrument, or any other matter. You understand that an investment in any security is subject to a number of risks, and that discussions of any security published on the Service will not contain a list or description of relevant risk factors. In addition, please note that some of the stocks about which Content is published on the Service have a low market capitalization and/or insufficient public float. Such stocks are subject to more risk than stocks of larger companies, including greater volatility, lower liquidity and less publicly available information. Read the full terms & conditions here. 🔍
Author Disclosure: The author of this newsletter holds positions in ADA, IMX, COPI, MIN, AGIX, ALGO, ZEC, XLM, and NEAR. 📋