
Stocktwits Crypto Data Dive – Week 15

Presented by
OVERVIEW
Stocktwits Crypto Data Dive – Week 15

Welcome to the Stocktwits Crypto Data Dive for Week 15 of 2026! 📊
In this issue, we’ll dive into the data to keep you informed about the progress of the overall crypto market and shine a spotlight on emerging and established trends.
What You’ll Find In The Stocktwits Crypto Data Dive has three main objectives:
-
Total and Altcoin caps, stamped with YTD moves and the gap to ATH.
-
Seven-layer market-cap recap (TMC ex-stables, ex-top-50, and five more flavors).
-
Crypto Index Performance covering 12 indices.
-
The Liquidation Station boards the train with 30-day totals plus a 7-day heatmap for maximum schadenfreude.
-
Market Heatmap, Social Volume Heatmap, Active Address Heatmap.
-
ETF scorecards for BTC and ETH still tracking 7- and 30-day flows.
So, without further delay, let’s jump right into the data from week 15 and explore its intriguing insights! 🚀
THE CASHTAG AWARDS
The BIGGEST night in Finance. May 4th. NYSE.

The Cashtag Awards are built by the Stocktwits community and it wouldn’t be the same without you in the room!
We’re offering a limited number of fully comped tickets for members who want to show up, represent, and help make this night as special as it should be.
Want to celebrate with us on May 4th?
CRYPTO
Crypto Market Cap Update
What is the broader trend within the crypto market? The simplest way to track this is by using three market cap charts. So let’s see what we got. 🔭
*the price levels and performance values may be very different from what you read in your mailbox vs. what’s happening in the live market. This is especially true when crypto faces a new bull or bear run.
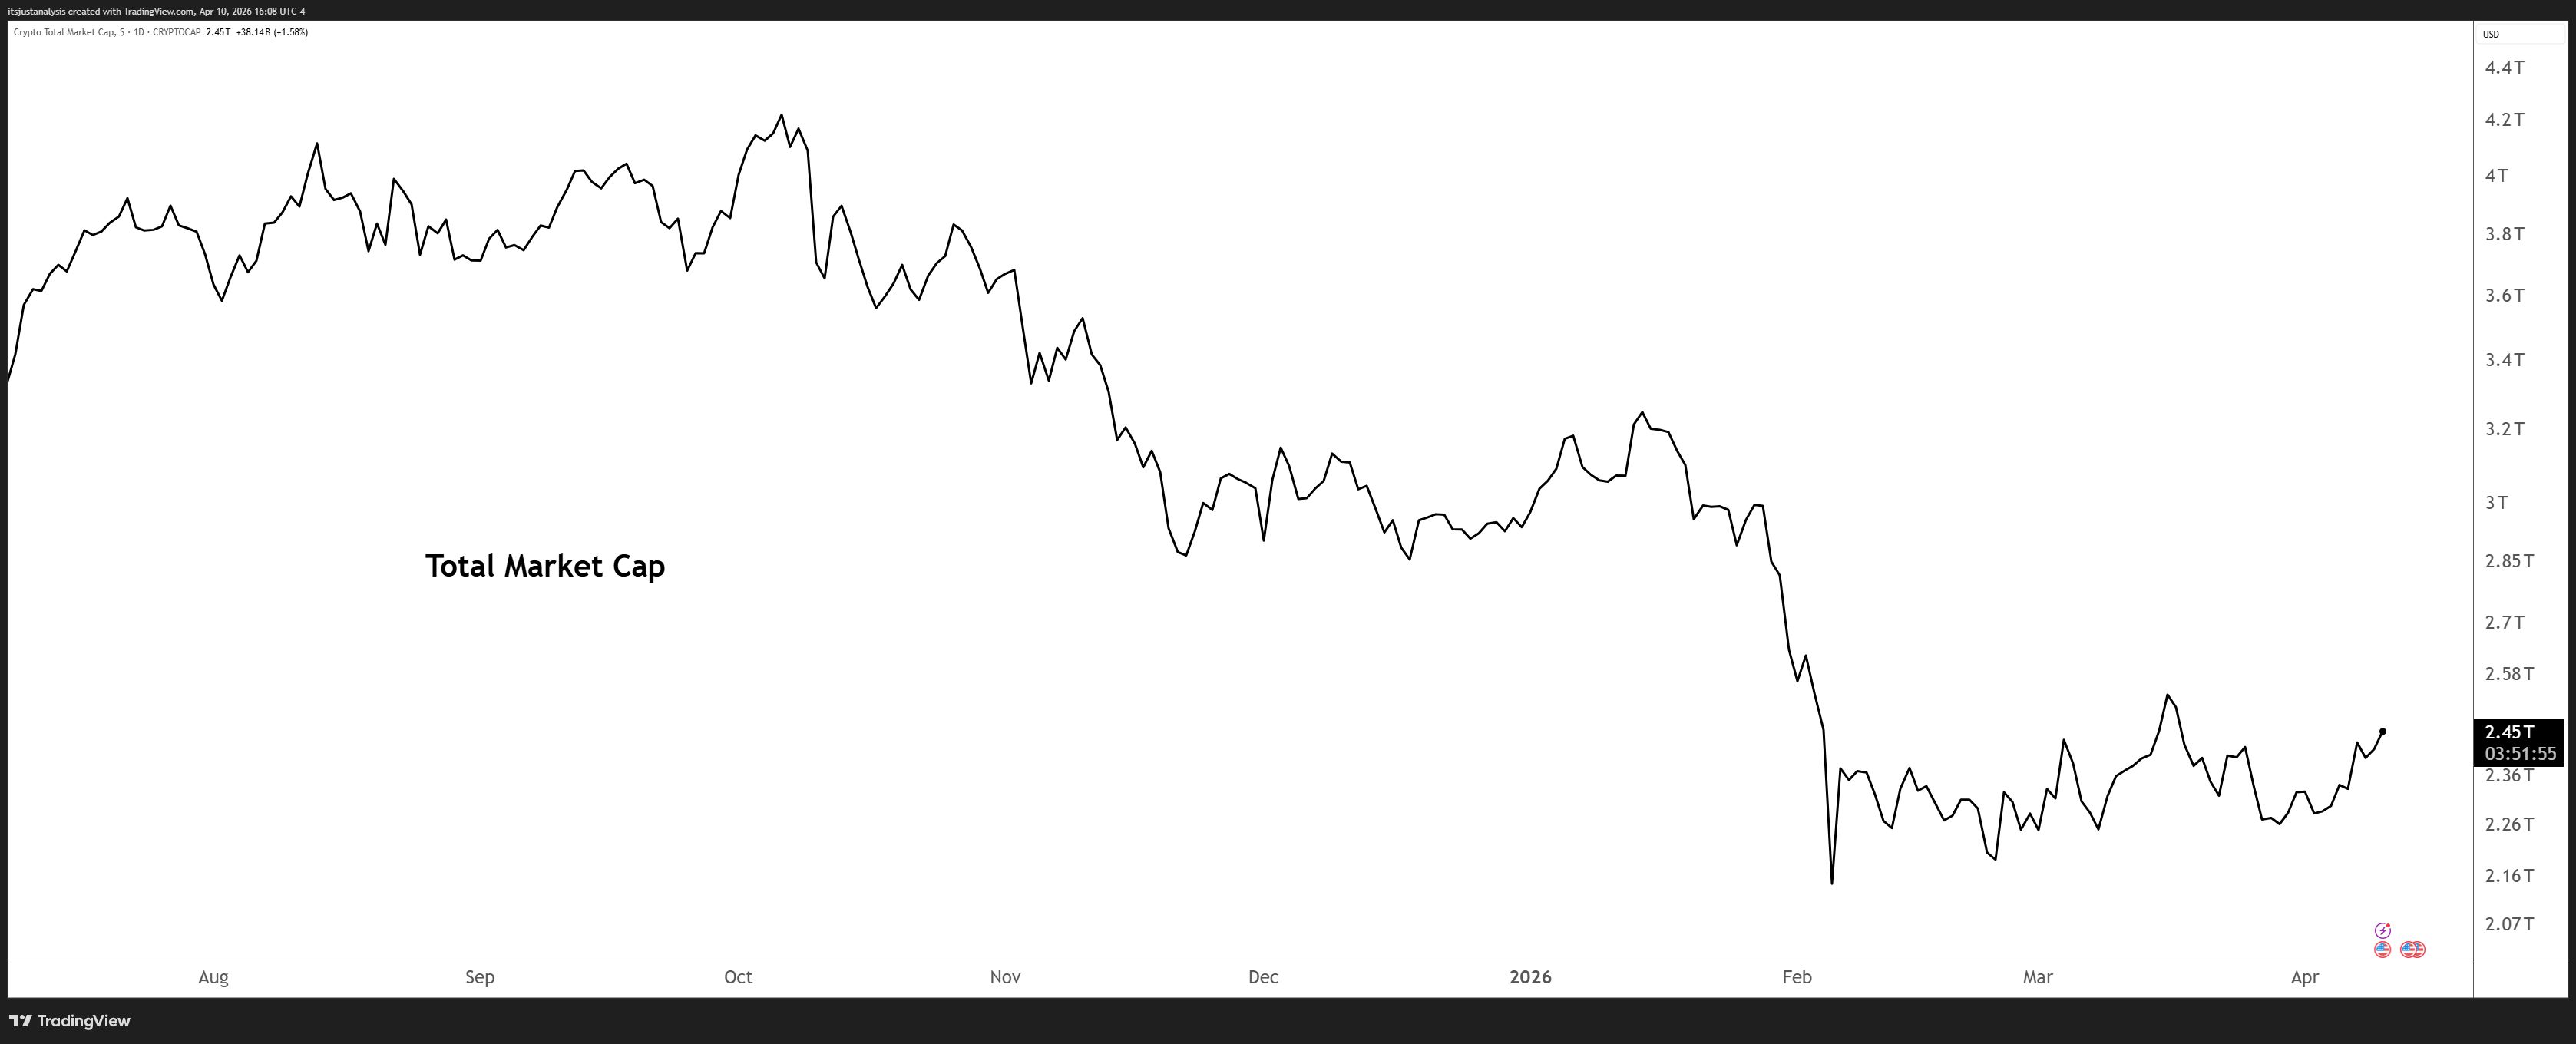
Total Market Cap
-
All-Time High Close: $4.22 trillion
-
YTD: -19%
-
From ATH: -43%
Click to enlarge
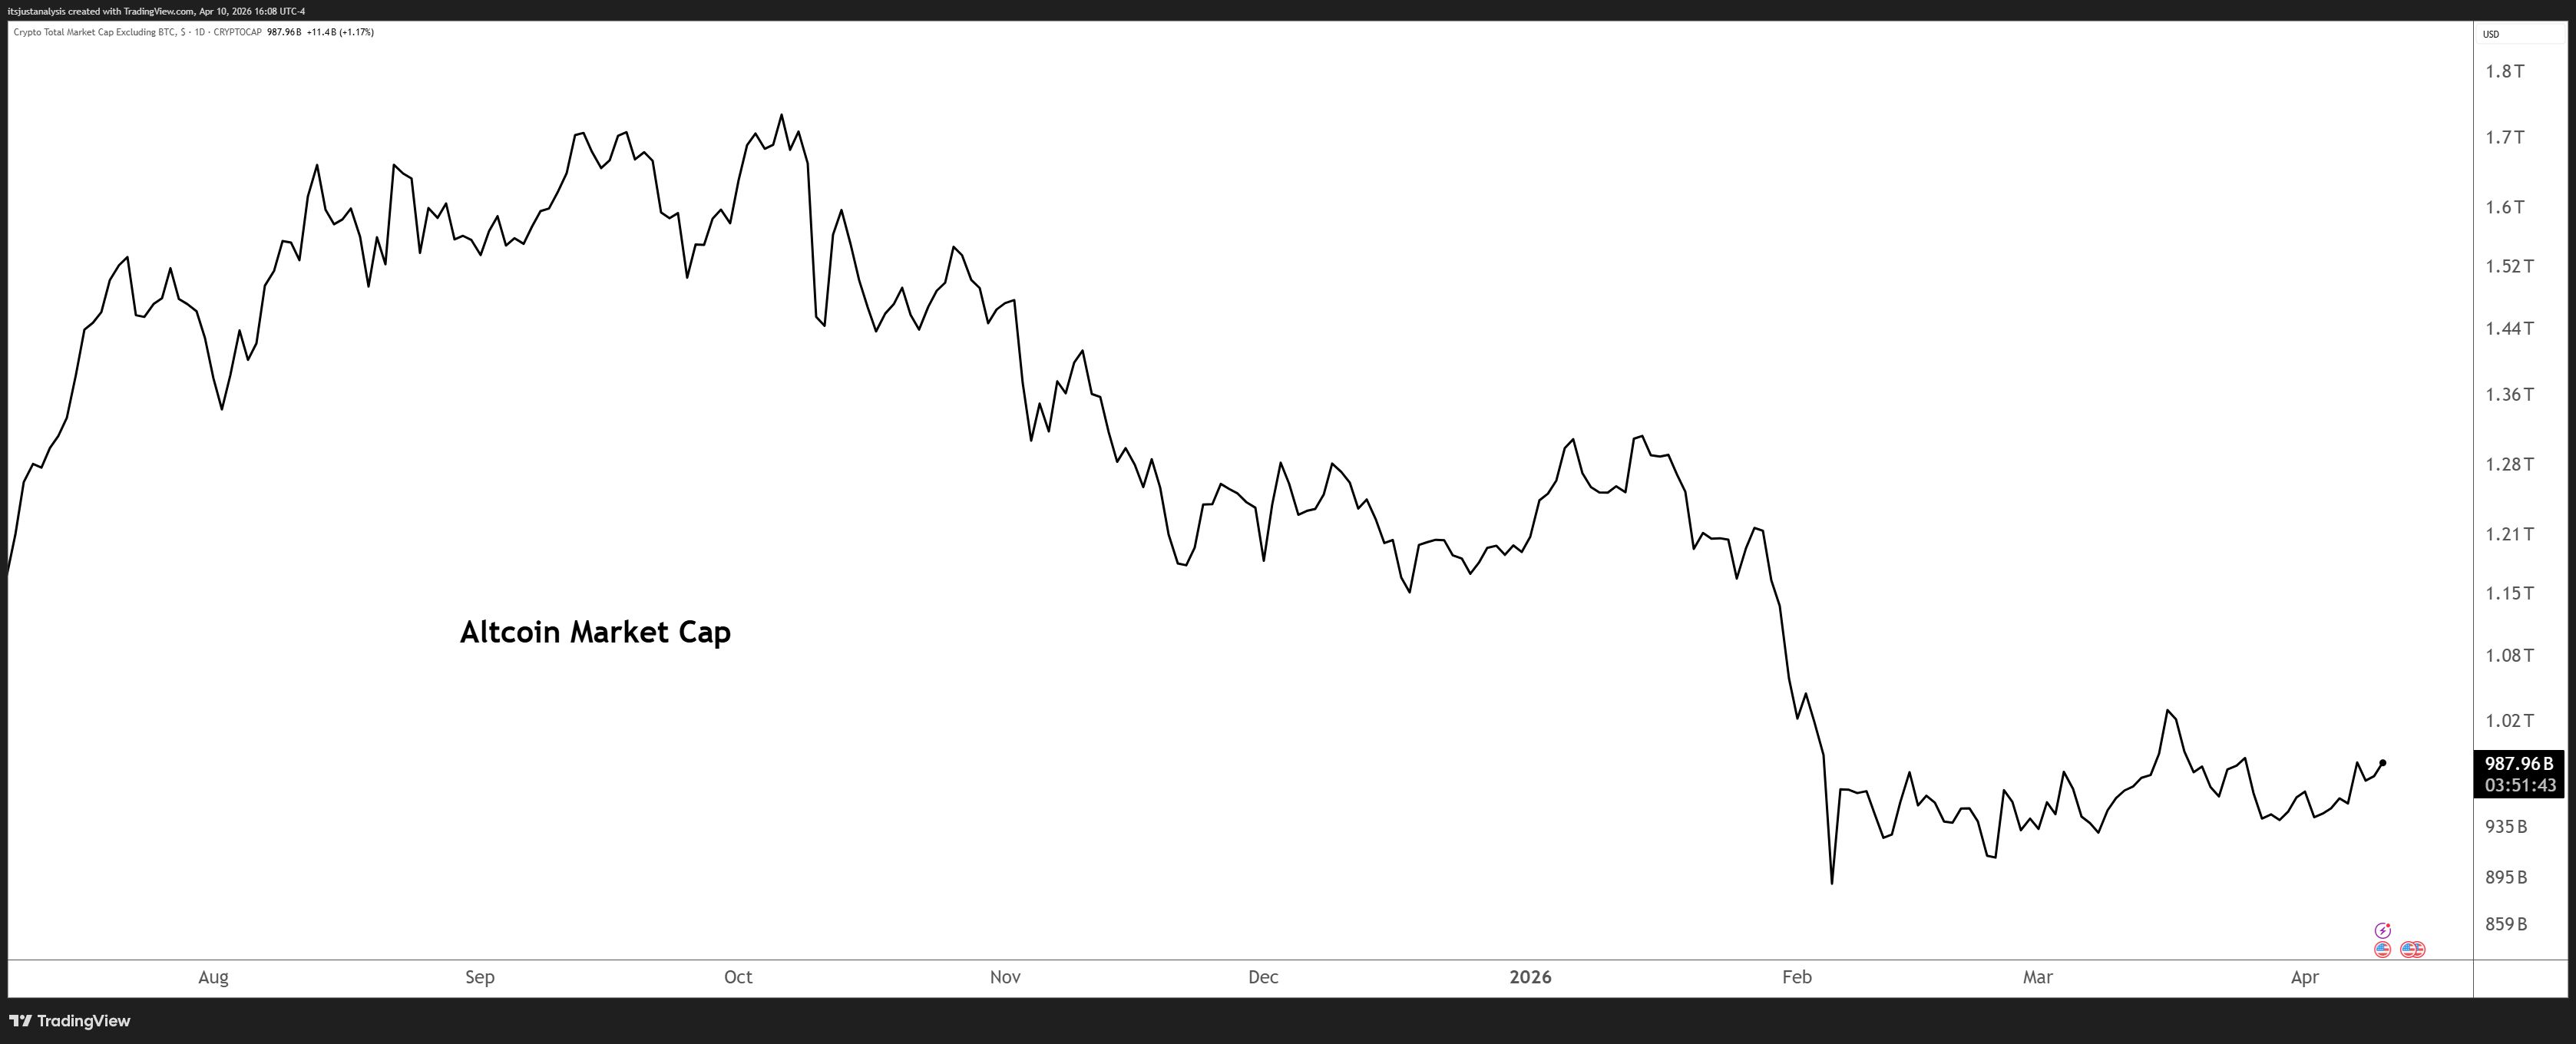
Altcoin Market Cap
-
All-Time High: $1.73 trillion
-
YTD: -19%
-
From ATH: -44%
Click to enlarge.
SPONSORED
Become the go-to AI expert in 30 days

AI keeps coming up at work, but you still don’t get it?
That’s exactly why 1M+ professionals working at Google, Meta, and OpenAI read Superhuman AI daily.
Here’s what you get:
-
Daily AI news that matters for your career – Filtered from 1000s of sources so you know what affects your industry.
-
Step-by-step tutorials you can use immediately – Real prompts and workflows that solve actual business problems.
-
New AI tools tested and reviewed – We try everything to deliver tools that drive real results.
-
All in just 3 minutes a day
STOCKTWITS
Missed An Issue This Week? I Got Ya Right Here 👇️
Here’s this week’s Cryptotwits newsletters. That you probably read already. Maybe. Probably.
Monday – IRS Participation Trophy: The Q2 Altcoin Market Cap Audit 📛
Tuesday – The Toll Booth Guys Just Declared War On Roads 🪖
Wednesday – White House To Banking Lobby: Sir, This Is A Wendy’s 🍟
Thursday – Bulls Are Doing Pushups In The Middle Of The Highway Again 🐂
Friday – My Confidence In This Confidence Is More Confident Than My Last Confidence 😐️
CRYPTO
Stocktwits Crypto Index RRG
Relative Rotation Graphs (RRG) help us visualize how a currency or sector performs compared to a benchmark – in this case, the U.S. Dollar Index (DXY). Think of the four colored sectors as stages in a race:
-
Leading Quadrant (green) – You’re a champ! 🏆 You’re ahead of everyone else, and the crowd is cheering. But watch out; you might be overdoing it.
-
Weakening Quadrant (yellow) – You’re slowing down 😓 and losing your lead. Maybe you’re a bit demoralized because your biggest fan didn’t show up. You’re now in the middle of the pack.
-
Lagging Quadrant (red) – Disaster strikes! 😱 You’re injured, exhausted, or just made a big mistake. You’re now in last place, and it’s a sad scene.
-
Improving Quadrant (blue) – Time for a comeback! 💪 Your motivation returns, the music swells, and you’re picking up speed. You’re back in the middle, catching up with the leaders.
Analyzing the RRG Examples
Example 1: Rapid Rotation
– If an instrument moves quickly through all four quadrants, it could indicate high volatility or erratic behavior. Traders may want to be cautious or use appropriate risk management strategies in such cases.
Example 2: Stuck in the Middle
– An instrument that remains close to the center of the RRG might be in a consolidation phase, lacking a clear trend or momentum. Traders might wait for a decisive move before entering a position.
Example 3: Consistent Leader
– If an instrument stays in the Leading Quadrant (top right) for an extended period, it could signify a strong, sustained uptrend. Traders might consider buying opportunities or riding the trend.
Example 4: Slow Recovery
– An instrument that gradually moves from the Lagging Quadrant (bottom left) to the Improving Quadrant (blue) and eventually to the Leading Quadrant (green) could indicate a slow but steady recovery. Traders might look for potential reversal or bottom-fishing opportunities.
The GIF below shows the past 21 days of movement on the RRG.

Click to enlarge.
The GIF below shows the past 13 weeks of movement on the RRG.

Click to enlarge.
CRYPTO
Weekly Total Market Cap (TMC) Performance
|
Index |
Value |
Weekly Performance |
|---|---|---|
|
TMC Excluding BTC and ETH |
$716B |
+3% |
|
TMC Excluding BTC and Stablecoins |
$700B |
+5% |
|
TMC Excluding BTC, ETH, and Stablecoins |
$427B |
+4% |
|
TMC Excluding Stablecoins |
$2T |
+7% |
|
TMC Excluding Top 10 |
$180B |
+4% |
|
TMC Excluding Top 50 |
$38B |
+5% |
|
TMC Excluding Top 100 |
$7B |
+8% |
CRYPTO
Weekly Crypto Index Performance
|
Index |
Weekly Performance |
|---|---|
|
AI |
+8% |
|
Decentralized Finance |
+5% |
|
Decentralized Physical Infrastructure |
+6% |
|
Exchange Tokens |
+3% |
|
Layer 1 |
+7% |
|
Meme |
+9% |
|
Proof-Of-Stake |
+5% |
|
Proof-Of-Work |
+7% |
|
Real World Asset Tokenization |
+3% |
|
Rehypothecated |
+6% |
|
Smart Contracts |
+5% |
|
Stablecoins |
0% |
STOCKTWITS
Latest Stocktwits Podcasts & Videos 😱
The Howard Lindzon Show – Niche Communities Win: Why StockTwits Is Getting Rejuvenated
StocktwitsTV – UFO, XBI, TSLA, NET: A Trader’s Playbook for 2026 Whiplash
After Hours – Anthropic’s Mythos is behaving like an angsty teenager with superpowers
StocktwitsTV – “The Moon Isn’t a Destination. It’s a Trade.” NASA ETF Manager on Space’s Next Catalysts
CRYPTO
Liquidation Station 😱
Interested in how much has been flushed out of leveraged long and short positions? Who’s getting hurt the most? This is the best place to get an idea of how leveraged positions are doing. 🔴
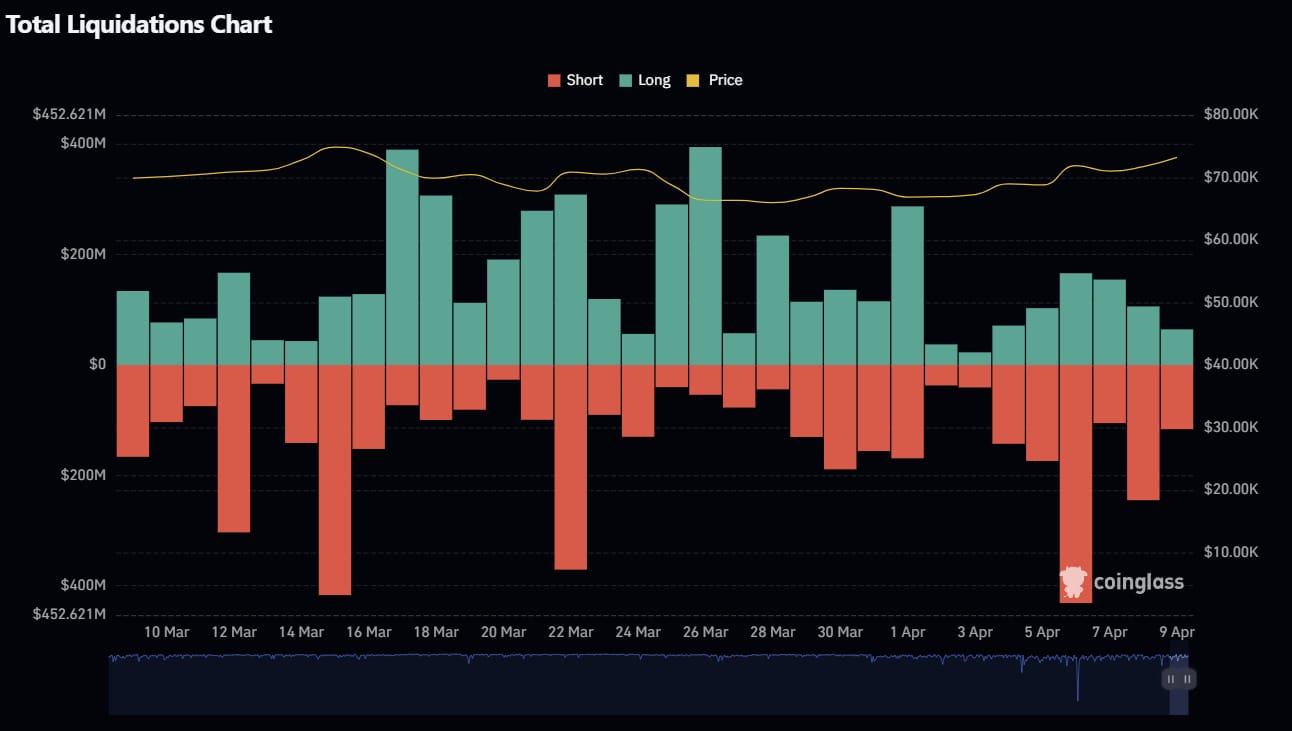
30-day Total Liquidations 📆
What You’re Looking At
-
Green bars above zero = longs blown out because price fell.
-
Red bars below zero = shorts blown out because price ripped.
-
Left-hand scale is U.S. dollars (millions); the dashed line near the top sits at $1B.
30-day Total Crypto Liquidation Chart – Click to enlarge.
-
Mar 12 – Heavy short liquidation ($300M+). Early squeeze, nothing sticks.
-
Mar 15 – Mar 16 – One of the bigger short flushes ($400M). Traders still leaning wrong into lows.
-
Mar 22 – Another clean short wipe ($350M) as price rotates up.
-
Late March (Mar 30 – Apr 1) – Mixed activity, smaller long and short liquidations ($150M-$250M). Chop intensifies.
-
Apr 6 – Apr 7 – Notable short liquidation spike ($400M), probably the cleanest squeeze late in the window.
-
Apr 8 – Apr 9 – Follow-up activity, but weaker. Momentum fades fast, as usual.
What You’re Looking At
-
Rows = coins, columns = timestamps.
-
Color = head-count of forced liquidations (legend tops at 2,000).
-
A cell showing “BTC 1,600” means 1,600 separate BTC positions were liquidated.
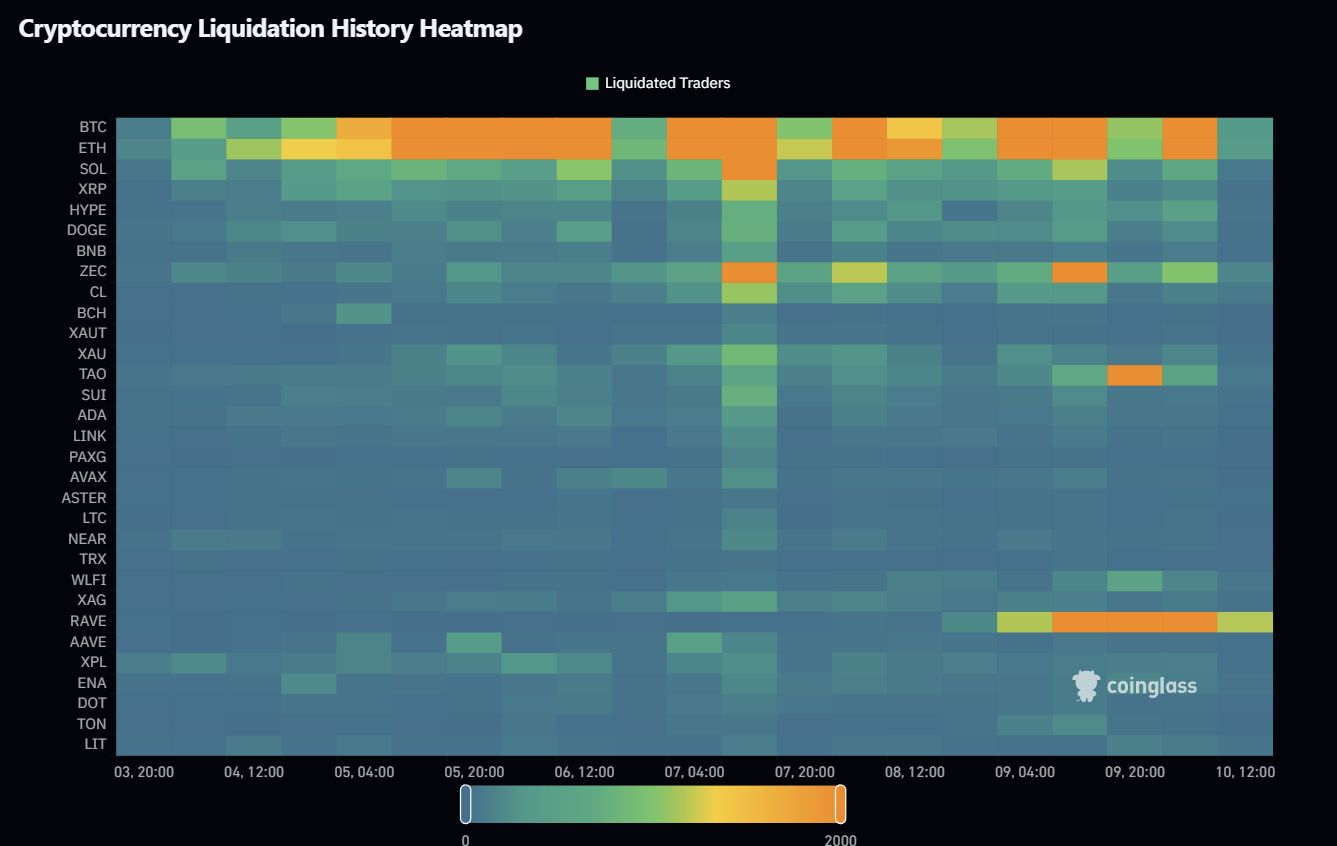
Weekly Crypto Liquidation History Heatmap – Click to enlarge.
-
Apr 3 – Apr 5 – Early cluster across BTC/ETH. First positioning reset of the week.
-
Apr 5 20:00 – Apr 6 12:00 – Stronger band, aligns with one of the larger short squeezes.
-
Apr 7 (mid-session) – Another burst across majors, but shorter-lived.
-
Apr 8 – Apr 9 – Scattered activity, already cooling off.
-
Apr 9 – Apr 10 – Mostly dead. Market just coasts.
Some Interesting Insights 👓️
-
Monthly shows repeated short squeezes inside a broader range.
-
Weekly confirms quick-hit liquidation bursts, not sustained stress.
-
No expansion in liquidation size → volatility capped, trend suppressed.
-
Both sides keep getting clipped depending on timing. No follow-through anywhere.
-
The market is rewarding patience while everyone else is taking turns being exit liquidity.
Terms & Conditions 📝
Securities Disclaimer: STOCKTWITS IS NOT A TAX ADVISOR, BROKER, FINANCIAL ADVISOR OR INVESTMENT ADVISOR. THE SERVICE IS NOT INTENDED TO PROVIDE TAX, LEGAL, FINANCIAL OR INVESTMENT ADVICE, AND NOTHING ON THE SERVICE SHOULD BE CONSTRUED AS AN OFFER TO SELL, A SOLICITATION OF AN OFFER TO BUY, OR A RECOMMENDATION FOR ANY SECURITY. Trading in such securities can result in immediate and substantial losses of the capital invested. You should only invest risk capital, and not capital required for other purposes. You alone are solely responsible for determining whether any investment, security or strategy, or any other product or service, is appropriate or suitable for you based on your investment objectives and personal and financial situation. You should also consult an attorney or tax professional regarding your specific legal or tax situation. The Content is to be used for informational and entertainment purposes only and the Service does not provide investment advice for any individual. Stocktwits, its affiliates and partners specifically disclaim any and all liability or loss arising out of any action taken in reliance on Content, including but not limited to market value or other loss on the sale or purchase of any company, property, product, service, security, instrument, or any other matter. You understand that an investment in any security is subject to a number of risks, and that discussions of any security published on the Service will not contain a list or description of relevant risk factors. In addition, please note that some of the stocks about which Content is published on the Service have a low market capitalization and/or insufficient public float. Such stocks are subject to more risk than stocks of larger companies, including greater volatility, lower liquidity and less publicly available information. Read the full terms & conditions here. 🔍
Author Disclosure: The author of this newsletter holds positions in AVAX, ADA, PUDGY, WLD, NEAR, INJ, LTC, LINK, ZEC, XLM, and FET. 📋