
Stress Readings This Bad Used to Require An Exchange Imploding. Now We Do It Organically 🤷

OVERVIEW
Stress Readings This Bad Used to Require An Exchange Imploding. Now We Do It Organically 🤷

Before we dive in, here’s today’s crypto market heatmap:
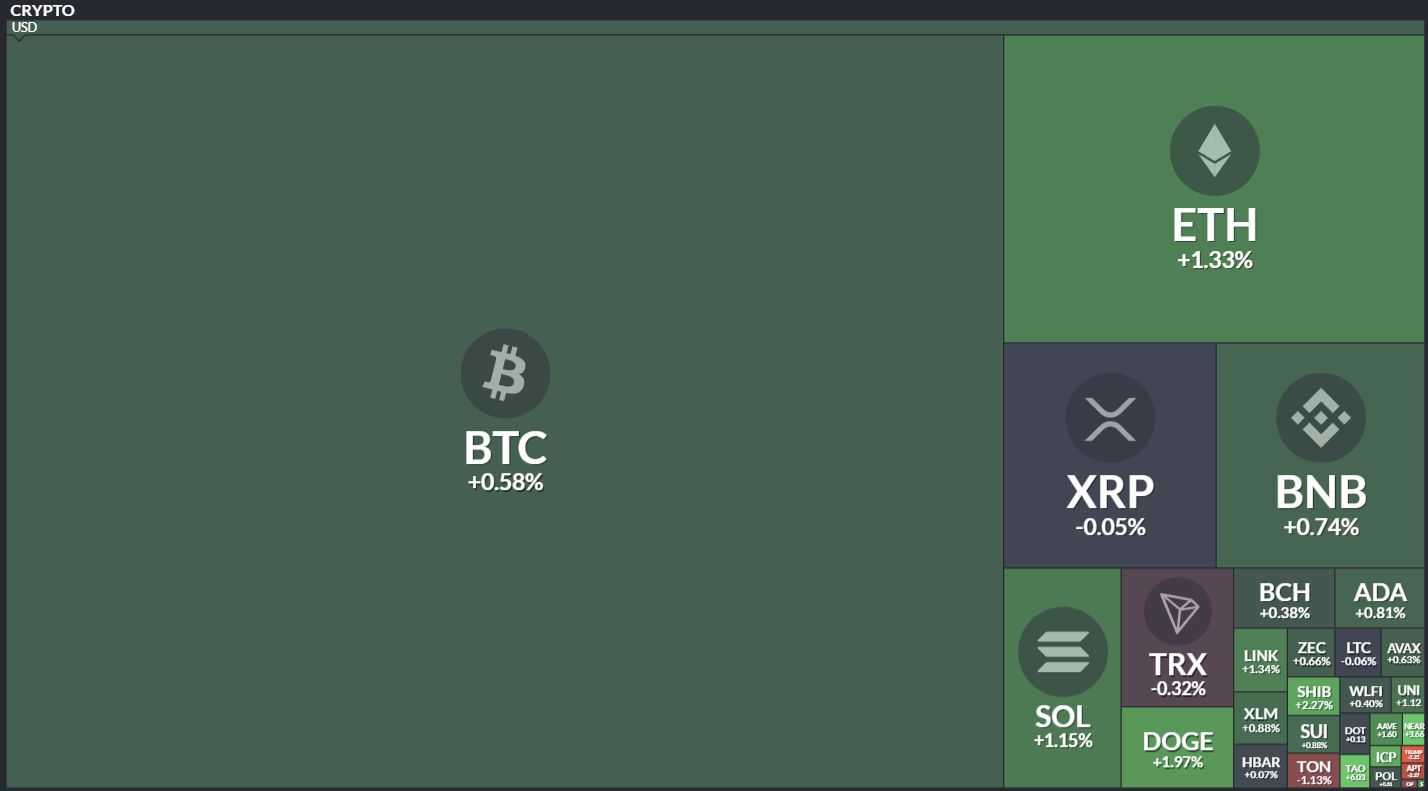
Source: finviz
And here’s a look at crypto’s total market and altcoin market cap charts:
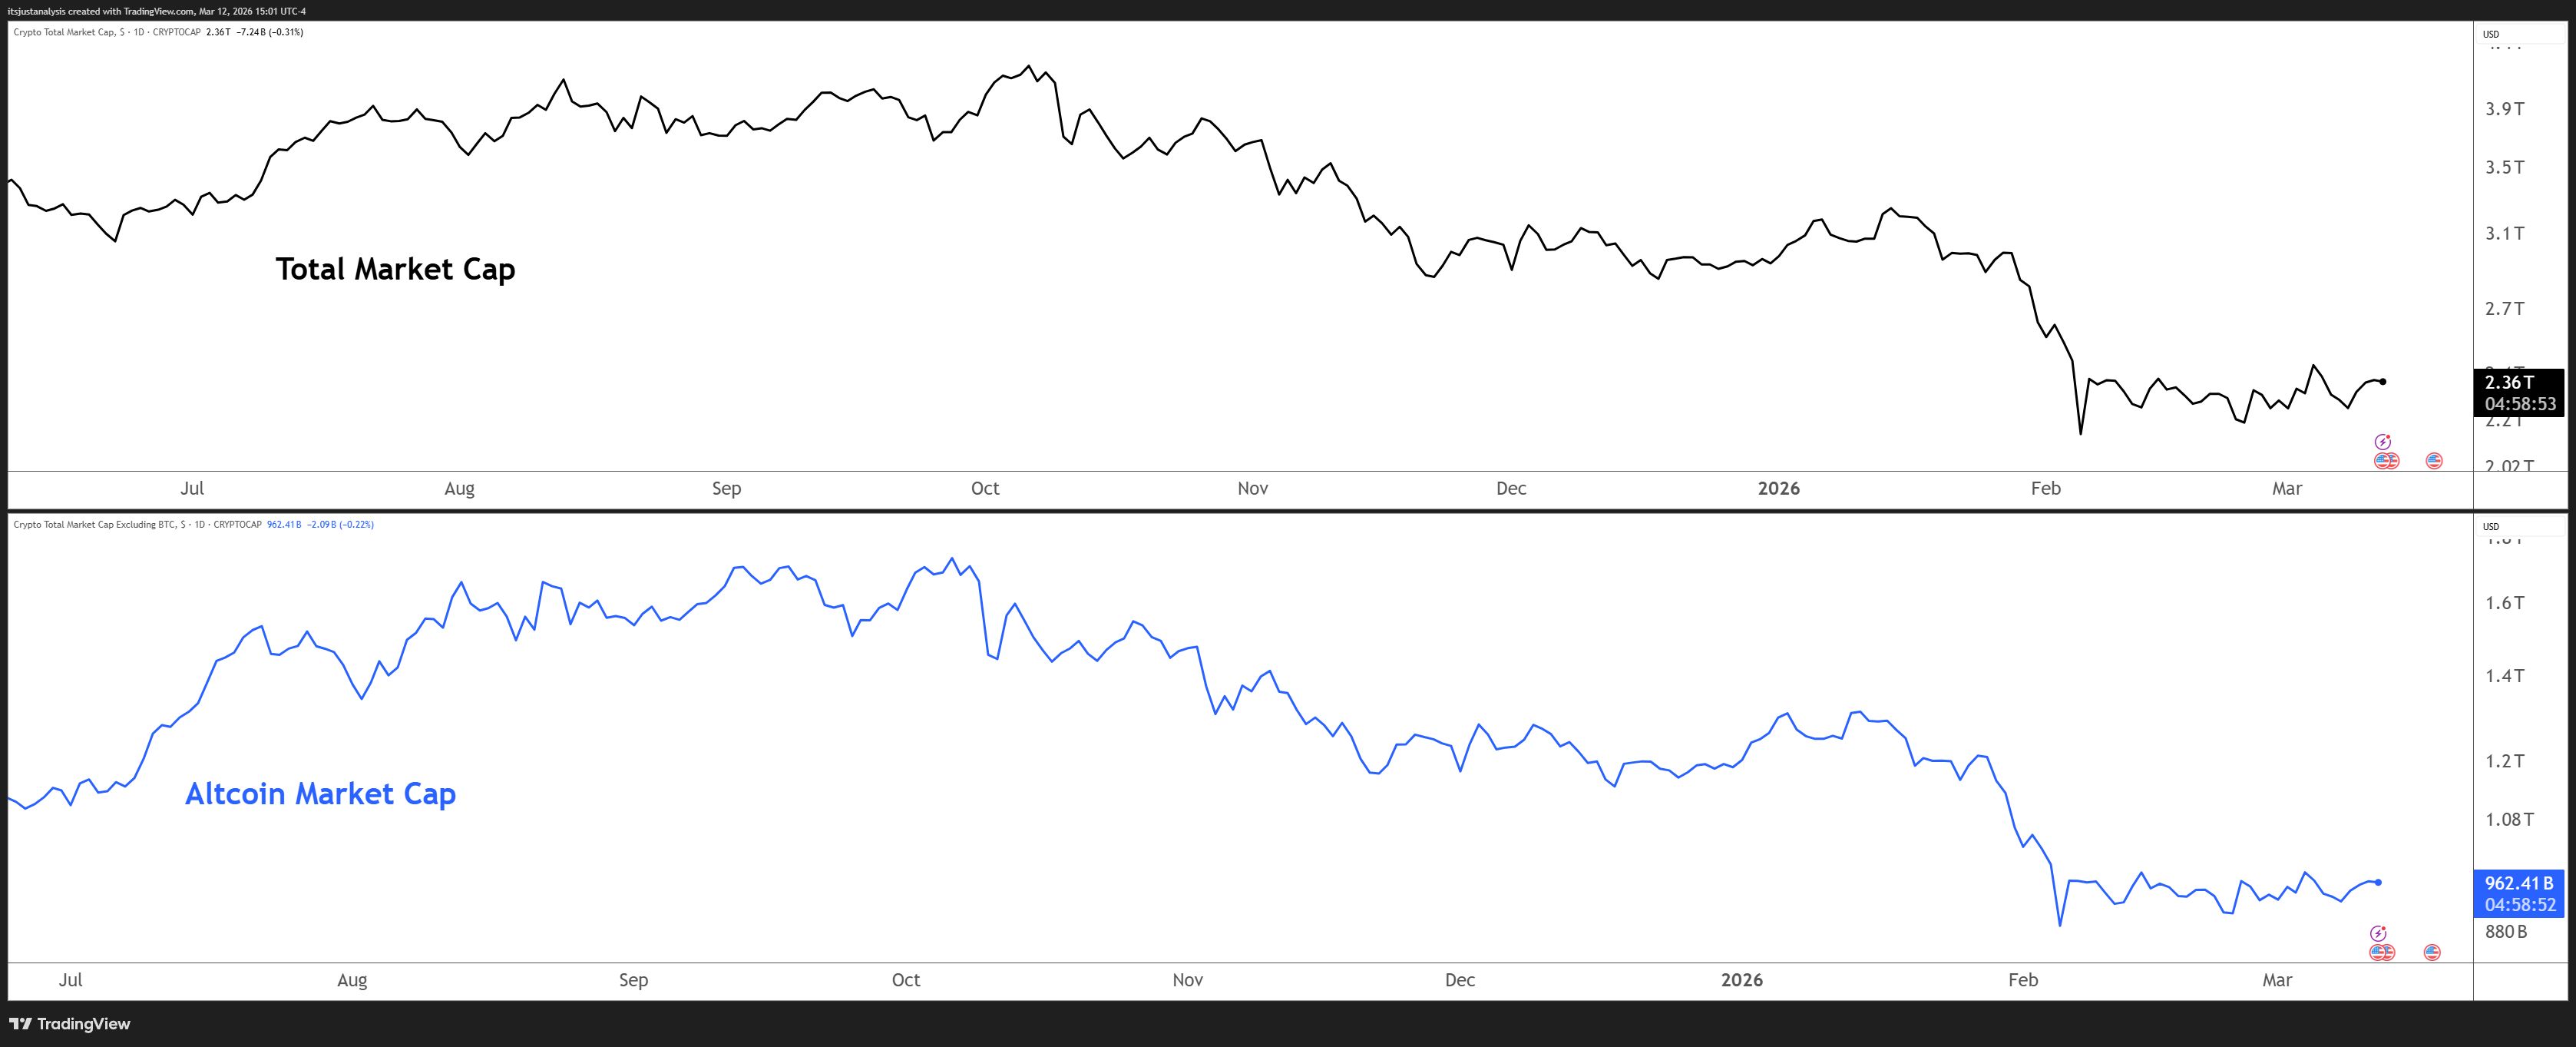
Source: TradingView
ON-CHAIN ANALYSIS
Super Special On-Chain Newsletter 🤯
I guess this isn’t really that super special. But it’s all on-chain analysis – which is something ya’ll ask for a lot, so I get super pumped whenever I get an opportunity to do it. 📆
Today’s is super special because we’re looking at the MVRV – but not just any MVRV, this is a custom MVRV that combined the 180 day, 90 day, and 60 day MVRV ratios into a single. Mind blown.
This combined MVRV is basically a mid-term profitability gauge. Nothing mystical about it really. Just a clean way to summarize how the active part of the market is doing without dragging ancient wallets into the conversation.
-
The 60-day MVRV catches recent buyers and momentum traders – the group most likely to panic or front-run.
-
The 90-day MVRV picks up established trend participants, the medium-term capital that tends to move with conviction.
-
The 180-day MVRV covers earlier cycle buyers and larger positioning- the cohort sitting on meaningful unrealized gains and deciding whether to distribute.
Average them out and you get a single question answered: how profitable is the capital that actually entered the market over the last two to six months? That’s the group driving most of the movement.
And for those who care: they are equally weighted. It keeps the 180-day window from drowning out the shorter-term signal, which is a real problem if you run a single MVRV in isolation. Averaging three windows also smooths out the noise without burying the trend.
The interpretation stays the same regardless of which asset you’re looking at:
-
Above 1.0 – active participants are in profit. Profit-taking pressure exists and rises the further above 1 you go.
-
Near 1.0 – the active market is roughly at breakeven. Neutral. Wait and see.
-
Below 1.0 – recent buyers are underwater. That’s either capitulation or accumulation depending on what else is happening. Sometimes both at once.
The 60-to-180-day band keeps the focus on the people most likely to do something with their position right now. 🧠
SPONSORED
1,000+ Proven ChatGPT Prompts That Help You Work 10X Faster

ChatGPT is insanely powerful.
But most people waste 90% of its potential by using it like Google.
These 1,000+ proven ChatGPT prompts fix that and help you work 10X faster.
Sign up for Superhuman AI and get:
-
1,000+ ready-to-use prompts to solve problems in minutes instead of hours—tested & used by 1M+ professionals
-
Superhuman AI newsletter (3 min daily) so you keep learning new AI tools & tutorials to stay ahead in your career—the prompts are just the beginning
ON-CHAIN ANALYSIS
Five Months Since Anyone Buying Bitcoin Was Broadly Profitable 5️⃣
Mid-term profitability gauge for the active market. No coin bought before six months ago gets a vote. ✅
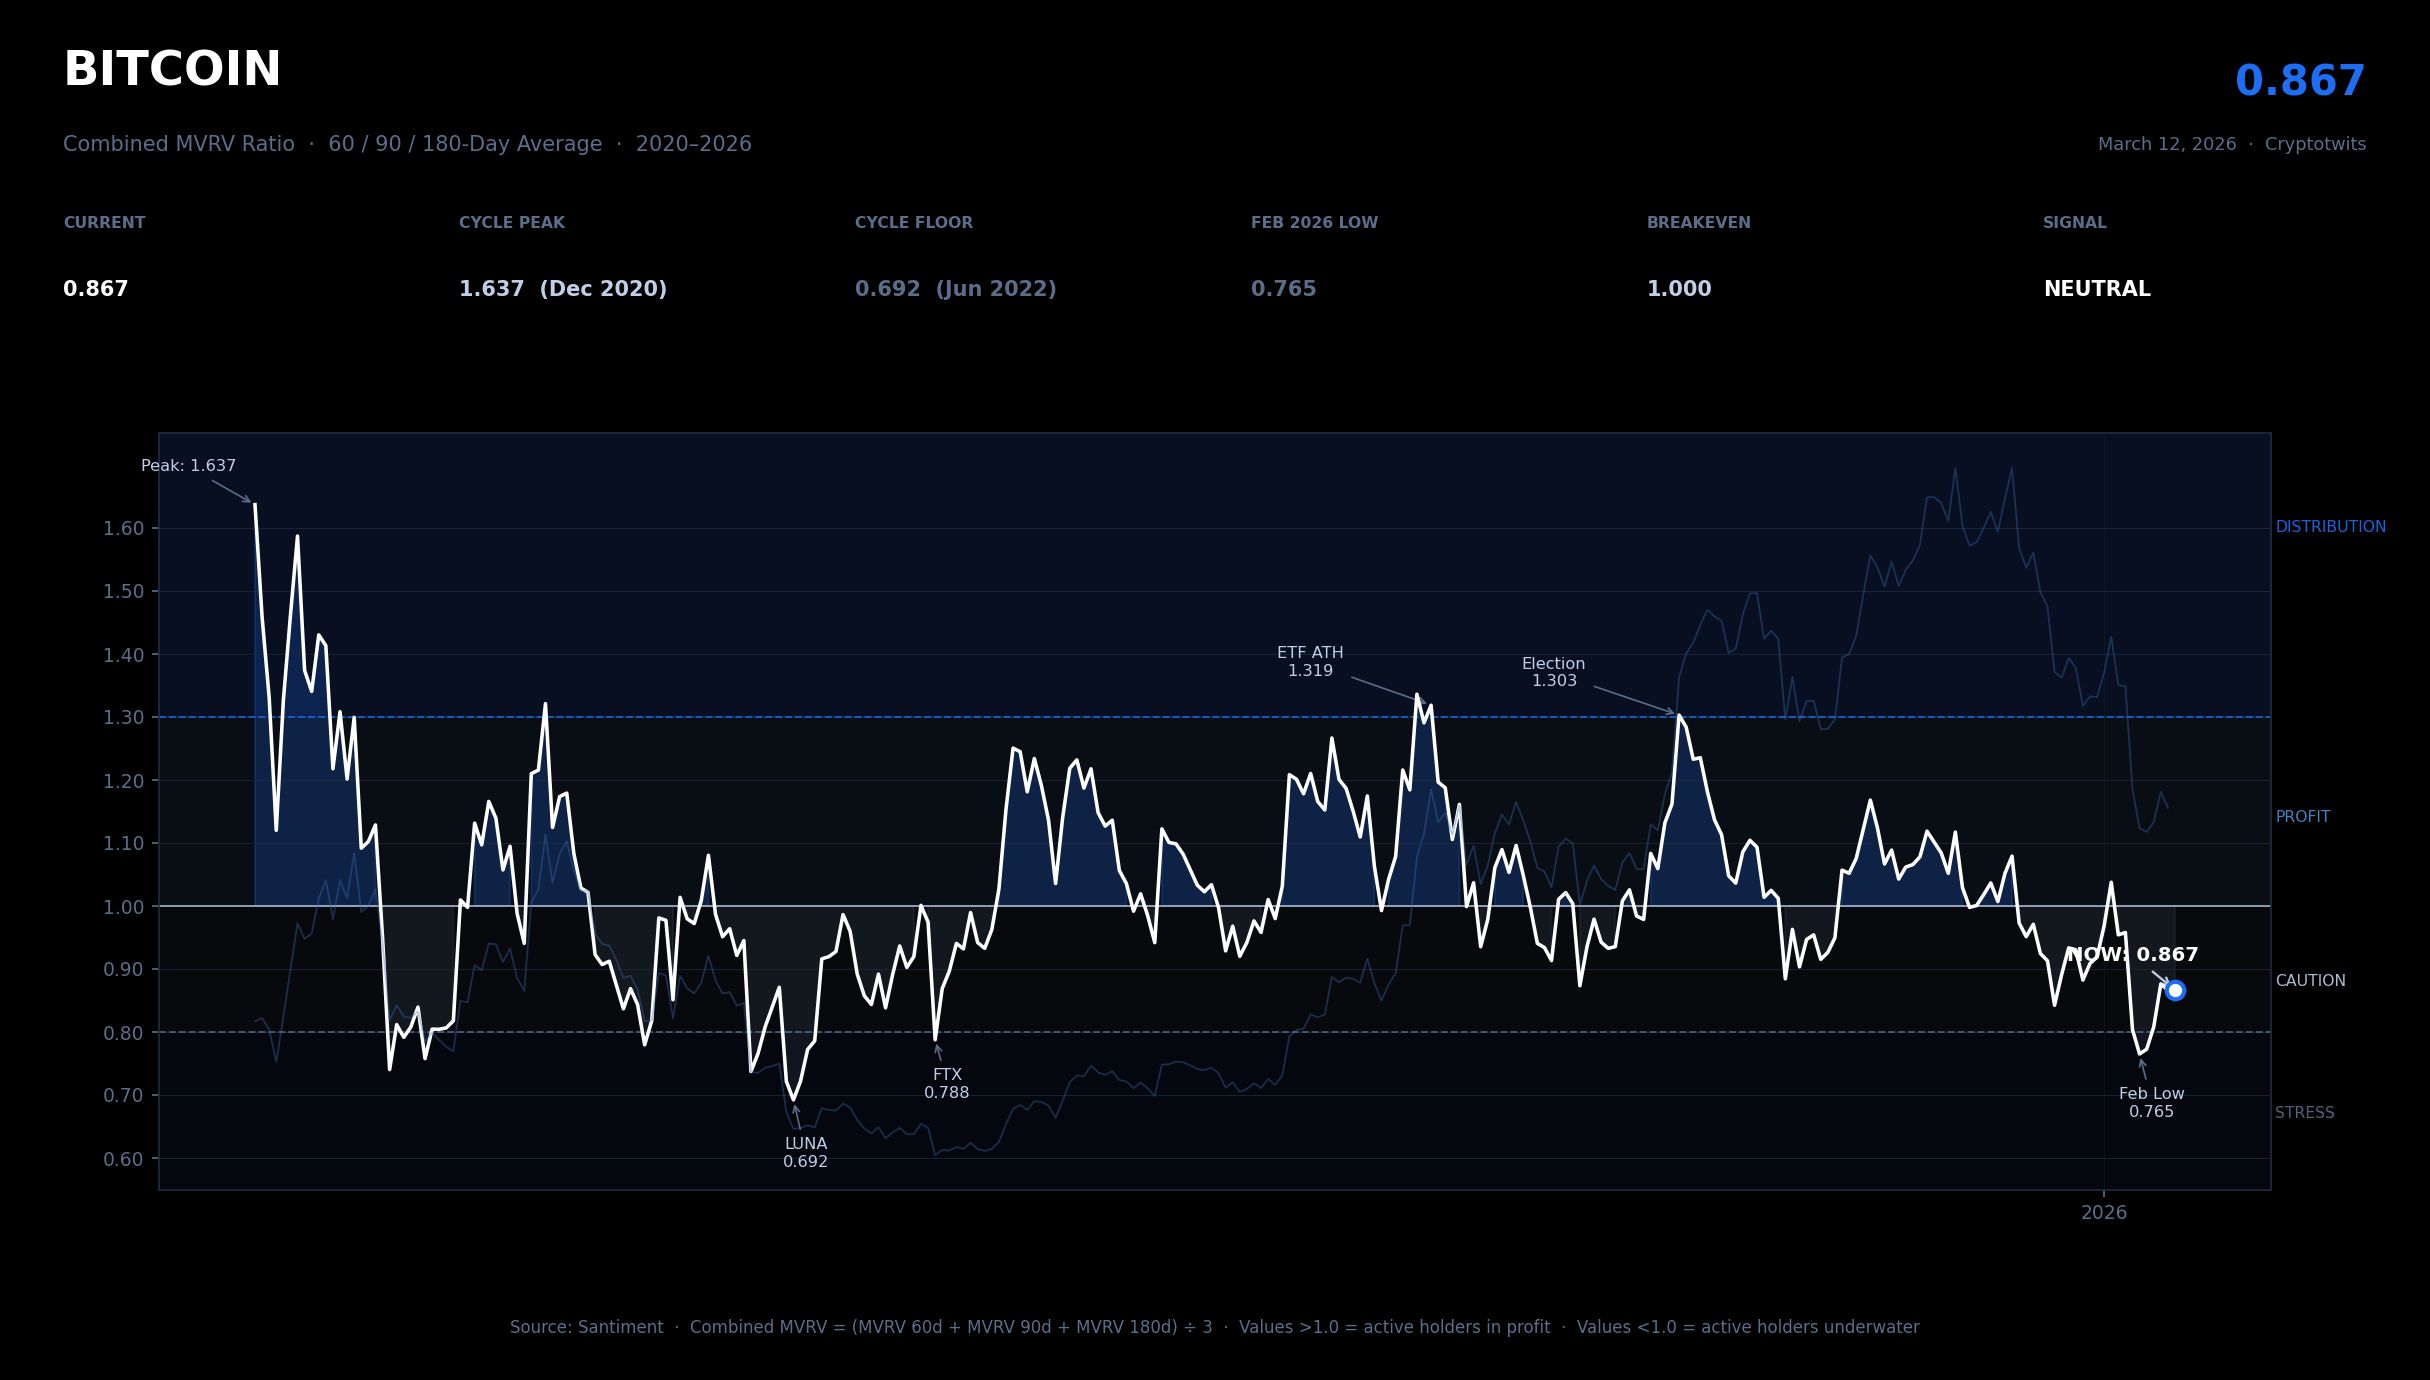
Click to enlarge.
Current read: 0.867. That means the average recent buyer is underwater. Not catastrophically, still but underwater.
In 272 weeks of data, this composite has only printed below 0.80 fourteen times. Twelve of those were during the LUNA implosion (0.692 floor at $19,987) and the FTX crater (0.787 at $15,881). The other two? February 5th and 12th of this year, at $66,993 and $66,416.
This is kind of a theme, but Bitcoin printed the same on-chain stress levels it posted during some of the ugliest weeks of the 2022 bear market – at three times the price. The active market took real damage this cycle.
The composite bounced. It’s been parked in the 0.85-0.92 corridor for three weeks now. That’s historically a zone that goes one of two ways: base-building that eventually reclaims 1.0, or a dead-cat bounce before the next leg lower. The data alone can’t tell you which.
What it can tell you: the 1.30+ zone – where distribution has historically lived – printed its last reading in November 2024 at $90,574. Everything since then has been compression and decline.
The active market has not been broadly profitable since the post-election spike. Five months of deteriorating conditions beneath the surface while price held up well enough to keep the conversation civil.
The level to watch is 1.0. That’s the line separating “recovery” from “still in trouble.” At 0.867, we’re not there yet.
Lean: Neutral. 🫓
CRYPTOTWITS
Something Fun: VeChain’s Origin Story Involves A World of Warcraft Scam📔
The upside of checking, daily, 230+ official X, blog, and news pages of the many crypto tickers out there is sometimes you come across a story that isn’t really ‘big’.
And this one is cool.
ON-CHAIN ANALYSIS
Ethereum Just Logged Its Second-Worst On-Chain Stress Reading in Five Years 📉
ETH’s MVRV at 0.771 is deep in the stress corridor, and it’s been there for a while. ⌛️
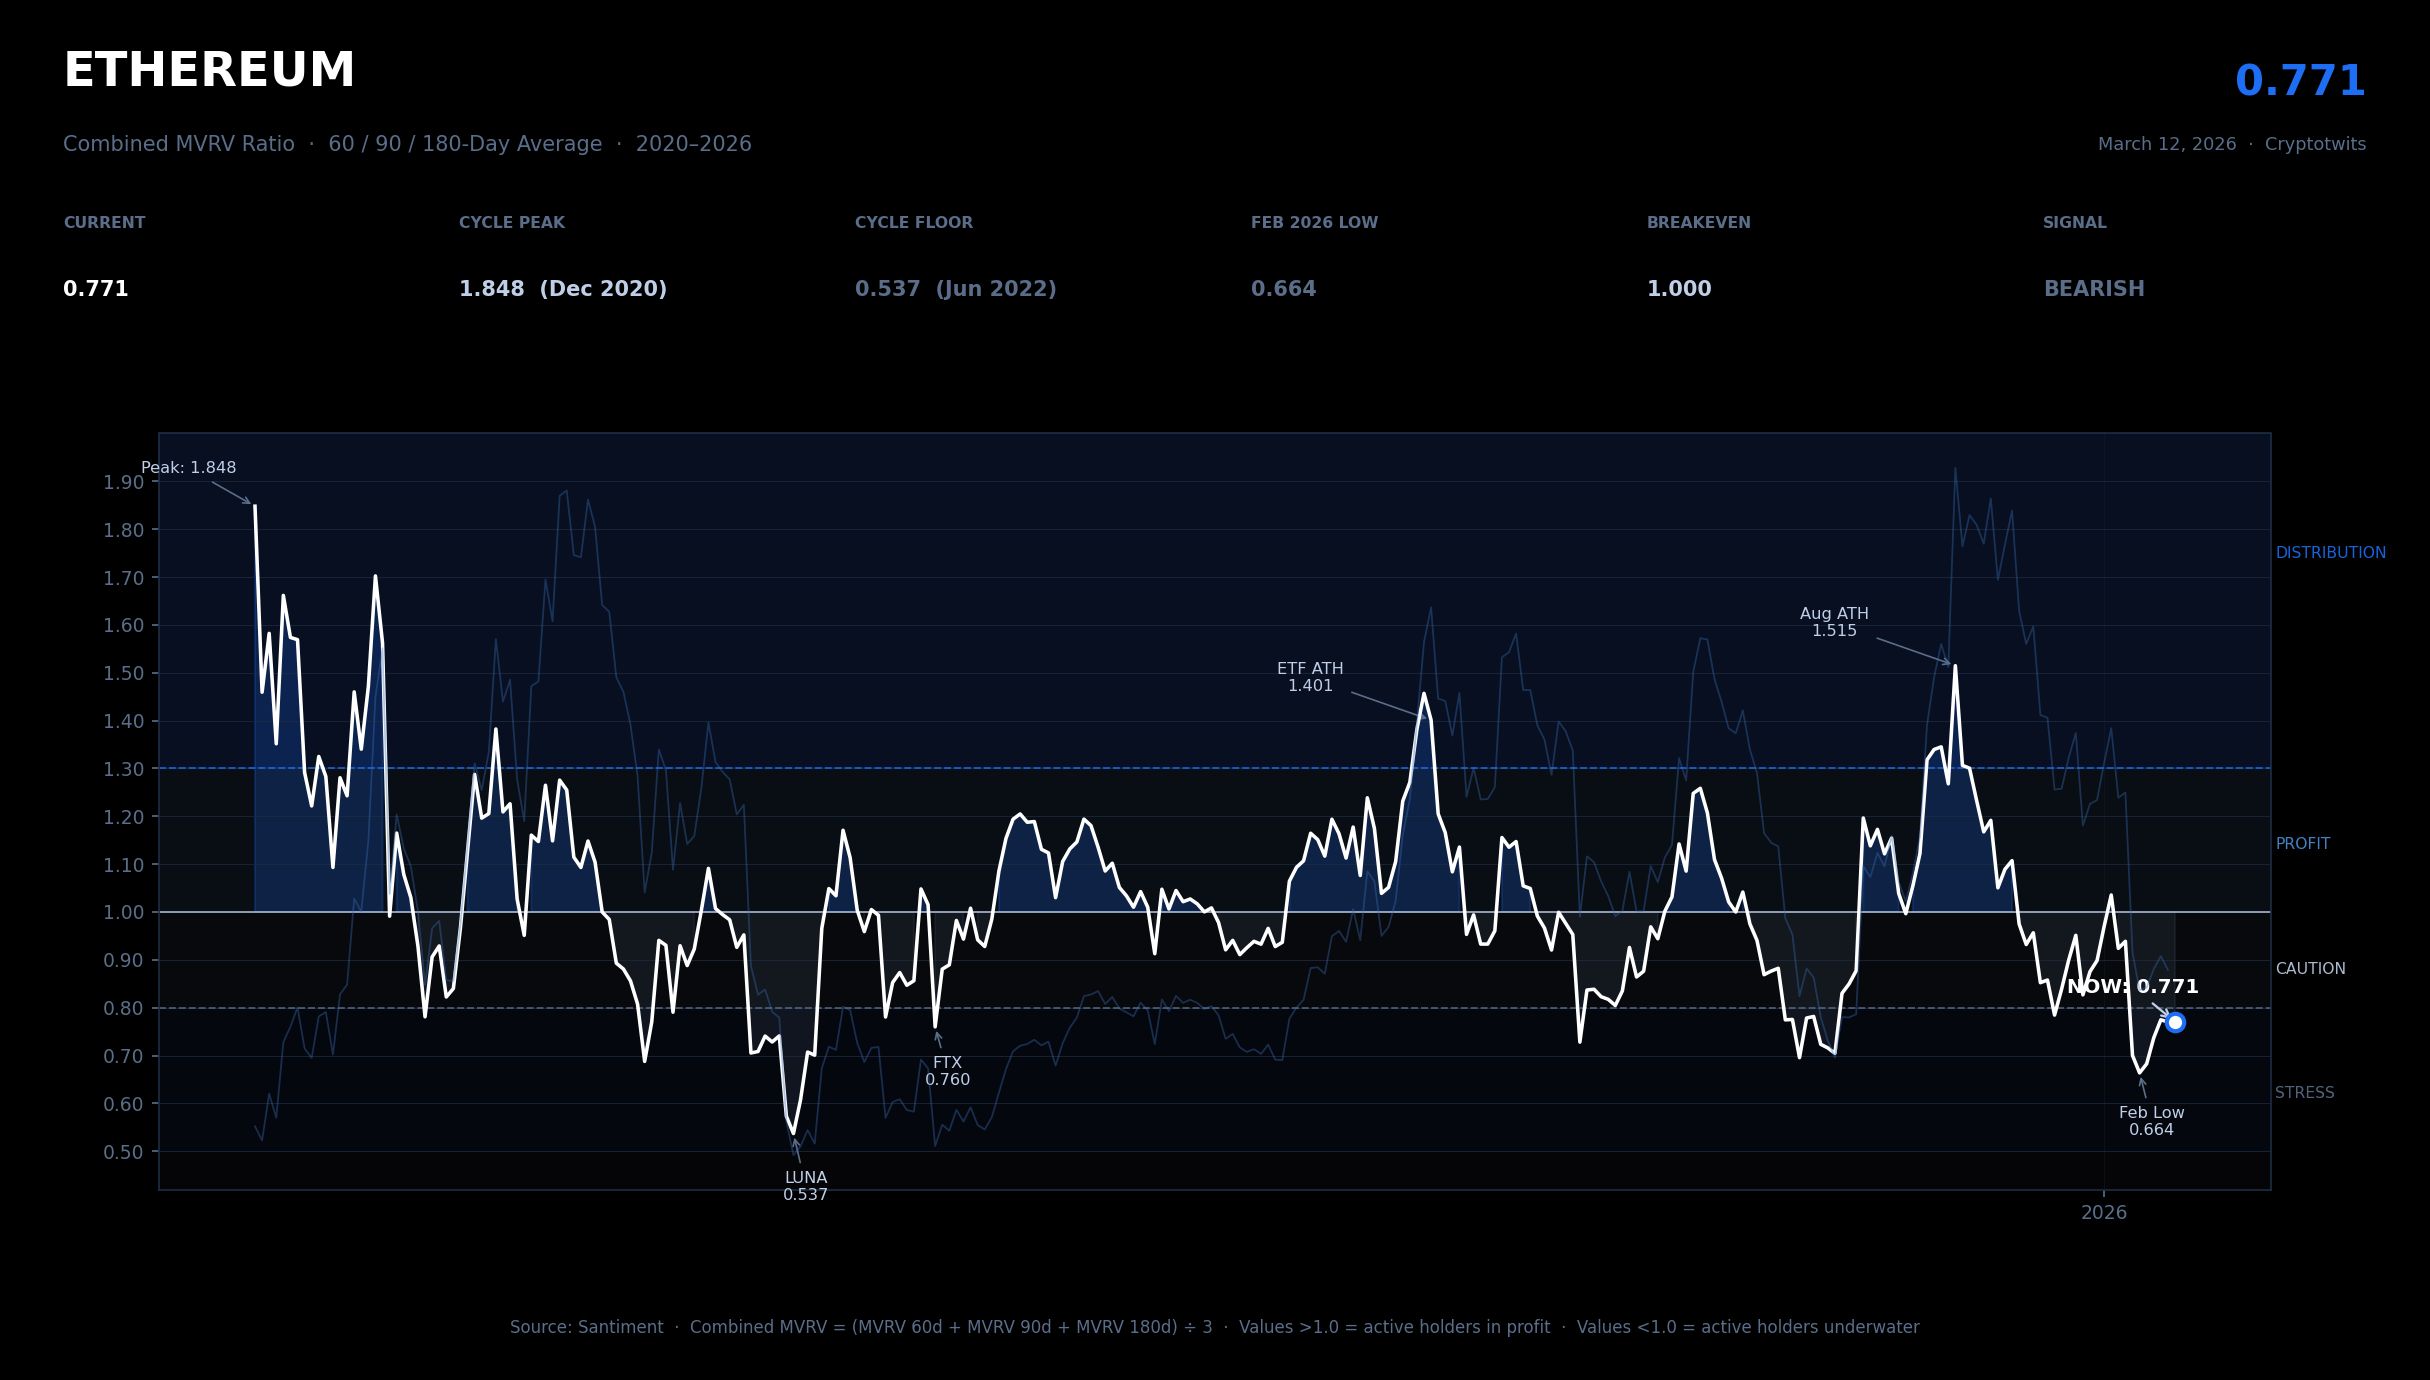
Click to enlarge.
Thirty-three weeks in this dataset have printed sub-0.80. Sixteen of them are from 2025 and 2026. ETH has logged nearly half of its entire historical distress readings in the last fourteen months.
The February low hit 0.664 on the 5th at $1,941. For context, the only time this composite printed lower in five-plus years of data was the LUNA collapse in June 2022, which bottomed at 0.537 at $1,051. ETH managed to replicate the second-worst stress episode in its on-chain history at roughly double the price.
On August 7th, 2025, the MVRV composite hit 1.515 at $4,758. That was the last time ETH’s active holders were broadly profitable. Everything since then has been one-way compression: six months of relentless deterioration that took this metric from cycle highs straight through breakeven, through the caution zone, and into stress territory without a meaningful bounce.
Right now, 0.771 is sitting roughly where BTC was at its February floor – except BTC has since recovered to 0.867. ETH hasn’t. It bounced off 0.664, stalled in the 0.77 range, and has gone nowhere for three weeks.
Lean: Bearish. 🐻
SPONSORED
Live From the New York Stock Exchange, it’s the 2026 Cashtag Awards Presented by Polymarket!! 🏛️

The biggest night in finance just got an upgrade.
On May 4th, Stocktwits is heading to the New York Stock Exchange to host the 2026 Cashtag Awards Presented by Polymarket. We’re honoring the creators, stocks, and innovators that defined the last year of trading.
This isn’t a “suit and tie” industry gala: this is powered by the 10 million+ investors who make the Stocktwits community the heartbeat of the market. From “Cashtag of the Year” to the “Best Retail IR Team,” the winners are chosen by you.
Nominations are officially OPEN. It’s time to give credit where it’s due and secure your spot at the most exclusive event in retail investing.
TLDR : 🏆 The 2026 Cashtag Awards Presented by Polymarket are live! We’re taking over the NYSE on May 4th. Nominations are open now
A Special Thanks to Our Partners: Polymarket, Zenatech,Tradier, Voyager, Tradr ETFs, Fintech TV
*3rd Party Ad. Not an offer or recommendation by Stocktwits. See disclosure here.
ON-CHAIN ANALYSIS
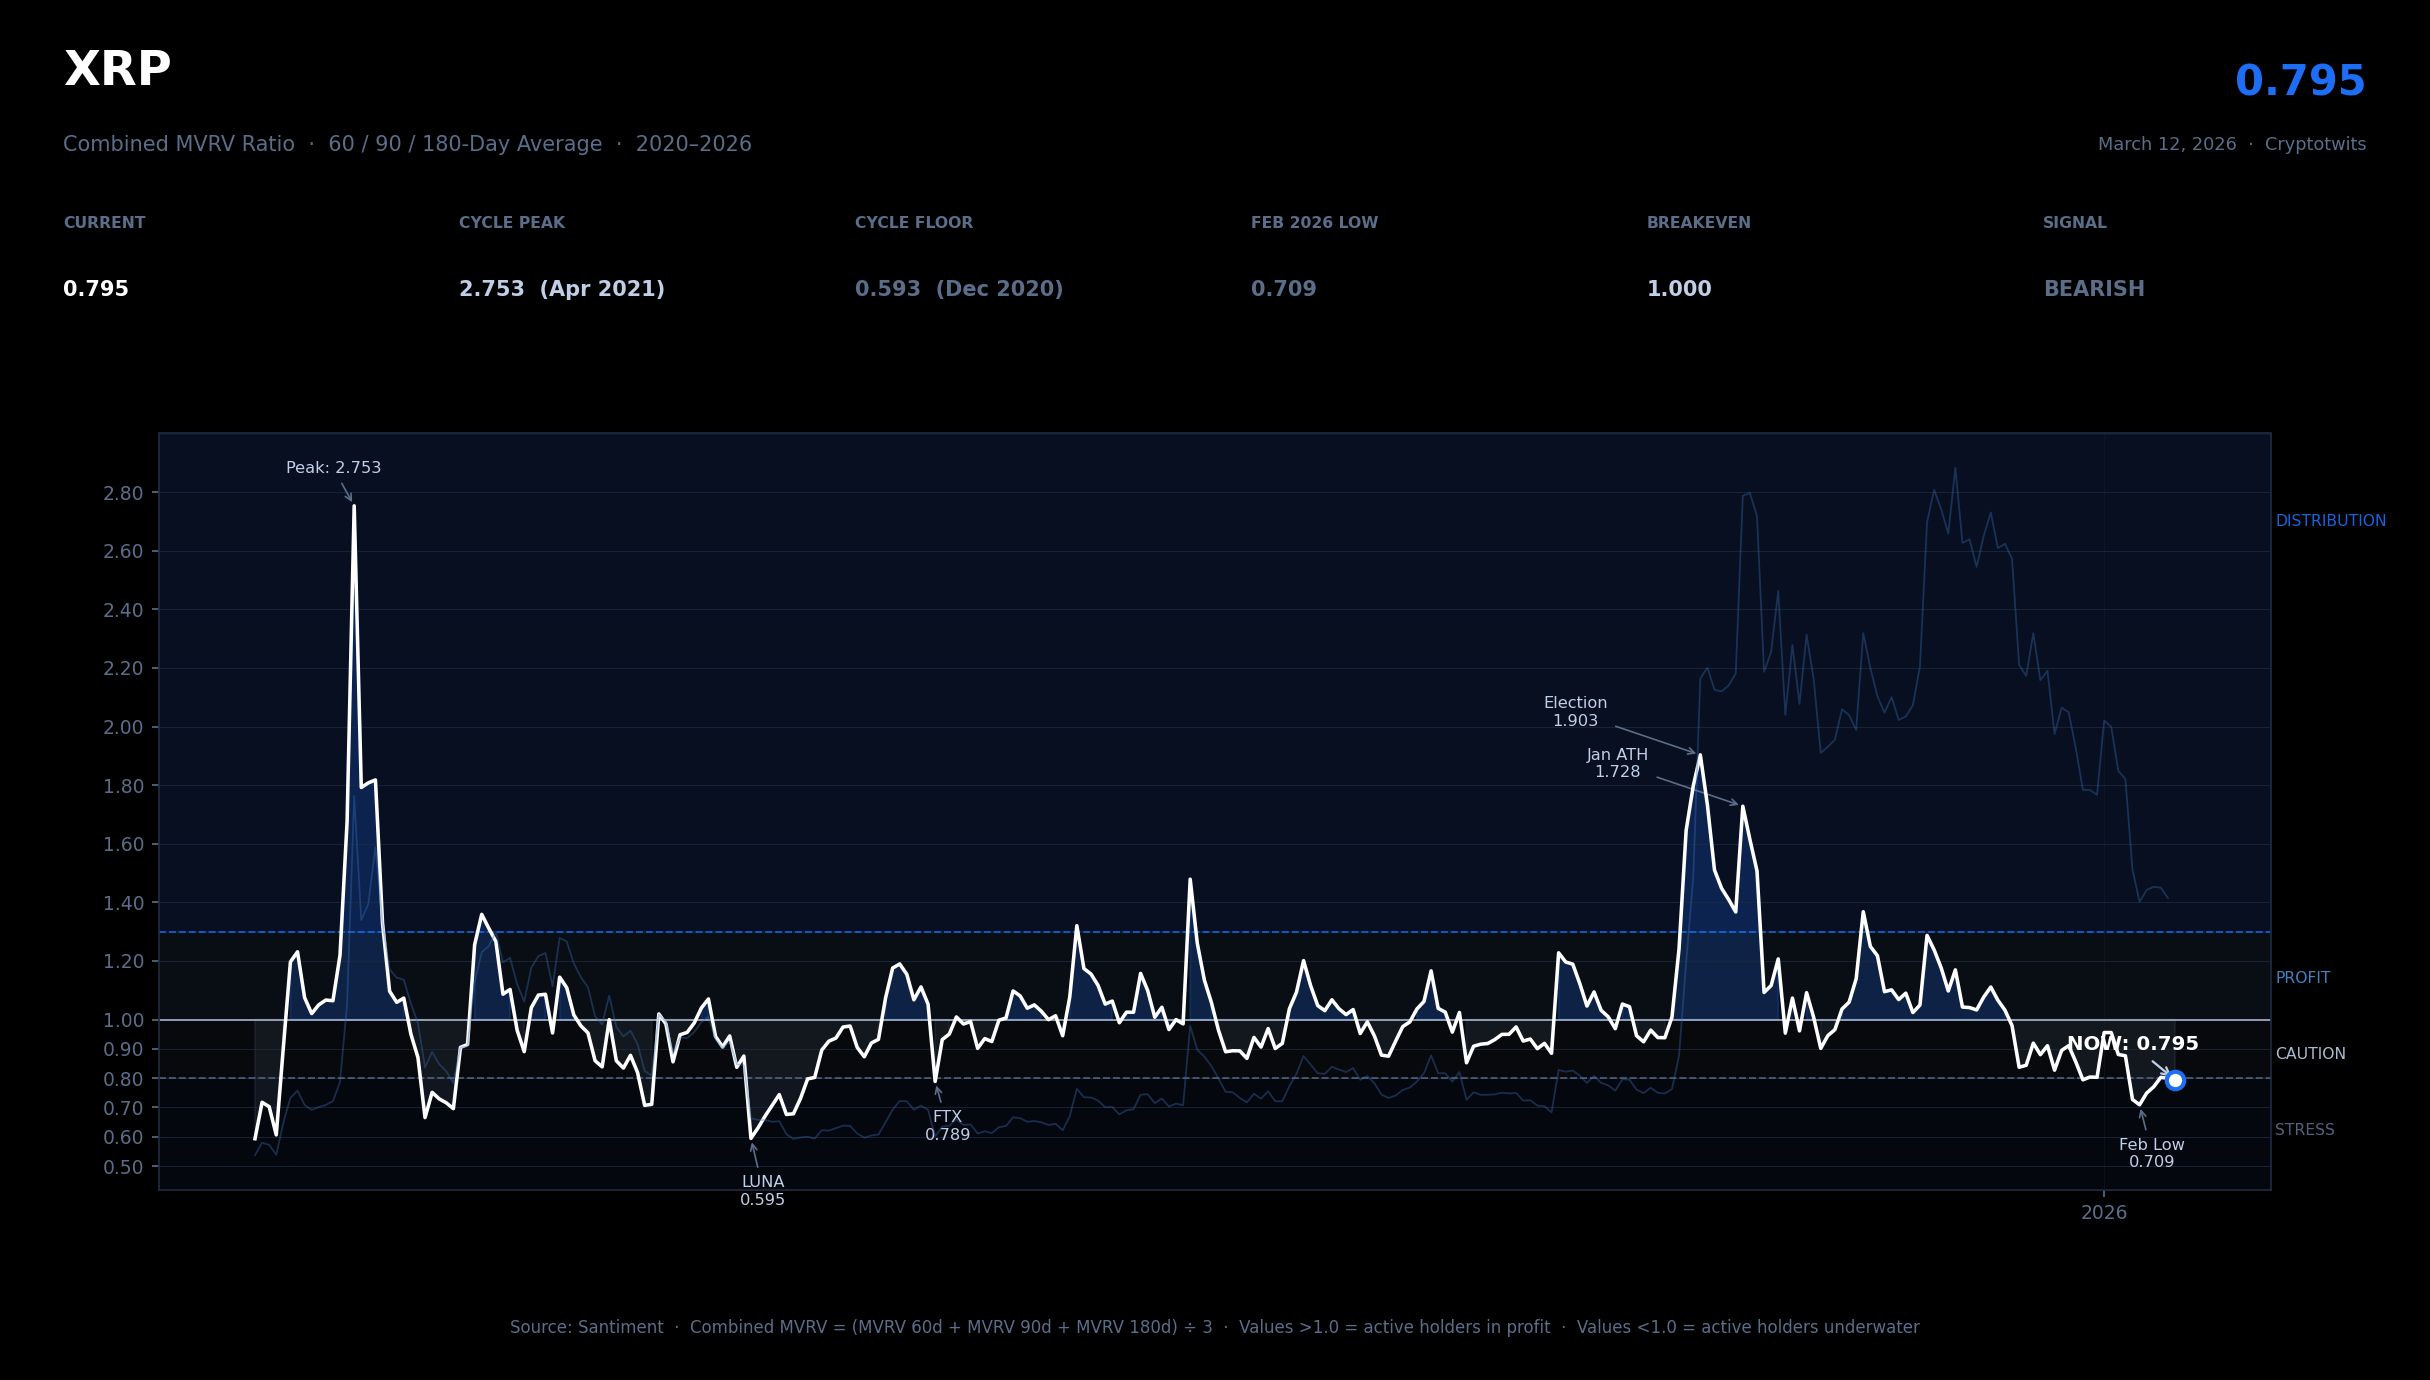
XRP Spends More Time Below 1.0 Than Above It 😶
XRP’s combined MVRV peaked at 2.753 in April 2021. Not 1.6, not 1.8 – 2.753. 😲
Click to enlarge.
It reflects exactly what XRP does when it moves: it moves violently, in both directions, and the active market gets deeply, uniformly profitable before it rolls. Then it gives it all back.
It’s doing the giving back part right now.
The post-election run was real. The composite hit 1.903 at $2.35 in late November and kept climbing into January, peaking at 1.728 at $3.16. That was the last time XRP’s active participants were mostly in the money.
Everything since then has been a one-way compression that’s erased the entire profitability structure built during the rally. In fourteen weeks, the composite went from 1.728 to a February low of 0.709 at $1.37.
Current reading is 0.795. Three of the last four weeks have printed between 0.770 and 0.800. The market bounced off the worst of it and then went flat.
Not so fun fact: XRP has spent 51% of this entire dataset below 1.0. The active market being underwater is normal for this asset. What’s not normal is the speed at which it went from 1.728 to here.
Reclaiming 0.80 with conviction is the first step. There’s a long road to 1.0 from here.
Lean: Bearish. 🐻
ON-CHAIN ANALYSIS
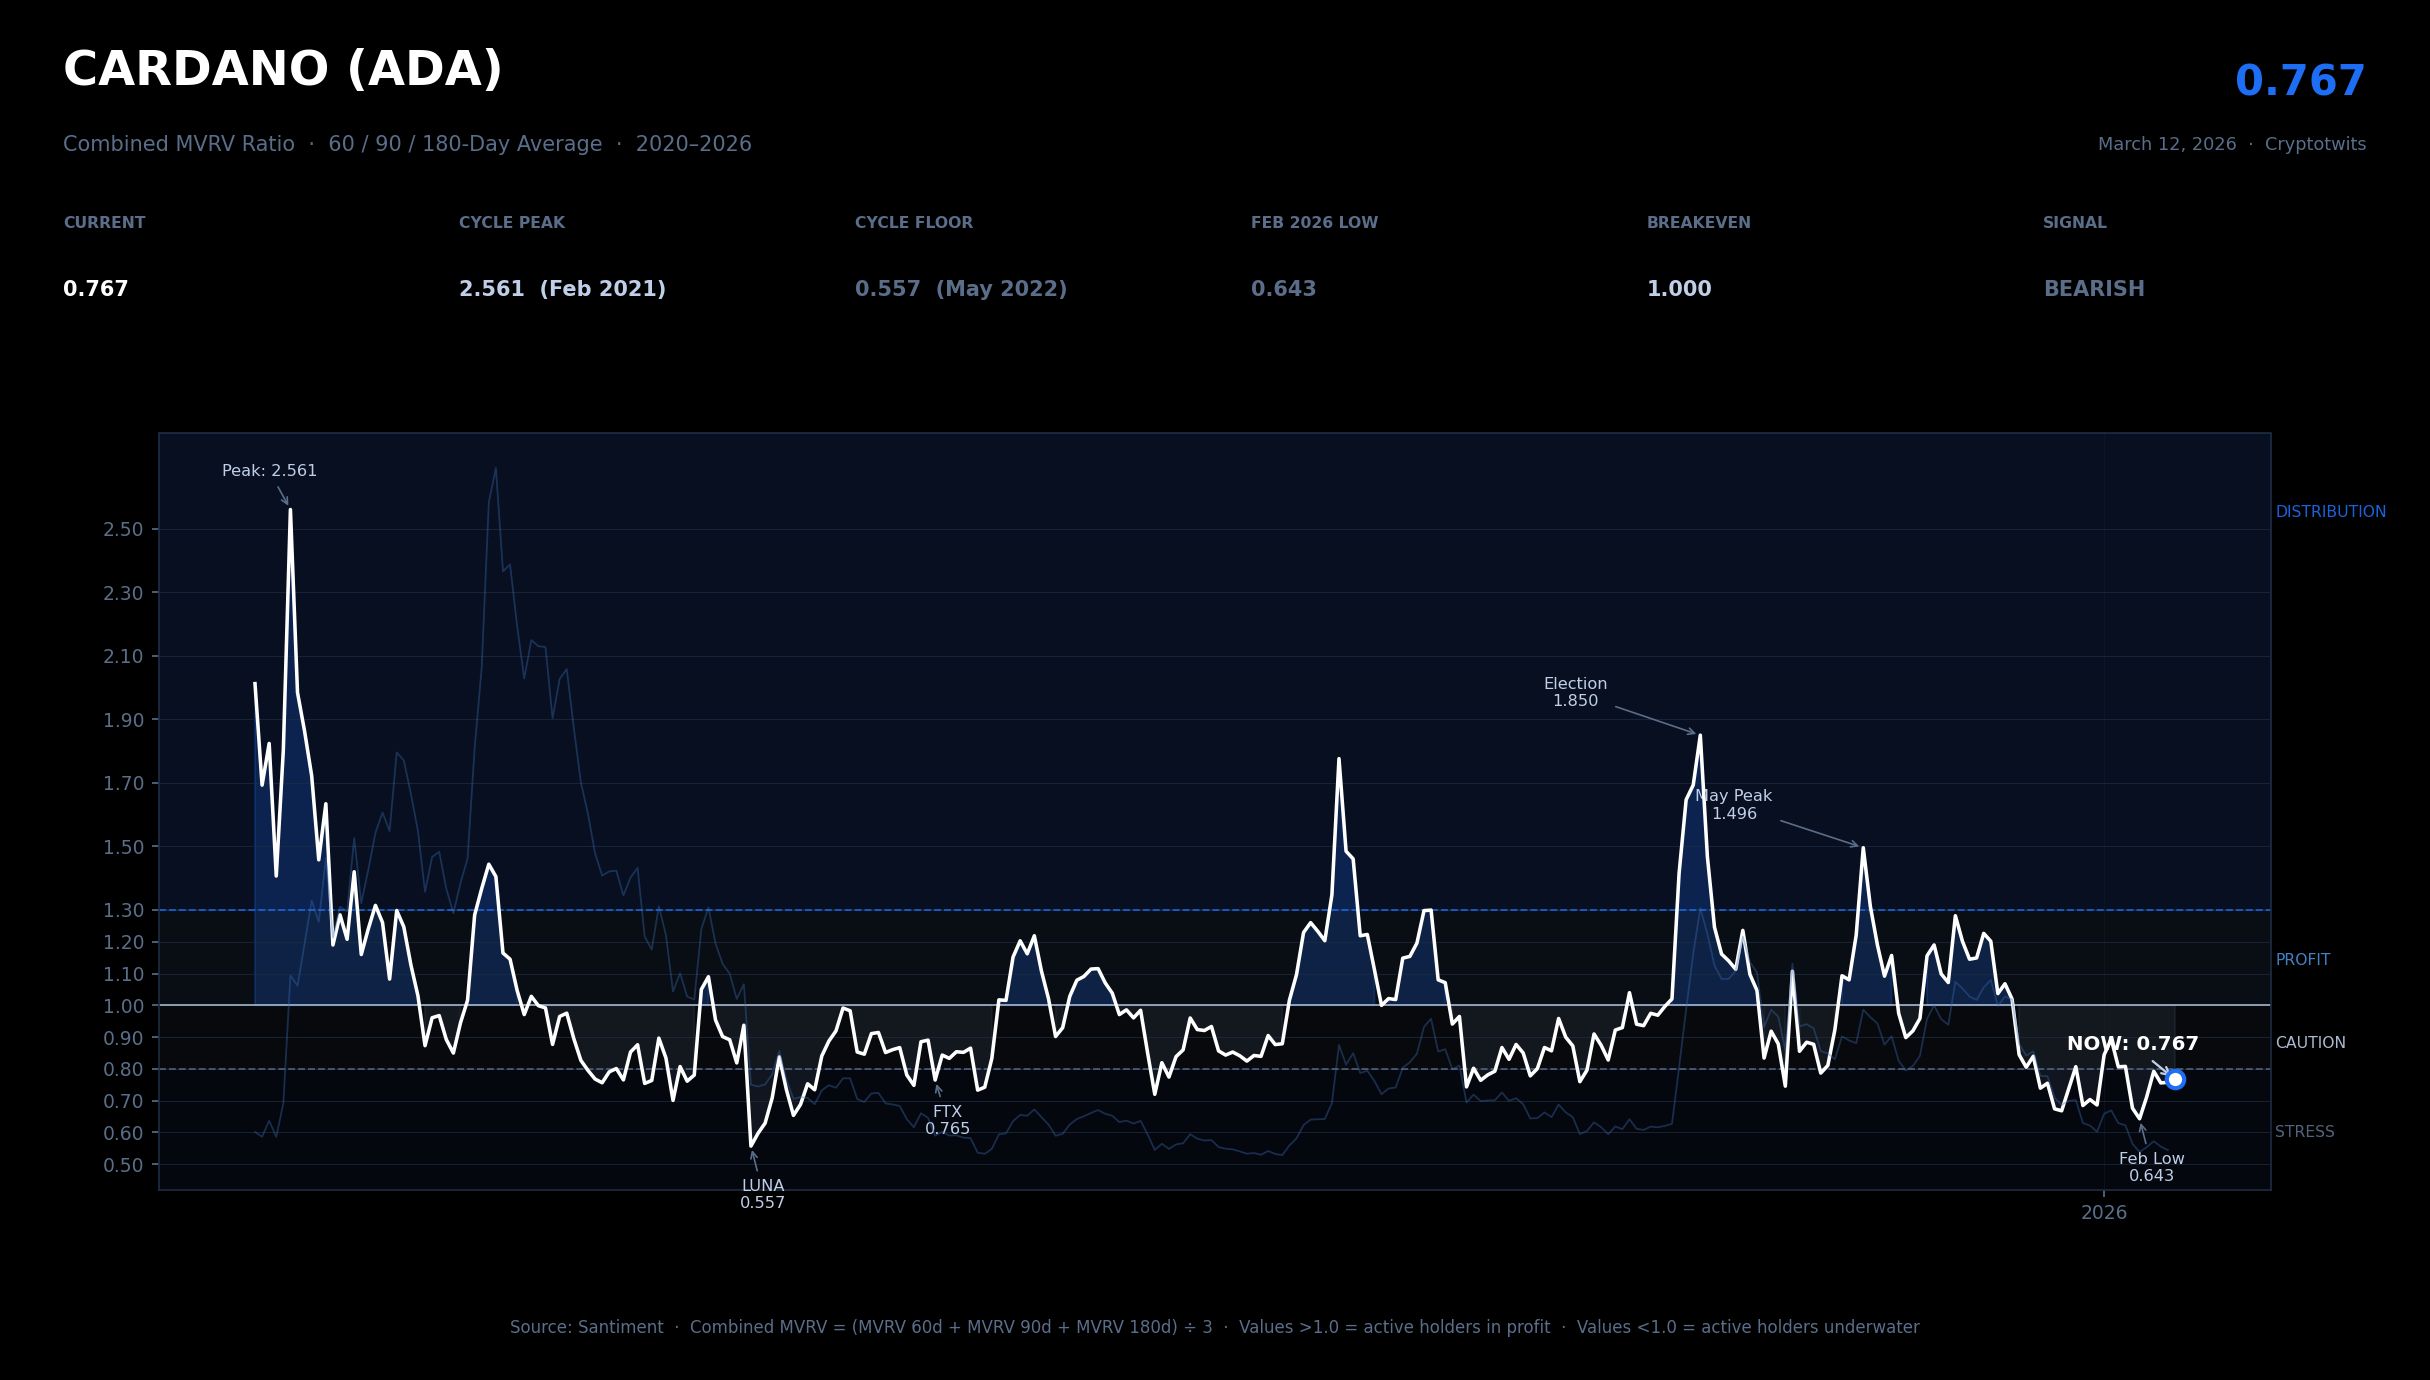
ADA Has Spent 60% Of The Last Five Years With Active Holders Underwater 🙄
One number before the analysis: 60.3%. 👀
Click to enlarge.
That’s how much of the last five-plus years ADA has spent with its active holders underwater. Not Bitcoin’s 46%. Not Ethereum’s 46%. Sixty percent. The base condition for ADA’s active market is being unprofitable.
Current reading is 0.767, and the February low was 0.643 at $0.2556. That’s the second-worst reading in this entire dataset – the only worse stretch was the LUNA collapse in May 2022, which bottomed at 0.557 at $0.51.
The composite MVRV peaked at 1.850 in late November 2024 at $1.19 on post-election momentum. It briefly recovered to 1.496 in May 2025 – the last time ADA’s active market was in any form profitable. Since then it’s been a nine-month, essentially uninterrupted grind into the stress zone.
The bounce off the February floor has been feeble. ADA went from 0.643 to a high of 0.792 and has since drifted back to 0.767. That’s a smaller recovery than XRP managed, and XRP’s recovery already stalled out.
ADA is also trading near $0.26 – prices last seen in early 2023, before the pre-halving rally even started.
One important note on ADA specifically: epoch-based staking reward distributions on Cardano can create noise in MDIA readings, so this analysis leans on the MVRV composite more heavily than dormancy-based signals.
Lean: Bearish. 🐻❄️
STOCKTWITS
Latest Stocktwits Podcasts & Videos 😱
The Latest Cryptotwits Podcast – Securitize Founder Carlos Domingo: Tokenizing Real Assets, BlackRock BUIDL, and Going Public
The Howard Lindzon Show – Anthropic’s “Quadruple Lindy” + Why SoftBank Tells a Different OpenAI Story
Talking Tickers – We Analyze Retail Favorites: Is Zooks/Kuiper or Reddit’s Ad Revenue More Exciting?
Boardroom Exclusives – D-Wave CEO: Record 2026 Bookings + The Quantum Circuits Acquisition Changes Everything
True Odds Podcast – Max Crosby to the Bears? + Team USA’s WBC Nightmare
Get In Touch 📬
Email me, Jonathan Morgan, feedback; I’d love to hear from you. 📧
Follow me on Stocktwits 🫂 And Sponsor this newsletter 😎
Terms & Conditions 📝
Securities Disclaimer: STOCKTWITS IS NOT A TAX ADVISOR, BROKER, FINANCIAL ADVISOR OR INVESTMENT ADVISOR. THE SERVICE IS NOT INTENDED TO PROVIDE TAX, LEGAL, FINANCIAL OR INVESTMENT ADVICE, AND NOTHING ON THE SERVICE SHOULD BE CONSTRUED AS AN OFFER TO SELL, A SOLICITATION OF AN OFFER TO BUY, OR A RECOMMENDATION FOR ANY SECURITY. Trading in such securities can result in immediate and substantial losses of the capital invested. You should only invest risk capital, and not capital required for other purposes. You alone are solely responsible for determining whether any investment, security or strategy, or any other product or service, is appropriate or suitable for you based on your investment objectives and personal and financial situation. You should also consult an attorney or tax professional regarding your specific legal or tax situation. The Content is to be used for informational and entertainment purposes only and the Service does not provide investment advice for any individual. Stocktwits, its affiliates and partners specifically disclaim any and all liability or loss arising out of any action taken in reliance on Content, including but not limited to market value or other loss on the sale or purchase of any company, property, product, service, security, instrument, or any other matter. You understand that an investment in any security is subject to a number of risks, and that discussions of any security published on the Service will not contain a list or description of relevant risk factors. In addition, please note that some of the stocks about which Content is published on the Service have a low market capitalization and/or insufficient public float. Such stocks are subject to more risk than stocks of larger companies, including greater volatility, lower liquidity and less publicly available information. Read the full terms & conditions here. 🔍
Author Disclosure: The author of this newsletter holds positions in AVAX, ADA, PUDGY, WLC, IMX, XTZ, NEAR, HBAR, ALGO, INJ, LTC, LINK, ZEC, XLM, and FET. 📋


