✍️ Maverick Charts & Markets – March 2024 Edition #16
Dear all,
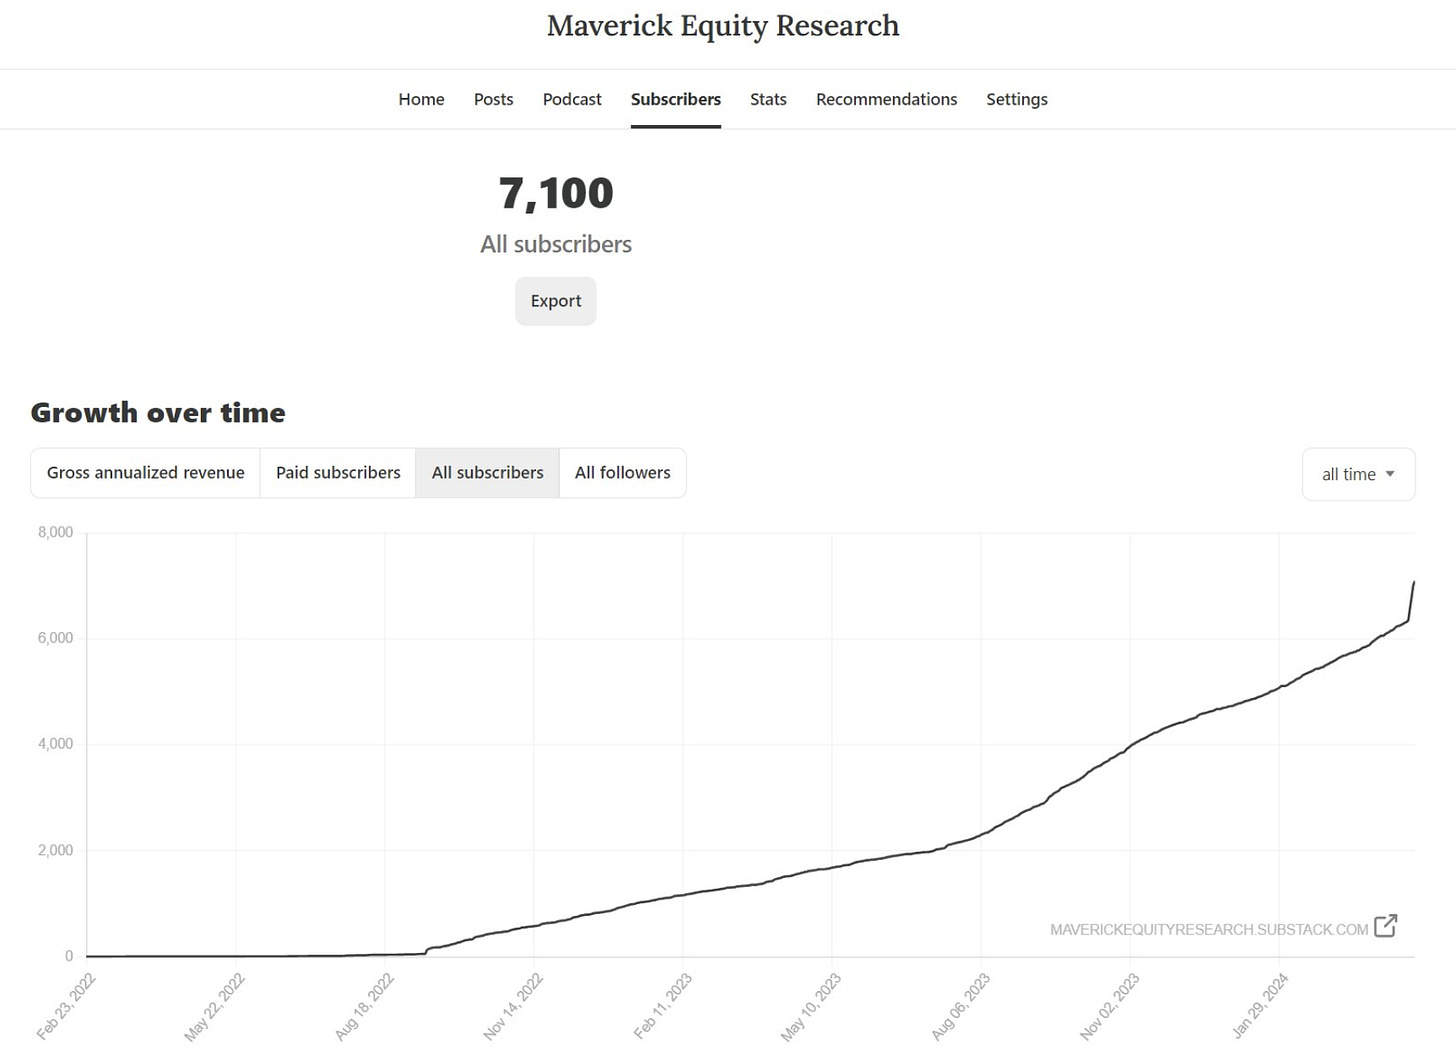
first of all, welcome to the 700+ new readers for a total of 7,100! The independent investment research here is now read across 145 countries and 50 US states! Enjoy!
FAQ: my twitter account for quick insights is https://twitter.com/Maverick_Equity!
There you go with March’s 25 charts storm that say 10,000 covering Macro, Stocks, Bonds & More which also naturally connects the dots with aspects of Geopolitics. The way this monthly wrap ups are done is so that many can connect their own dots!
Research is NOT behind a paywall and NO pesky ads here unlike most other places!
What would be appreciated?
👉 just sharing around with like-minded people & hitting the ❤️ button
👉 this will help bringing in more and more quality independent investment research: from a single individual, not a fund, bank or so … !
-
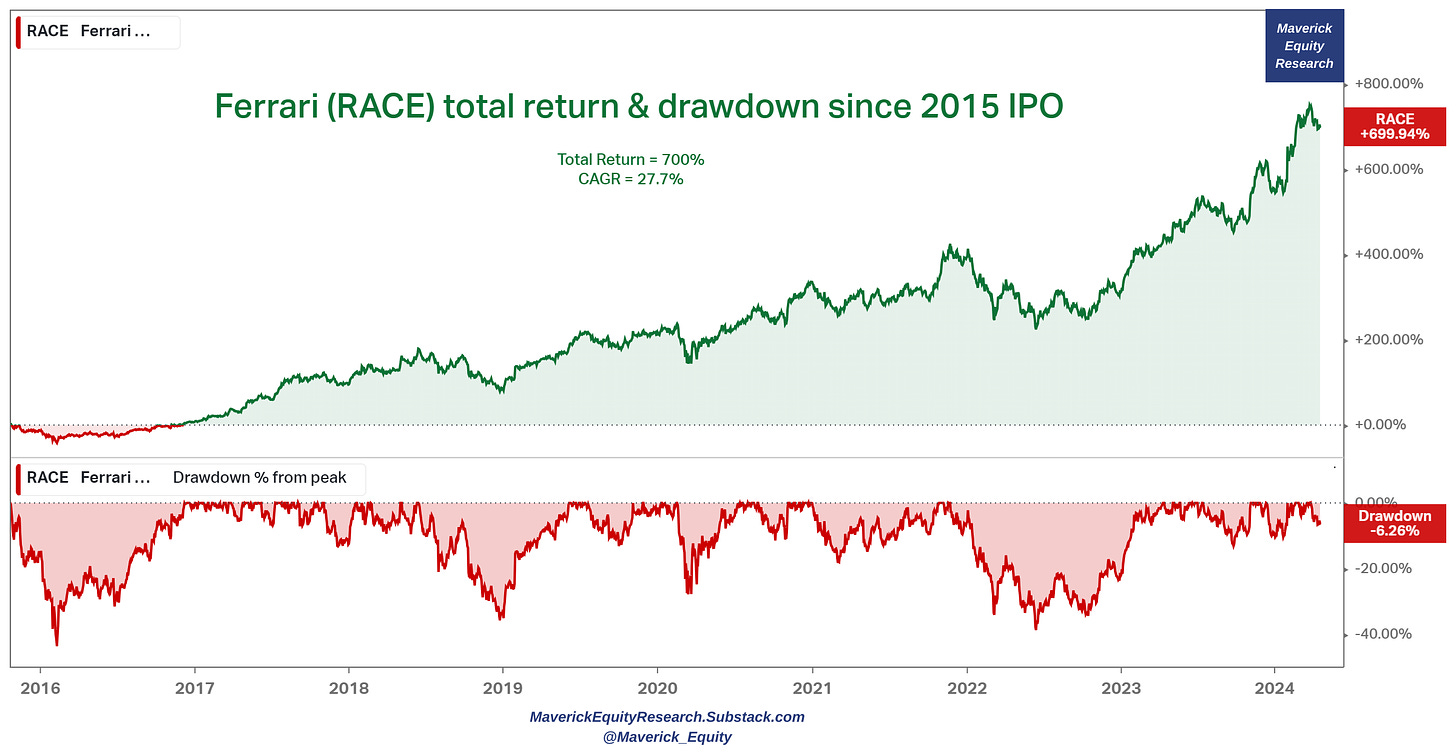
Ferrary (RACE), the prancing horse total return & drawdown since the 2015 IPO
👉 a mega 700% return corresponding to a 27.7% CAGR in 8.5 years
👉 Revenue +109%, EBIT +230%, Net income +334%, FCF +155%, Shares outstd. -5%
Key note:
👉 right after going public it had a big -43% drawdown
👉 -25%, -35% drawdowns came after also, while in 2022 a -40% one
Mav take-away: high returns come very often with high volatility, one is basically paid well to be prepared for it, ride it, overcome it …
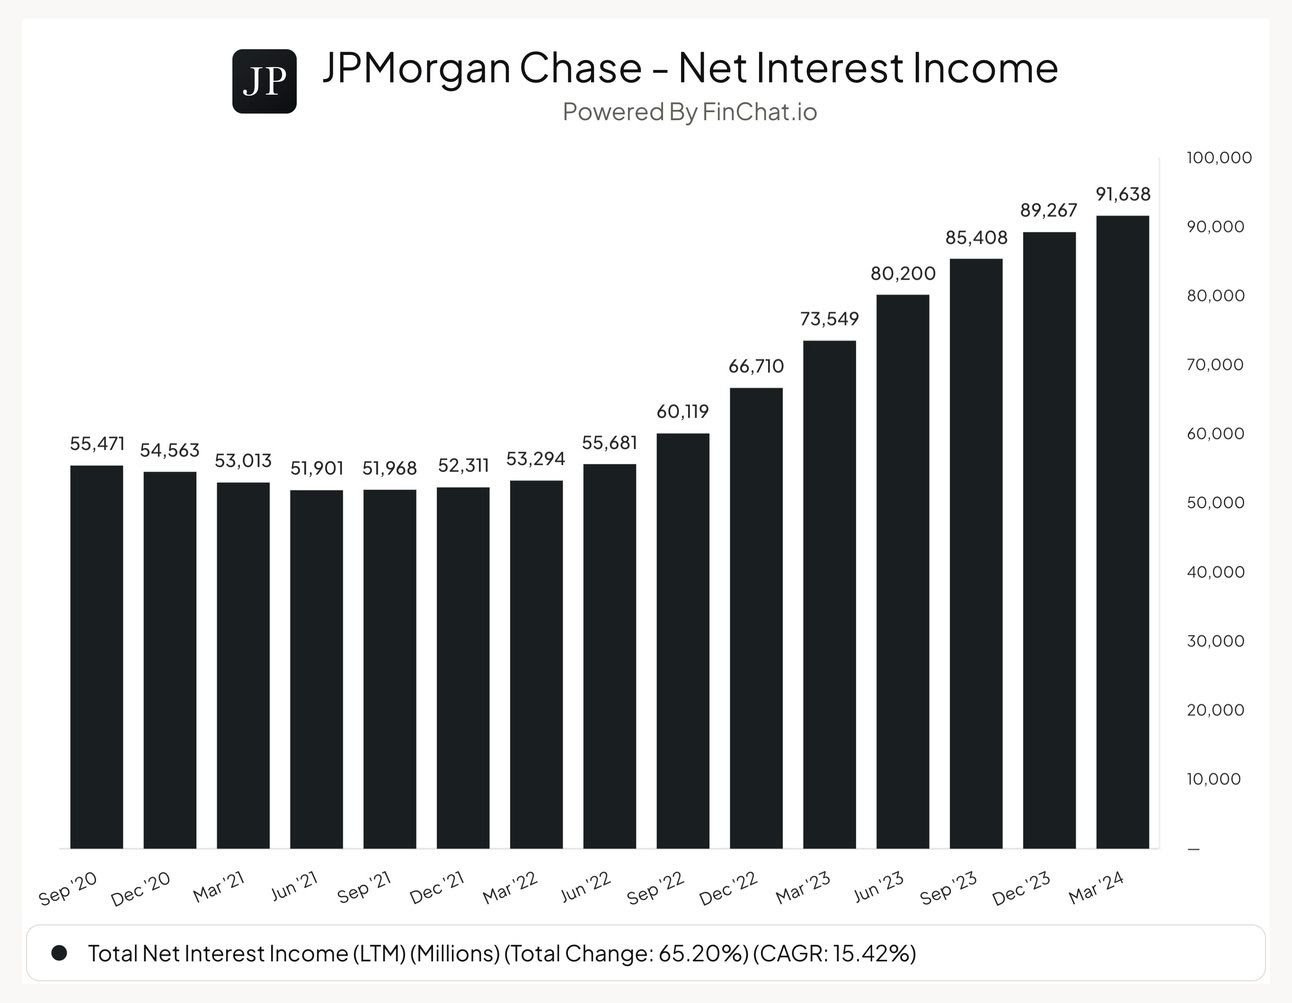
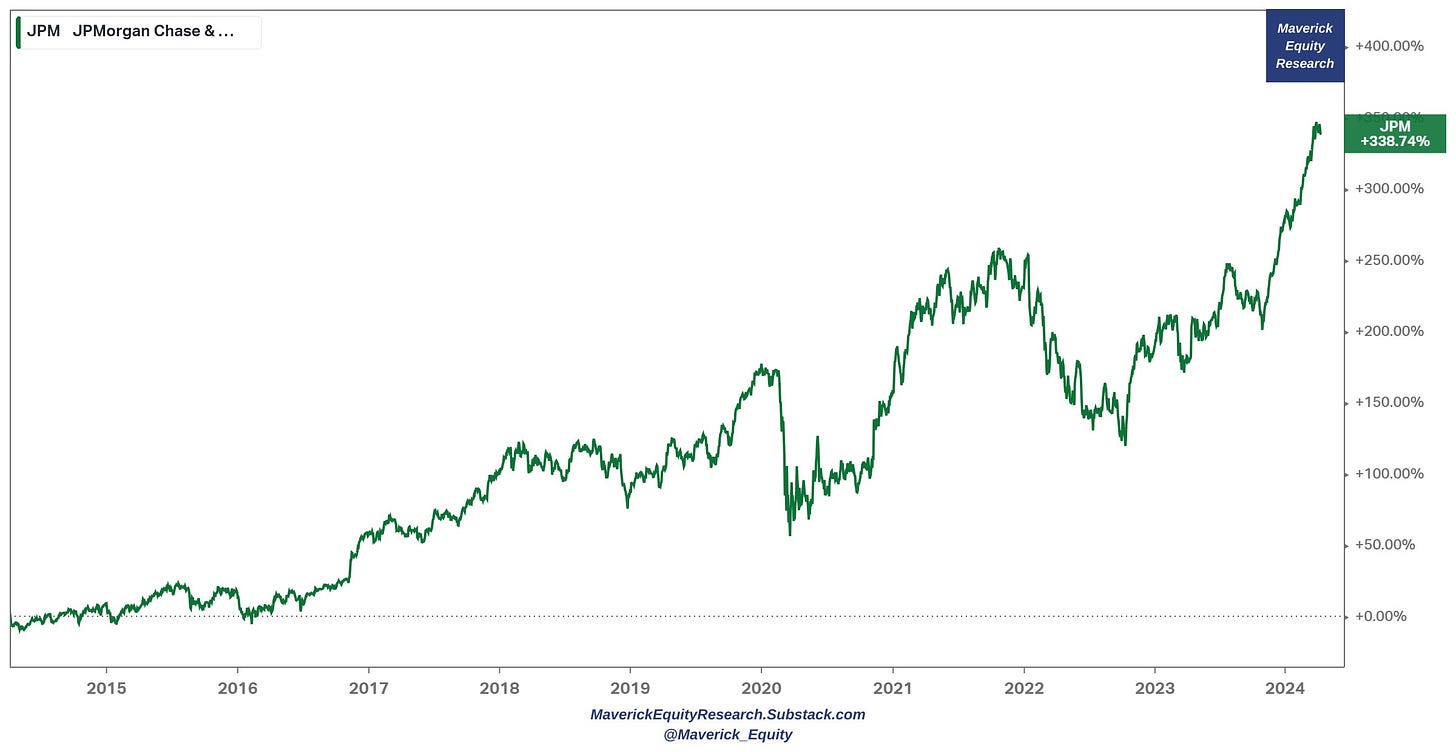
2 & 3. JP Morgan (JPM) – Q1 2024 earnings: was an interesting call that I dialed-in, in short below … while maybe a deeper dive with the next occasion:
👉 EPS $4.44 beating expectations $4.11, Revenue $42.55B beating expectations $41.6B
👉 cautious outlook, some margin compression via the deposits side, but … Net Interest Income (NII) keeps rolling …
👉 stock is 43% in the past year alone, +338% in the last 10 year for a 15.8% CAGR
-
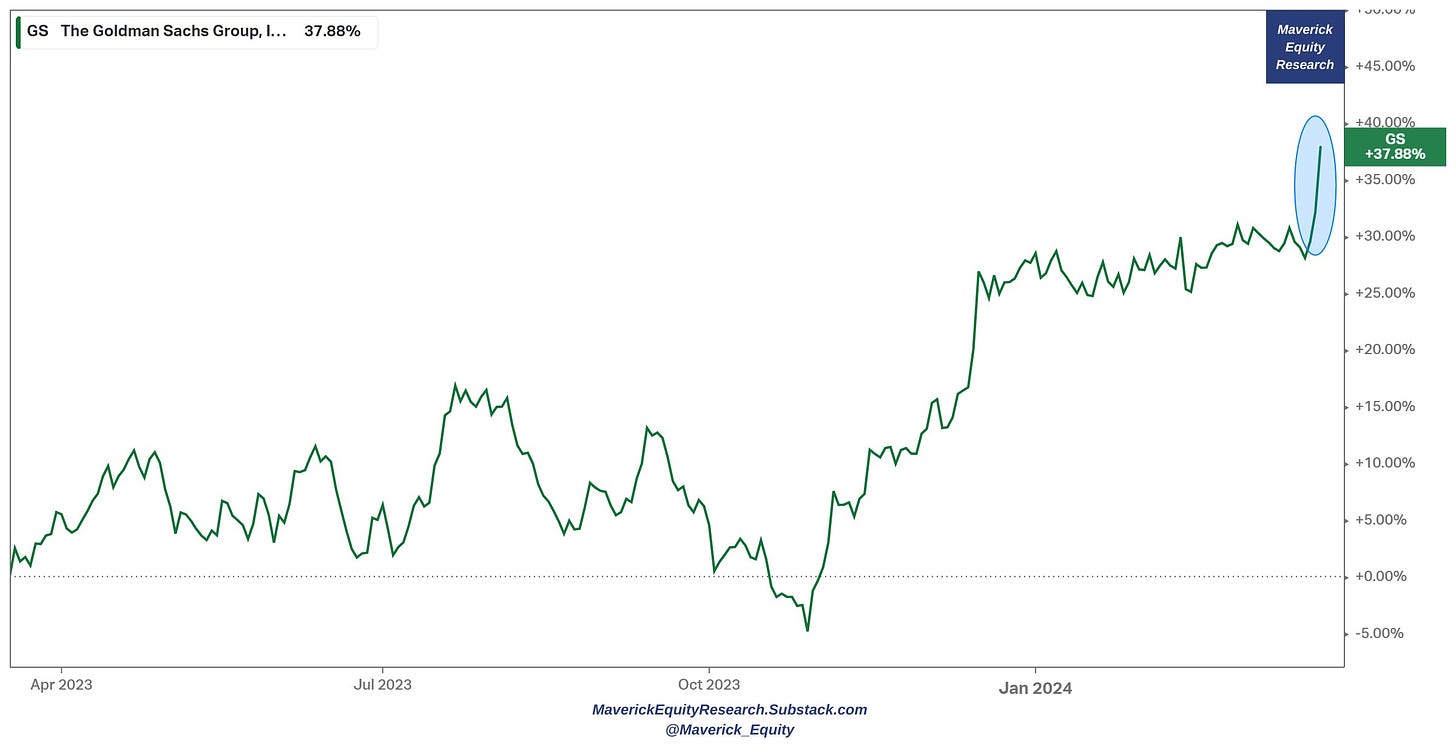
Goldman Sachs (GS) with the (mini) break-out also
-
stacking sacks of cash ahead of more trading volume, IPO, M&A season and all …
-
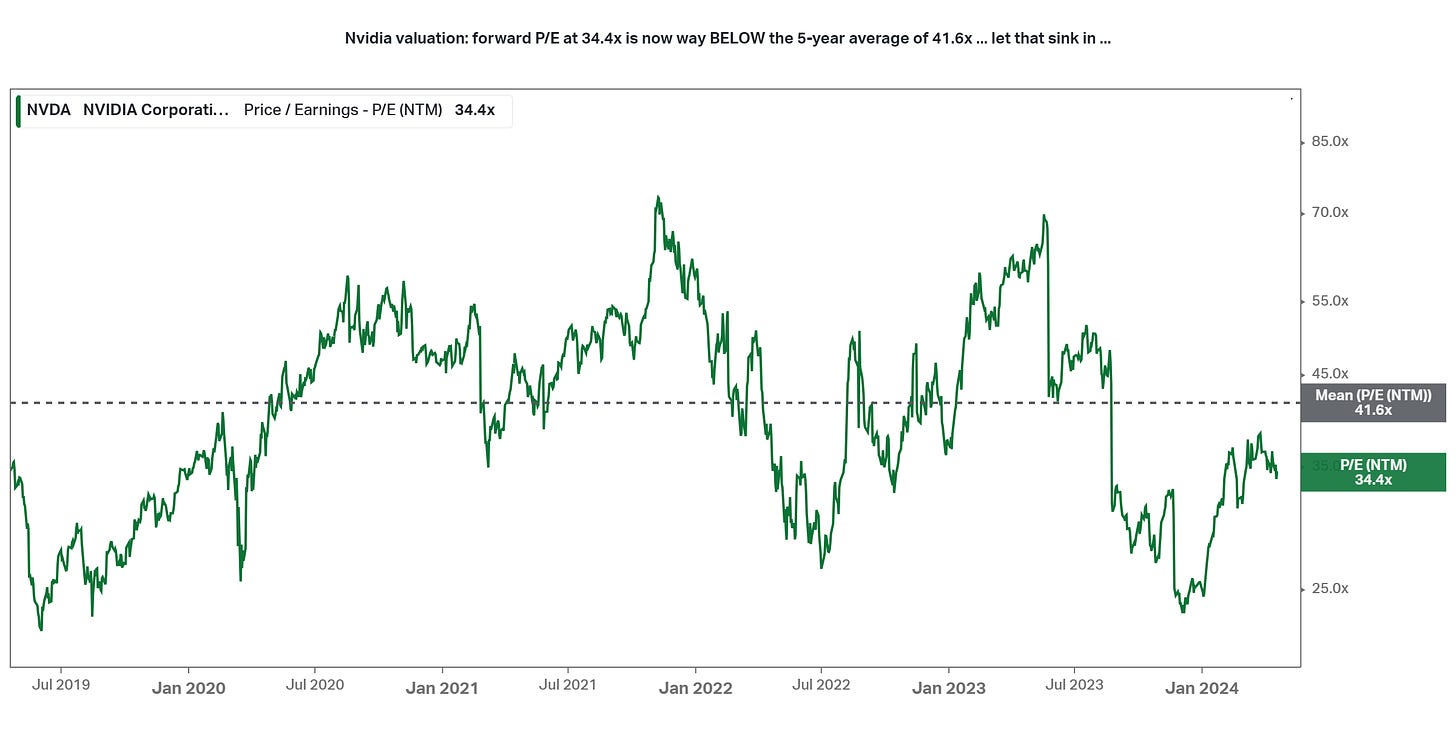
Nvidia valuation!
👉 forward P/E at 34.4x now way BELOW the 5-year average of 41.6x – let that sink in!
-
Super Micro Computer (SMCI) = 27x over just the last 3 years
👉 AI driven demand + Operating Leverage + Multiple Expansion = makes it for a very big growth in revenues
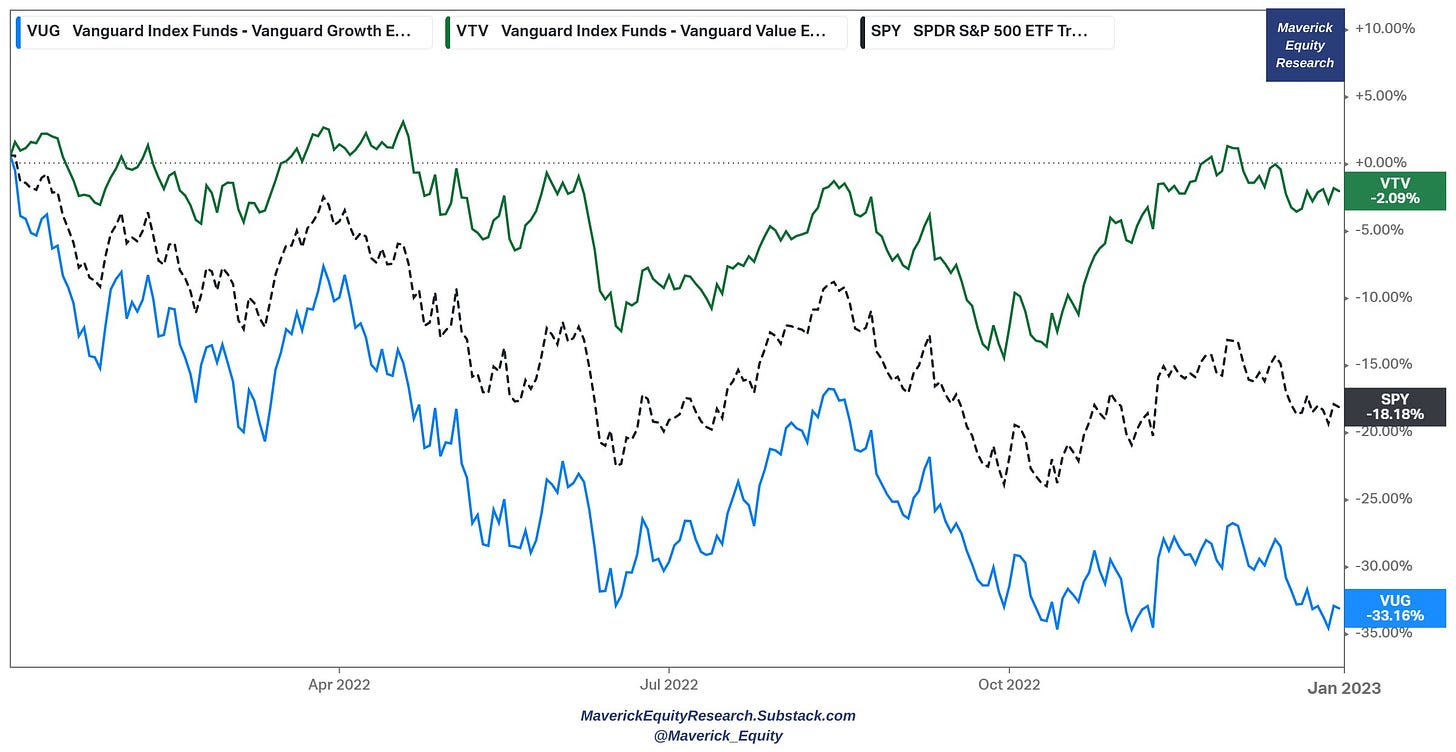
7 & 8. Value & Growth – Value vs Growth
2022 bear market with the S&P 500 -18% (black, SPY):
👉 value (green, VTV) did great with just -2%, while growth -33% (blue, VTG) … growth investors trailing by a factor of 3
👉 in % terms, growth lost to value stocks by the most since 2000 … let that sink in!
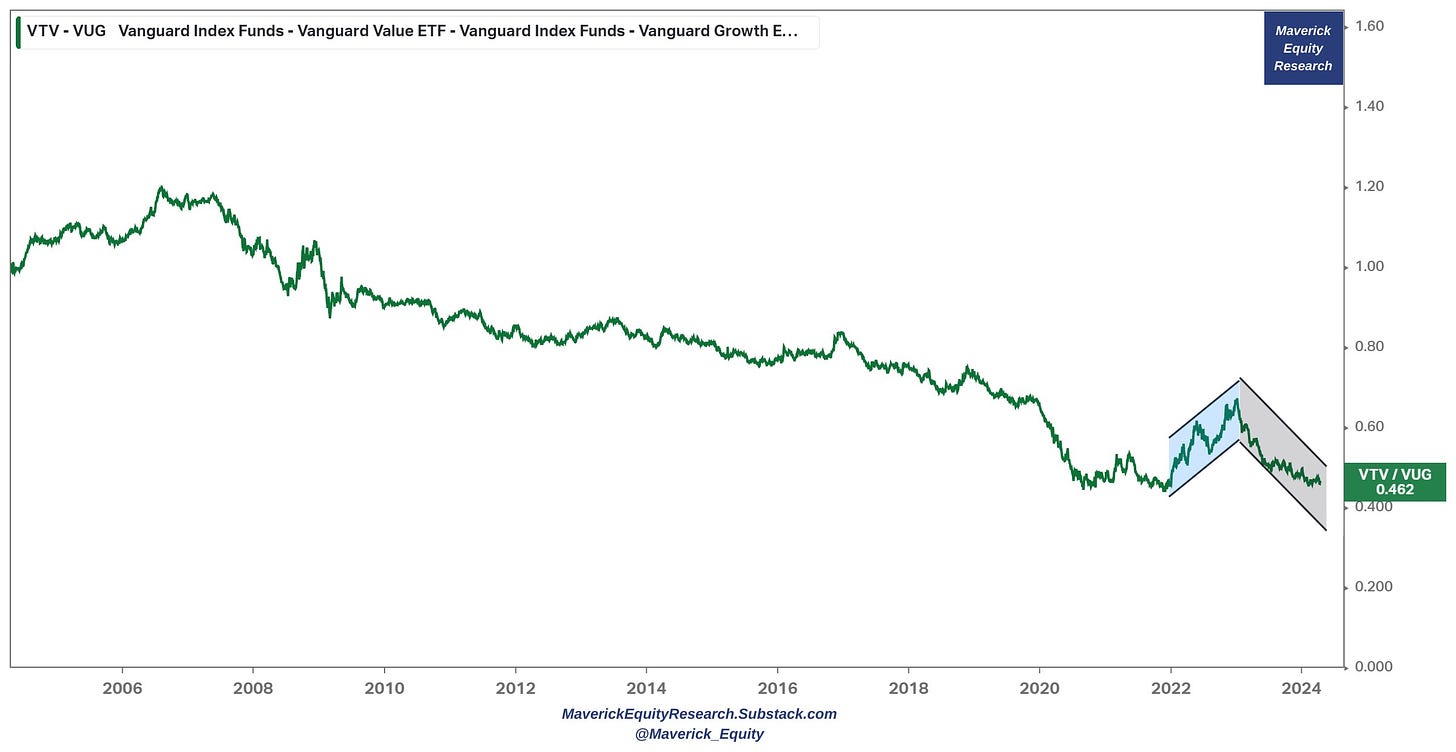
P.S. I like more value in general, but value & growth for diversification …
👉 20-year timeframe, Value & Growth: 2022 value was back as it was time, 2023-2024 growth stronger via the AI, Magnificent 7, tech trend …
-
S&P 500 – sector dominance since 1960 – March 2024
👉 currently the 2-tech heavy sectors dominate big time …
N.B. for more, I released my 5th edition of the S&P 500 Report, in case you missed it:
✍️ The S&P 500 Report: Performance, Profitability, Sentiment & More – #Ed 5
-
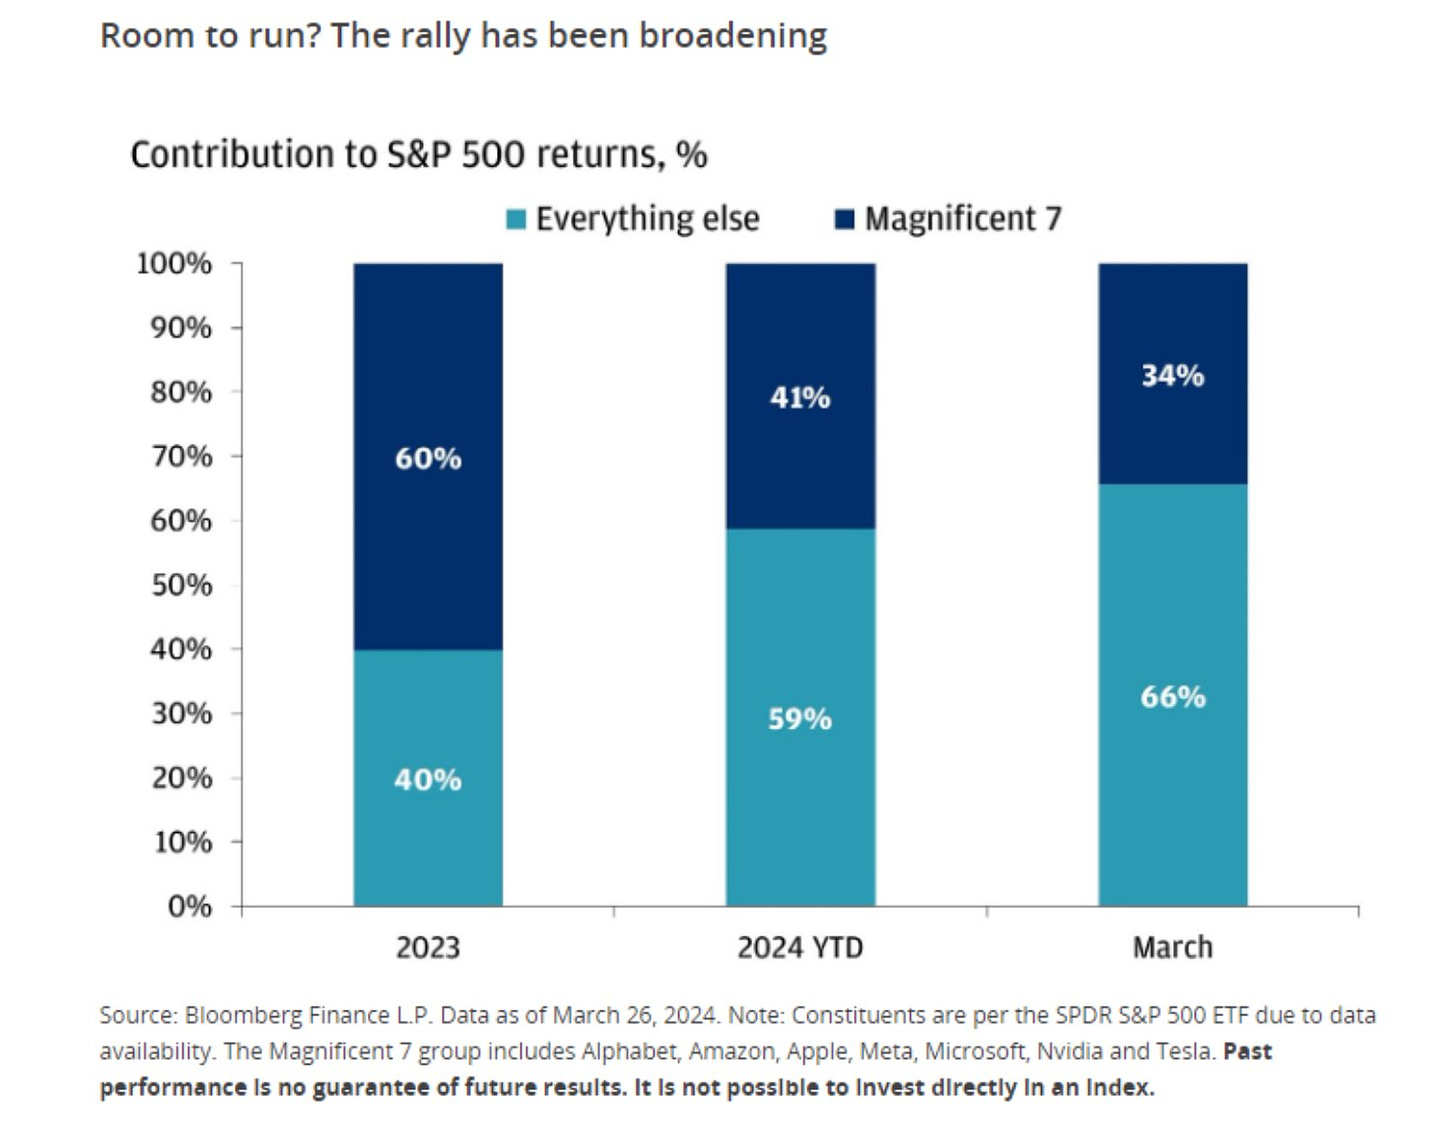
S&P 500 returns are not about just the Mag 7 anymore!
👉 the rally has been broadening since 2023
👉 contribution to total returns: Mag 7 vs all else, 2023, 2024 YTD and March alone as of March 26th – from 60% to 41% to 34% / from 40% to 9% to 66%
N.B. for more, I released my 5th edition of the S&P 500 Report, in case you missed it:
✍️ The S&P 500 Report: Performance, Profitability, Sentiment & More – #Ed 5
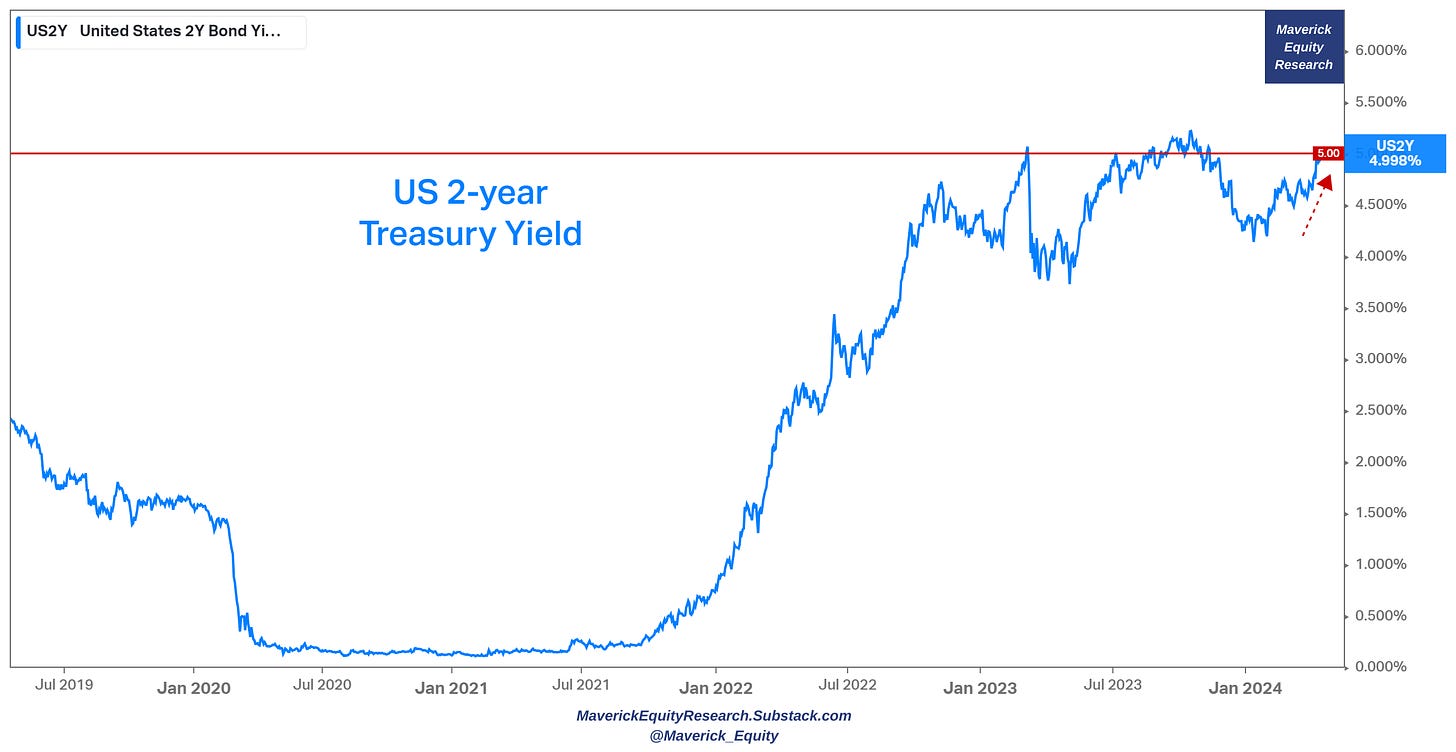
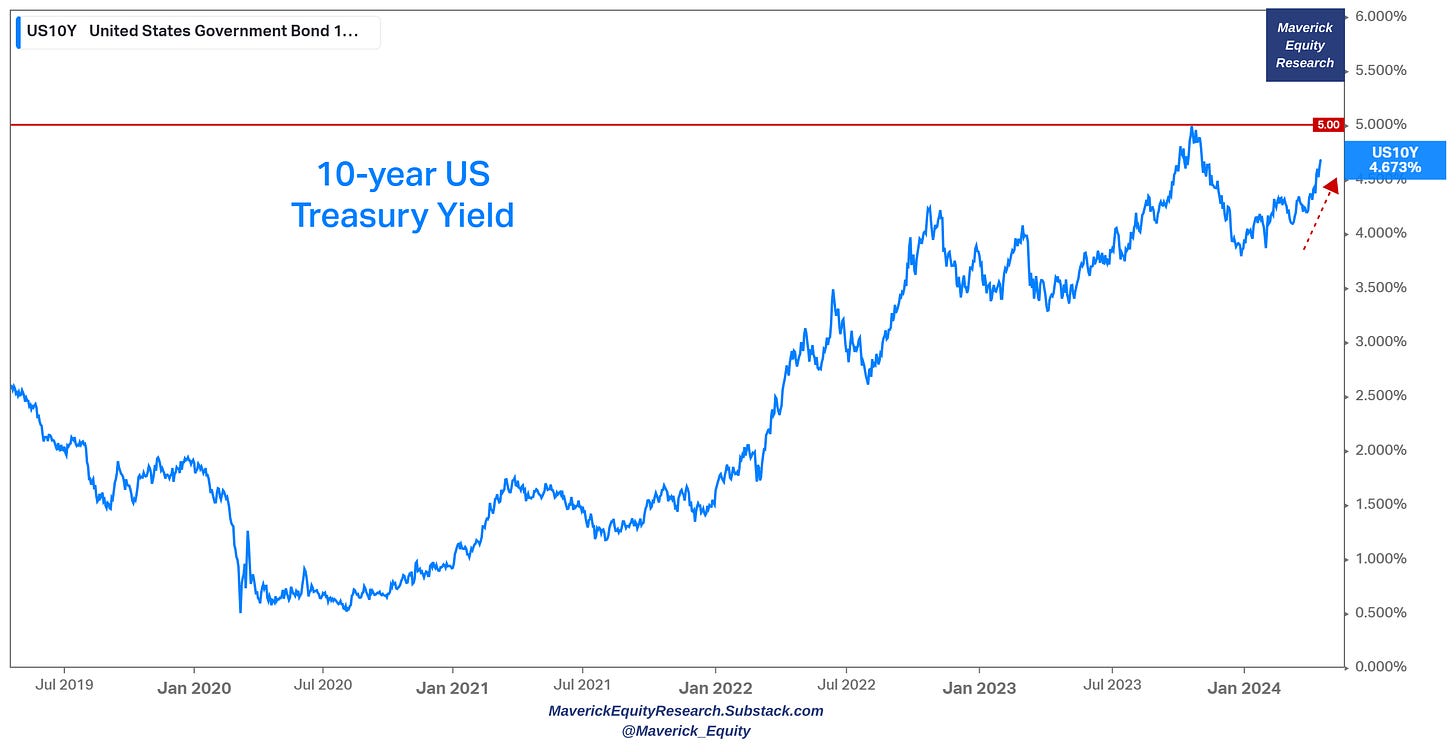
11 & 12. Stocks holding very well given the recent material increase in yields … I say this because the cost of capital, discount rates always matter for valuation …
👉 US 2-year one inch and back to 5%
👉 US 10-year one inch at 4.67% … quite something if back to 5% … locking in 5% risk-free is not bad in my opinion
-
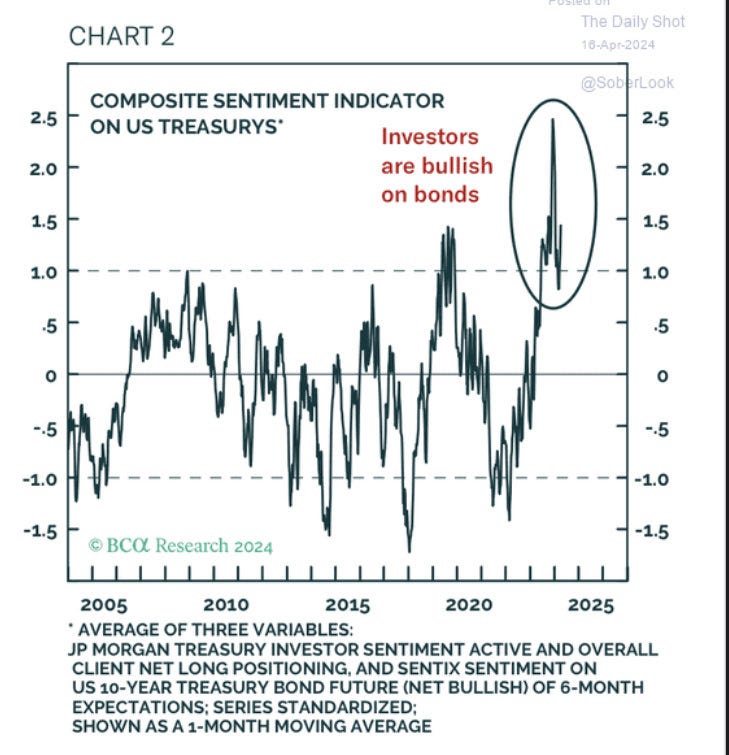
The latest Sentiment on Bonds via a composite sentiment indicator
👉 investors are bullish on bonds … a bit less relative to last year, but still very bullish relative to historical values
P.S. wrote recently a 2-part series on Investing in Bonds/Cash/Credit … in case missed:
✍️ My name is Bond, Yield Bond! The Return of Yield! Getting Paid to Chill … (Part I)
✍️ My name is Bond, Yield Bond! The Return of Yield! T-Bill & Chill … T-Bond & Long (Part II)
Two key Portfolio Management charts:
-
The big benefits of saving and investing early are the keys to compounded returns. A key example via account growth of $200 invested/saved monthly:
👉 the early and consistent investor has the best results
👉 the early investor who stops after 10 years does slightly better than the late investor who invests significantly more over a longer time.
👉 and the consistent saver who does not invest loses out on higher returns
The Big 3: start early (time), return (compounding), investment (contribution)
The Big 5: add tax optimisation, with low commissions and low portfolio turnover
-
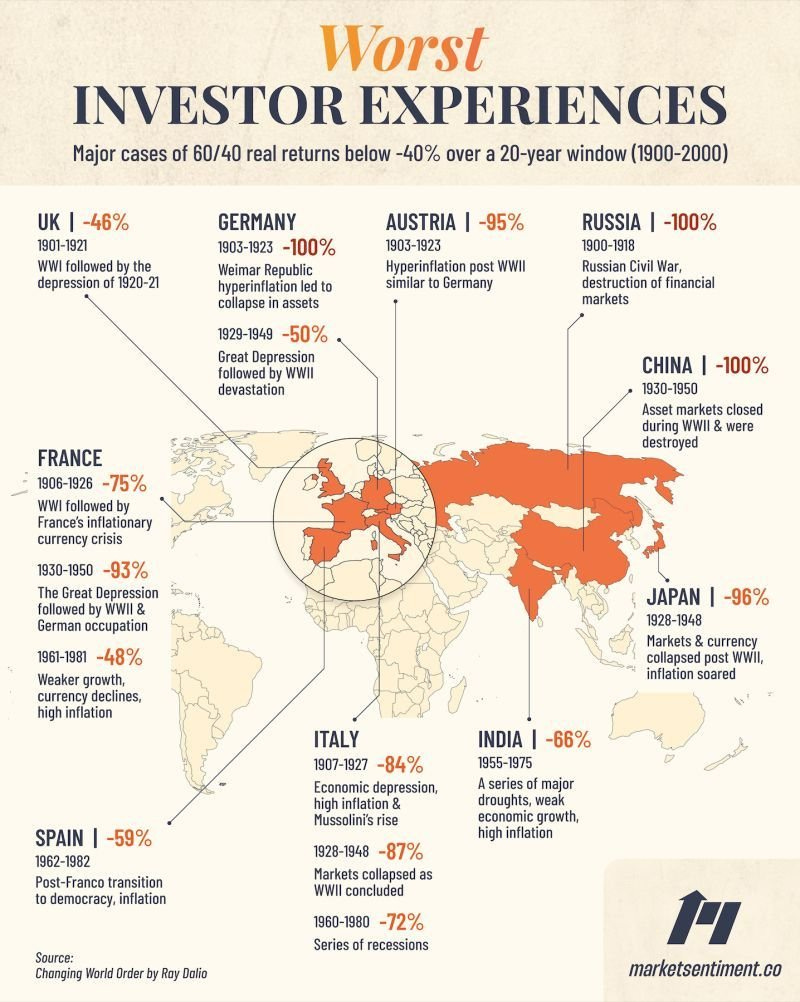
One big century of worst investor experiences – 1900-2000
👉 home bias can be very dangerous … then recency and confirmation bias …
Solution?
👉 global diversification for the long-term win! Diversification is the only nice and sweet free lunch that we get in finance
👉 avoiding the risk of ruin is the number 1 feature of any portfolio imho
5 key Macro charts
-
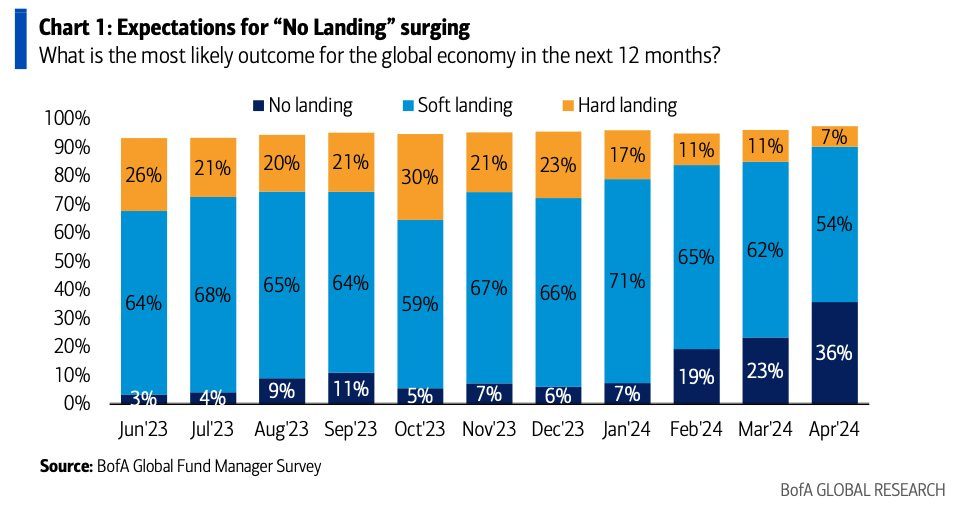
Global economy outlook in the next 12 months? Global Fund Manager Survey
👉 Expectations for “No Landing” from 7% in January to 36% now in April = no recession scenario
👉 Expectations for “Hard Landing” from 17% in January to 7% now in April = no recession scenario
Overall, way better expectations … Cheers!
-
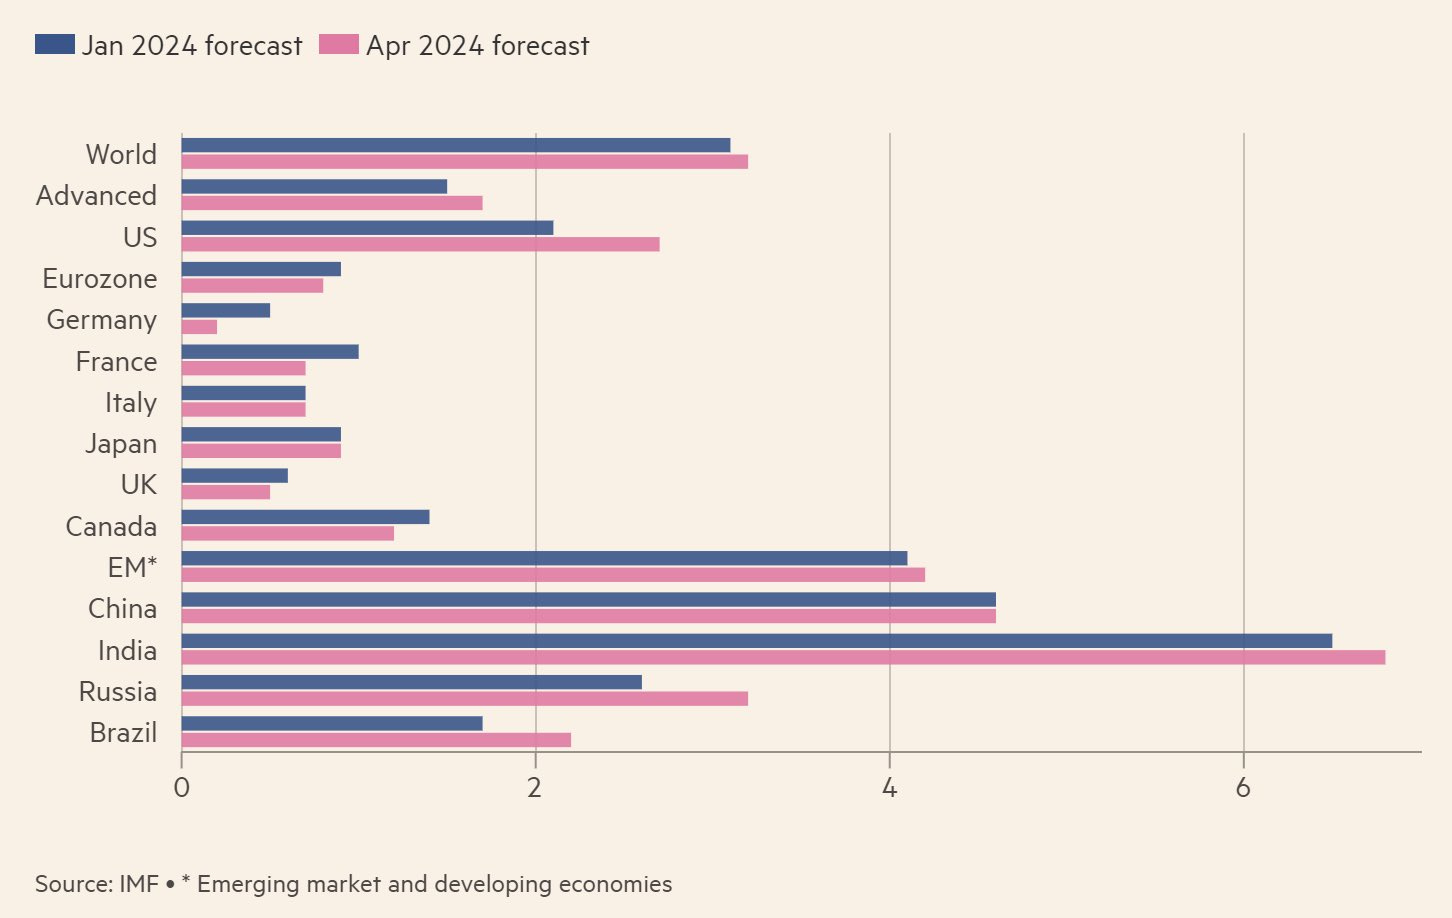
Complementary, 2024 GDP growth forecasts for the world has improved
👉 improved for both advanced and emerging markets
👉 while growth forecasts for Europe and Canada deteriorated
-
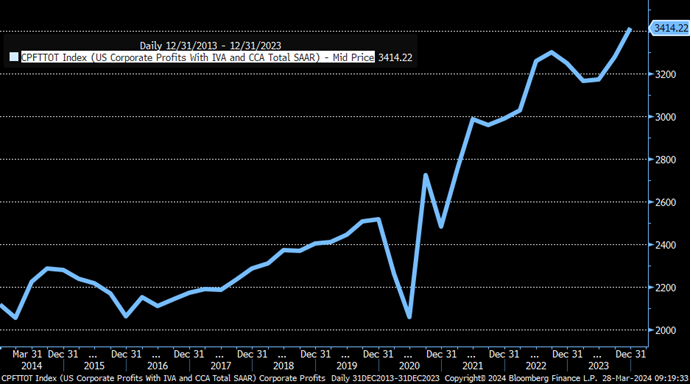
US Corporate profits as of Q4 2023
👉 guess what? rose to a new all time high …
-
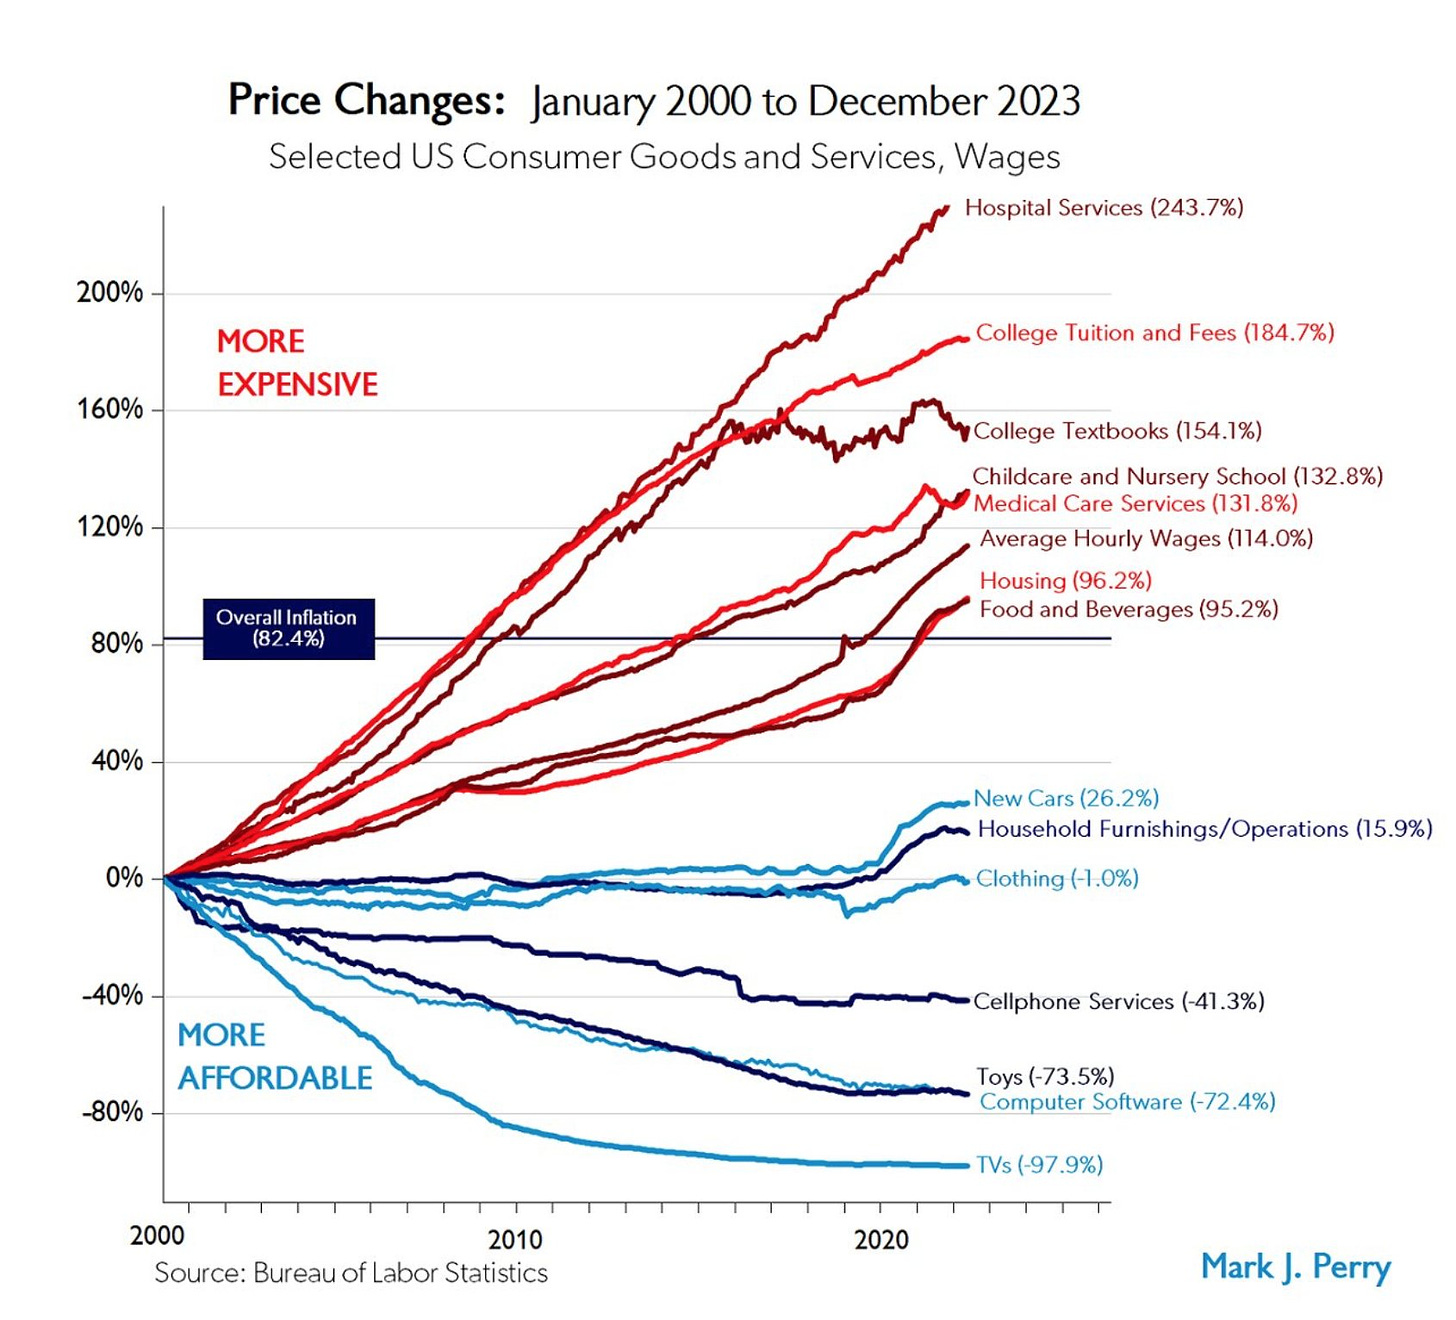
US overall inflation since 2000 to 2023
-
has been 82.4%, yet see the wide distribution of price changes on selected US consumer good and services; in other words: your inflation is not equal to anybody’s else inflation, not even to yours in time
-
the private sector makes stuff way cheaper, yet the government way more pricey; in other words, competitive markets work and do well being a net positive force, and the opposite the government …
Your thoughts? As always, I’m happy to be wrong via other solid data and rationale
P.S. working now on a comprehensive Macro piece dedicated exclusively to the Inflation topic, aiming to release it at the beginning of May, stay tuned …
-
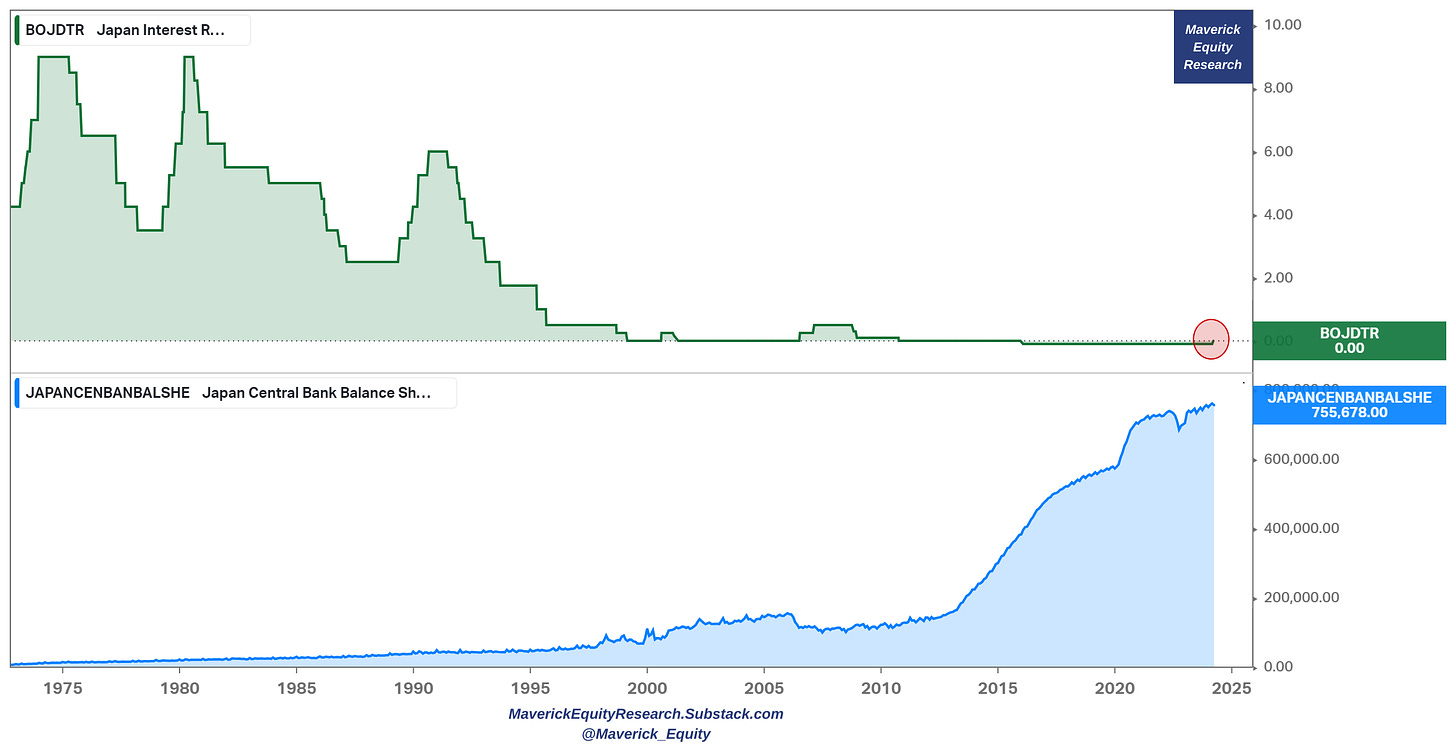
Japan central bank (BoJ) – interest rates and balance sheet
-
raised interest rates for the first time in 17 years after decades of deflation fears … as currently a stable 2% inflation target is getting within reach
-
balance sheet yet still expanding and at all-time highs
5 key Bitcoin & Gold charts
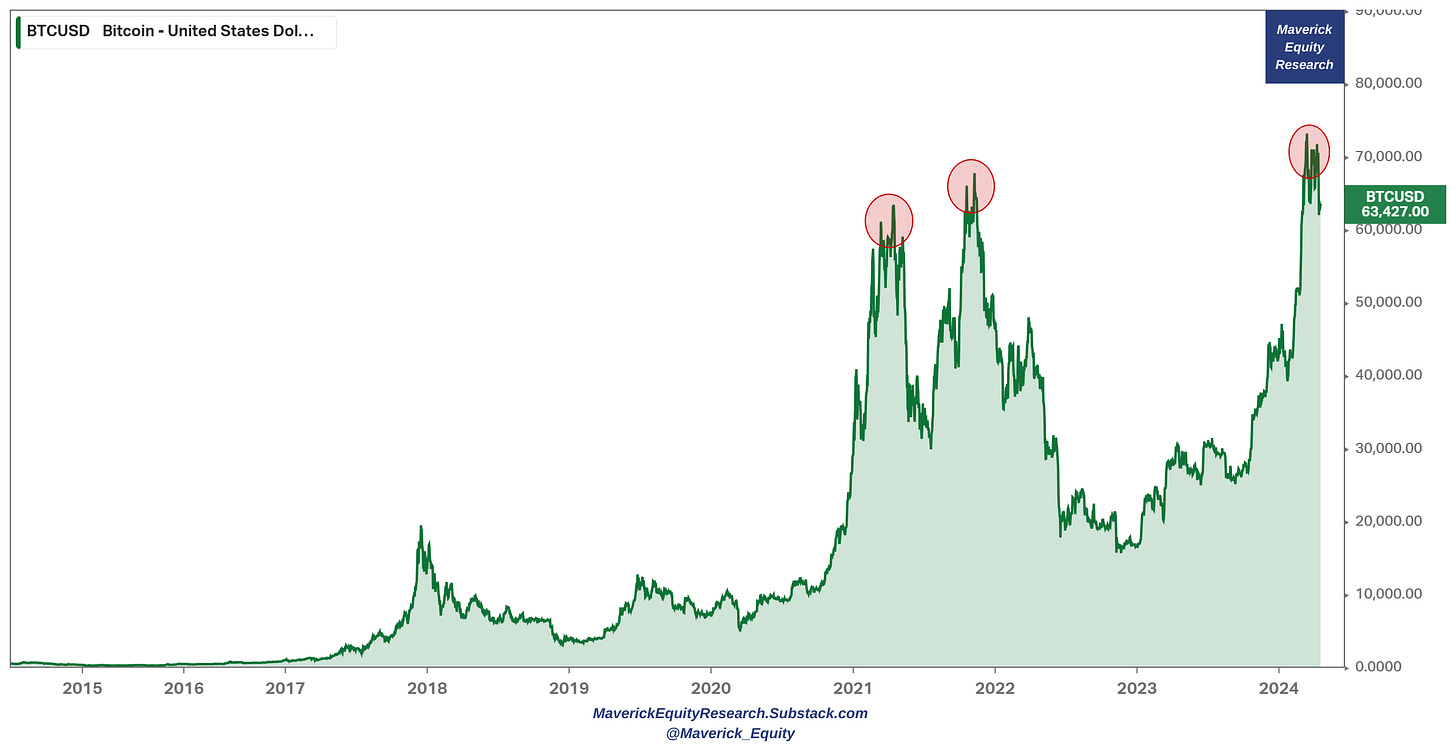
21 & 25. Bitcoin = a funny world?
👉 if this was the digital gold, the money of the people et. al … with ETFs approval, you would have expected this to blow off the previous crazy 2021 tops, yet it did not …
👉 the big ‘nodes’ selling into strength, the weak ‘nodes’ (most people’ buying on the way to tops and the tops?
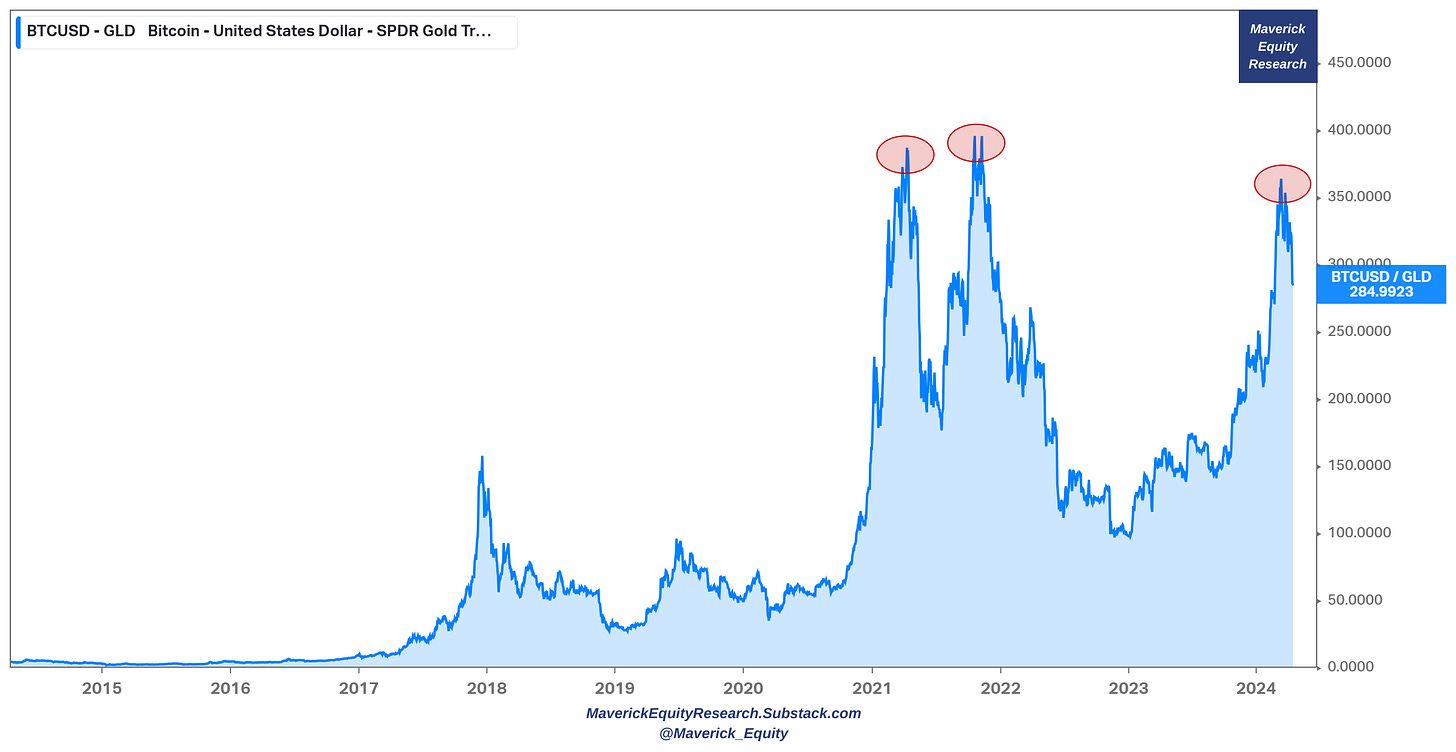
Bitcoin over Gold (GLD ETF) angle as complementary
👉 Bitcoin did not even surpass it’s previous frenzy 2021 highs … Your thoughts?
Your thoughts? As always, I’m happy to be wrong via other solid data and rationale
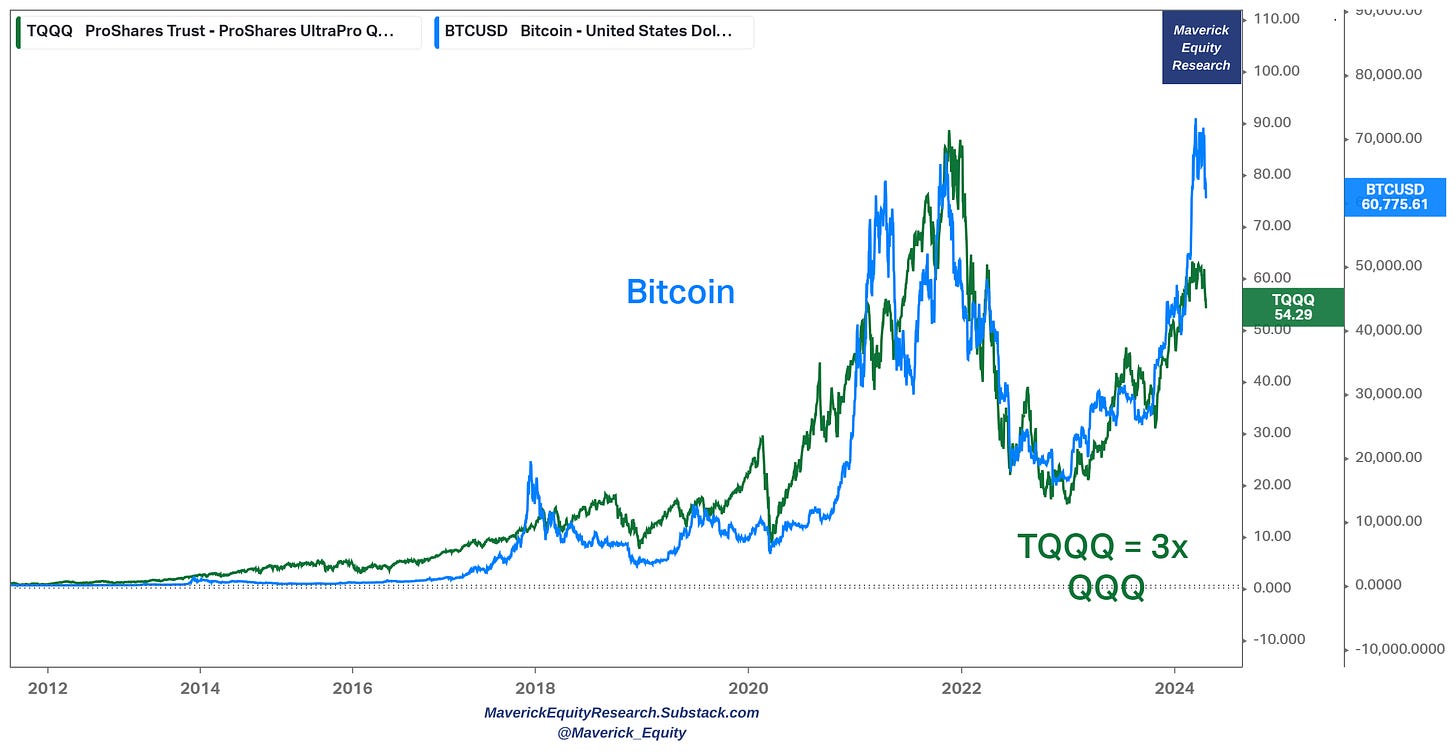
Bitcoin and TQQQ (3x QQQ Nasdaq-100) correlation: lately Bitcoin ‘disconnected’ …
Food for thought:
👉 Risk appetite instruments? decay? correlation / causation? Fun to play the casino of tickers moving on a screen?
👉 Irrationality showing the semi-efficiency of markets pricing in risk … or well, emotions, frenzy?
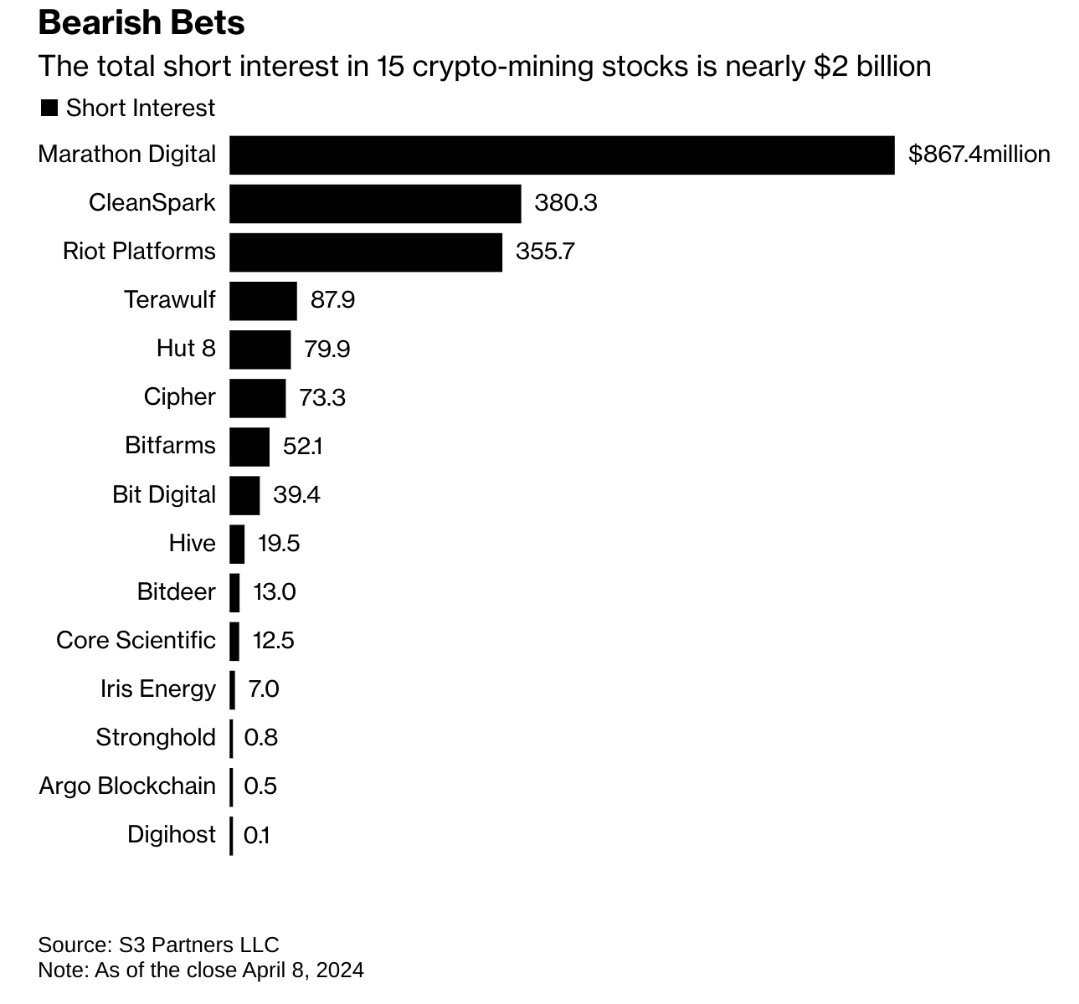
Short interest in crypto mining stocks nearly $2 billion
👉 Bitcoin halving could result in Bitcoin miners annual losses of up to $10 billion
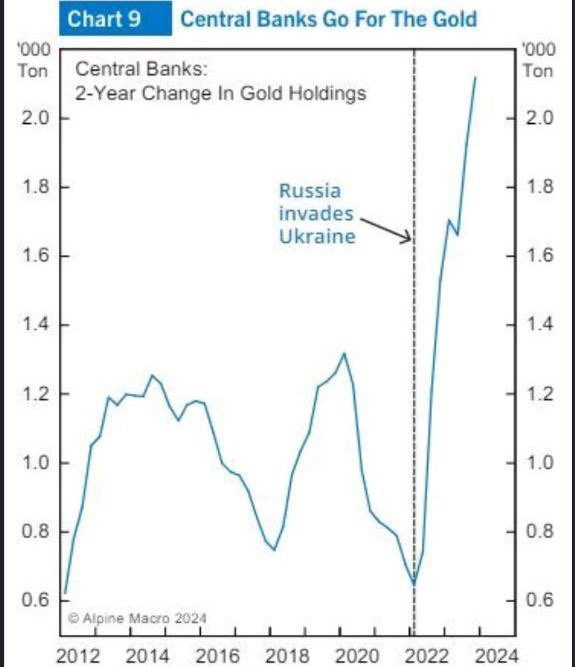
Gold rally explained in one chart
👉 central banks 2-year change in gold holdings
👍 Bonus charts 👍
-
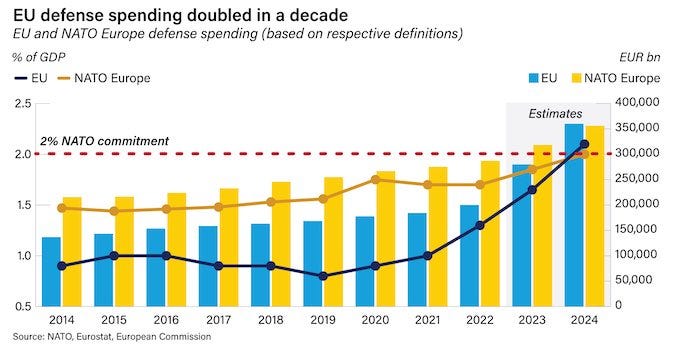
Geopolitics Chart of the Week – EU and NATO Europe defense spending
👉 EU defense spending doubled in a decade!
👉 since the Russia-Ukraine war, the 2% out of GDP NATO defense spending commitment is estimated to be reached and surpassed
👉 relative values: since the beginning of, European NATO members increased annual defense spending by an amount equivalent to Russia‘s entire pre-war annual military spend … that’s not peanuts, but quite some one can easily say …
-
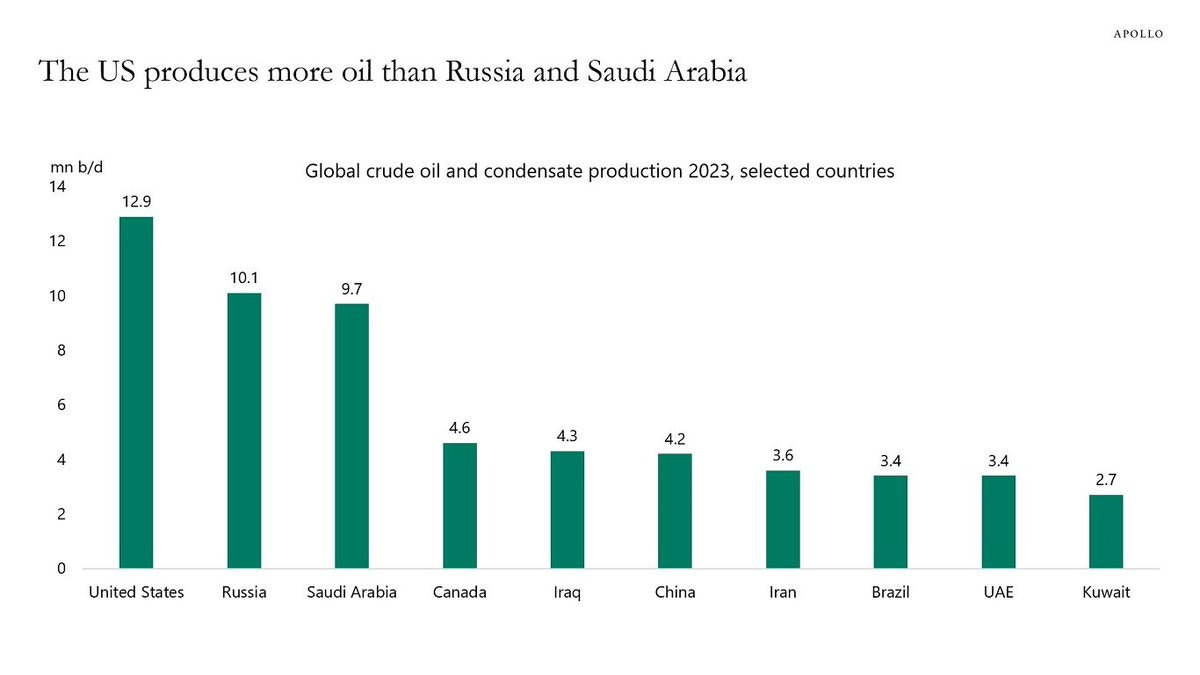
The US now produces more oil than Saudi Arabia and Russia
-
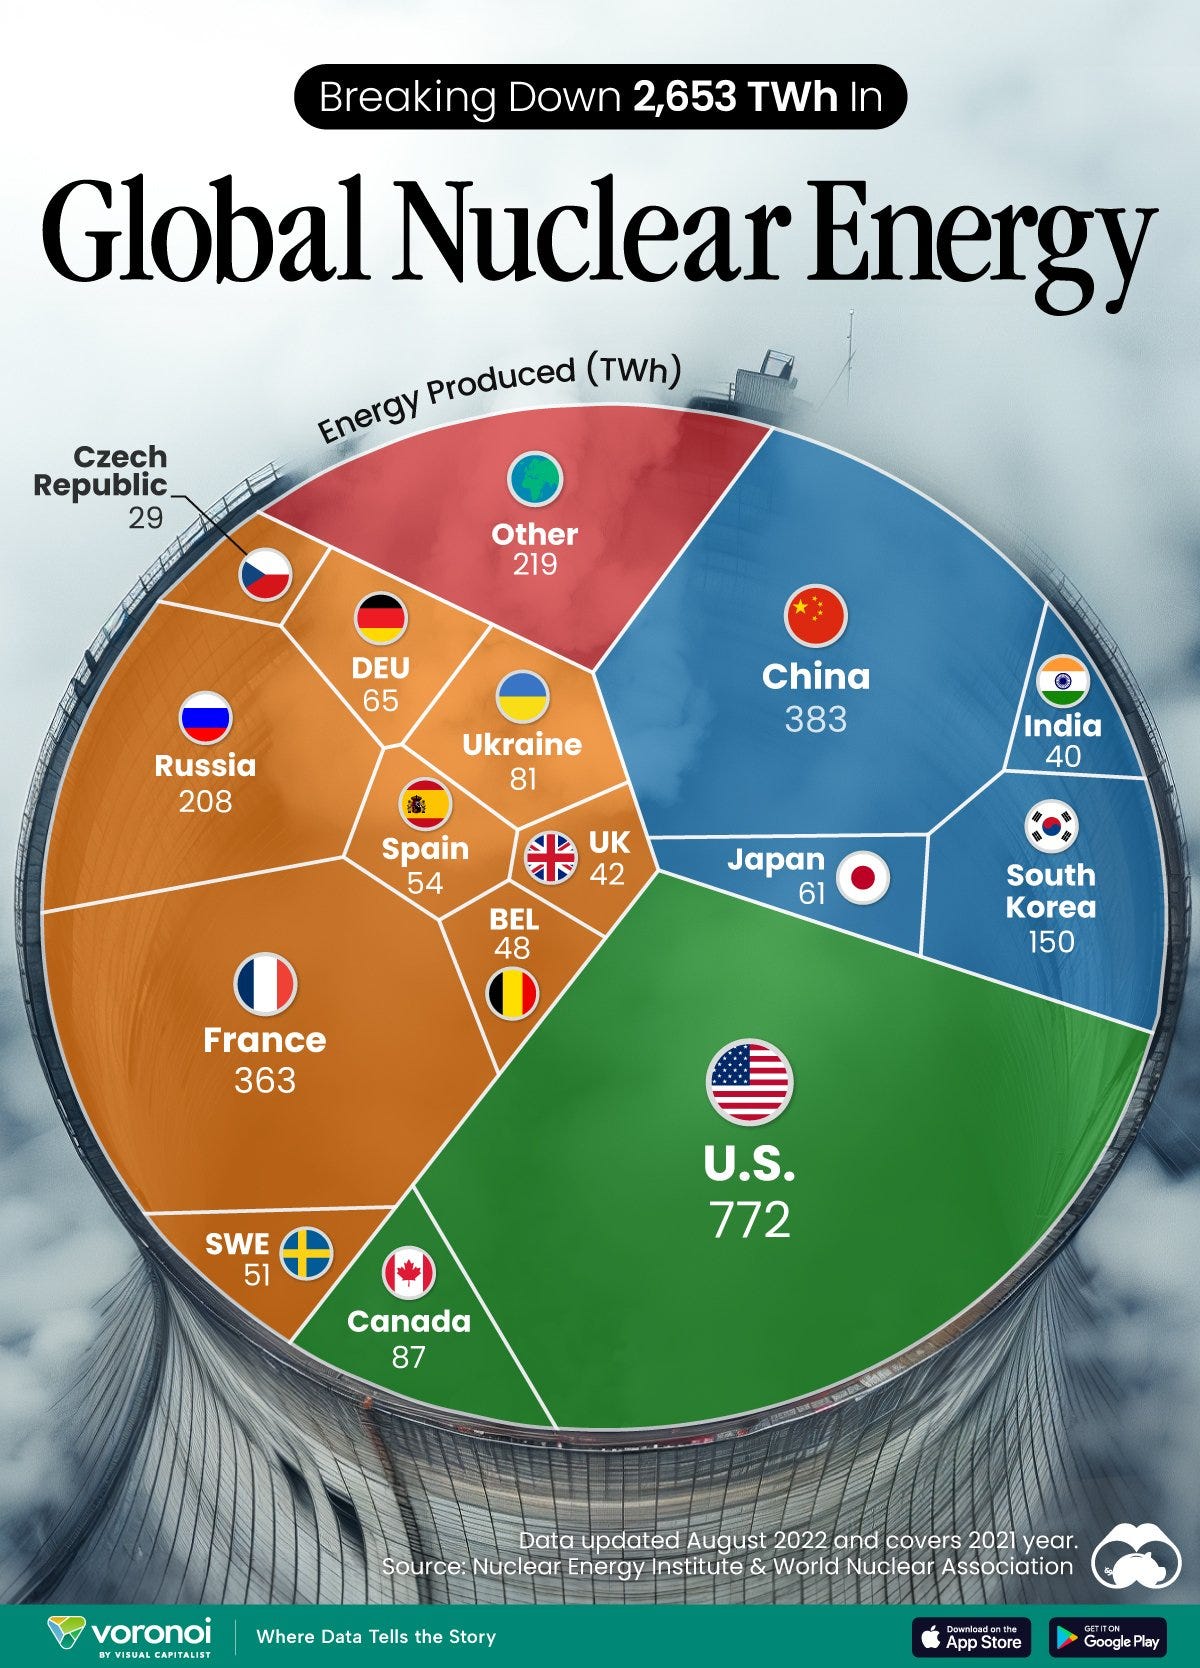
The World’s Biggest Nuclear Energy Producers – Charted
👉 scientists in South Korea recently broke a record in a nuclear fusion experiment. For 48 seconds, they sustained a temperature seven times that of the sun’s core
👉 but generating commercially viable energy from nuclear fusion still remains more science fiction than reality. Meanwhile, its more reliable sibling, nuclear fission, has been powering our world for many decades
Which Country Generates the Most Nuclear Energy?
👉 nuclear energy production in the U.S. is more than twice the amount produced by China (ranked second) and France (ranked third) put together. In total, the U.S. accounts for nearly 30% of global nuclear energy output
👉 however, nuclear power only accounts for one-fifth of America’s electricity supply. This is in contrast to France, which generates 60% of its electricity from nuclear plants
-
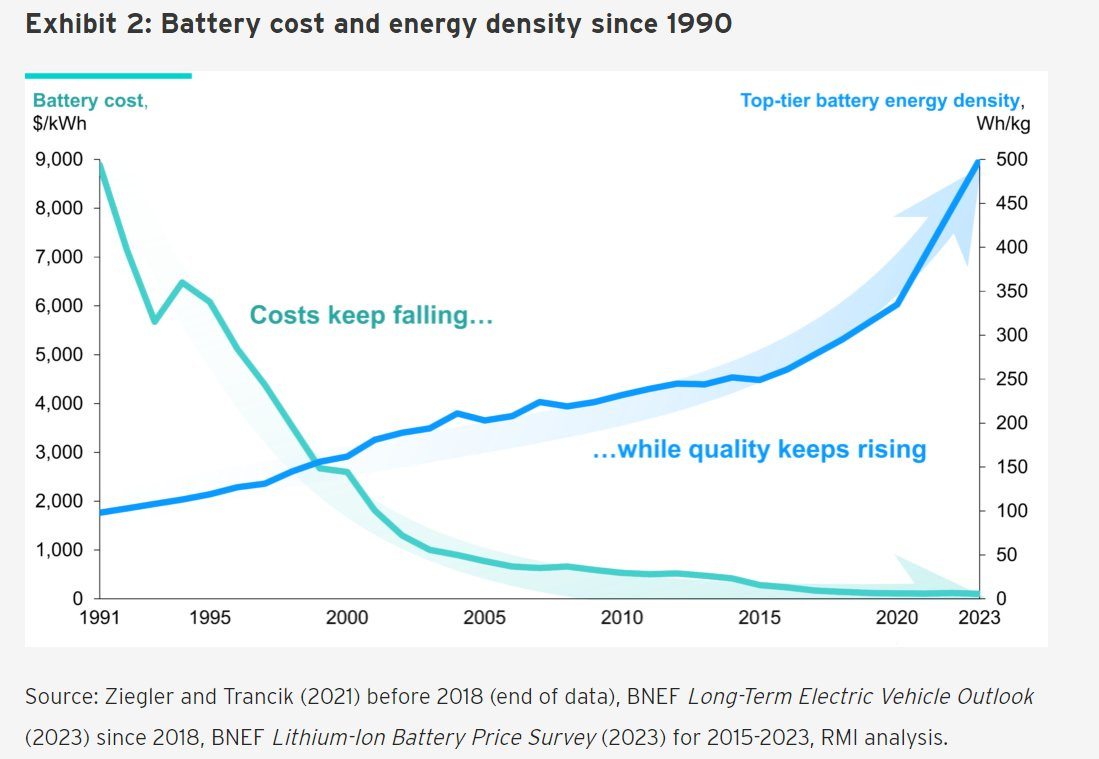
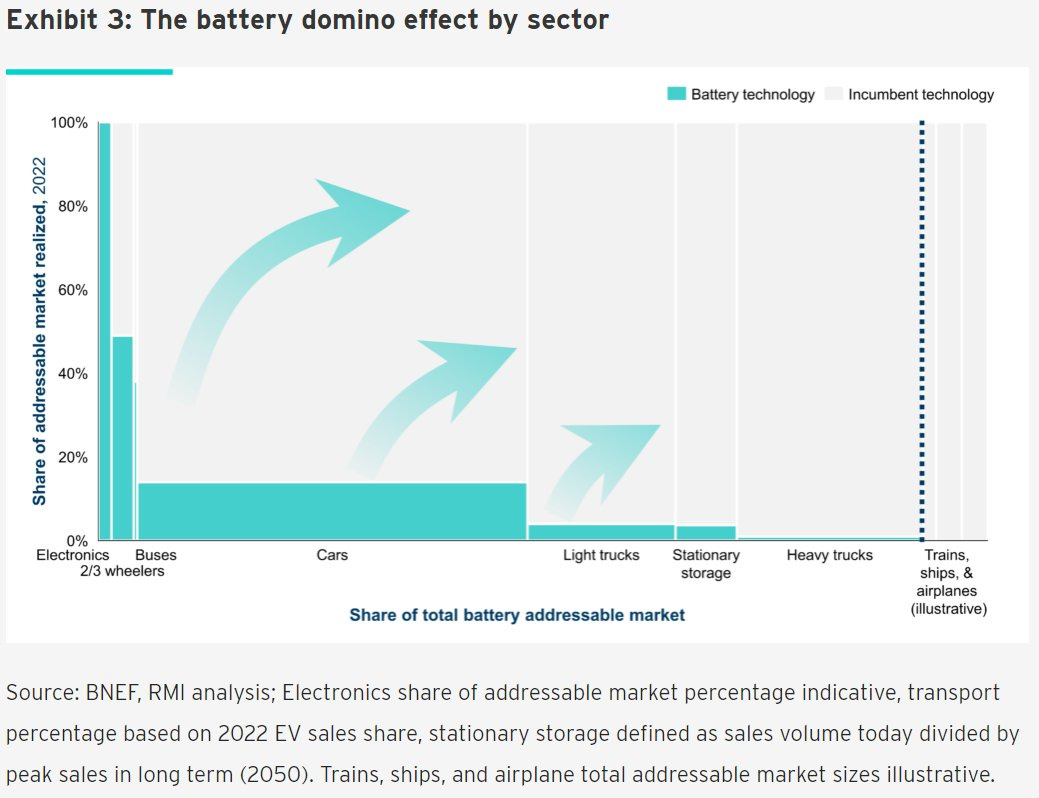
Battery cost and energy density since 1990, let this one sink in:
👉 over the past 30 years, battery costs have fallen by a dramatic 99 percent; meanwhile, the density of top-tier cells has risen fivefold
👉 the battery domino effect by sector = great externalities!
-
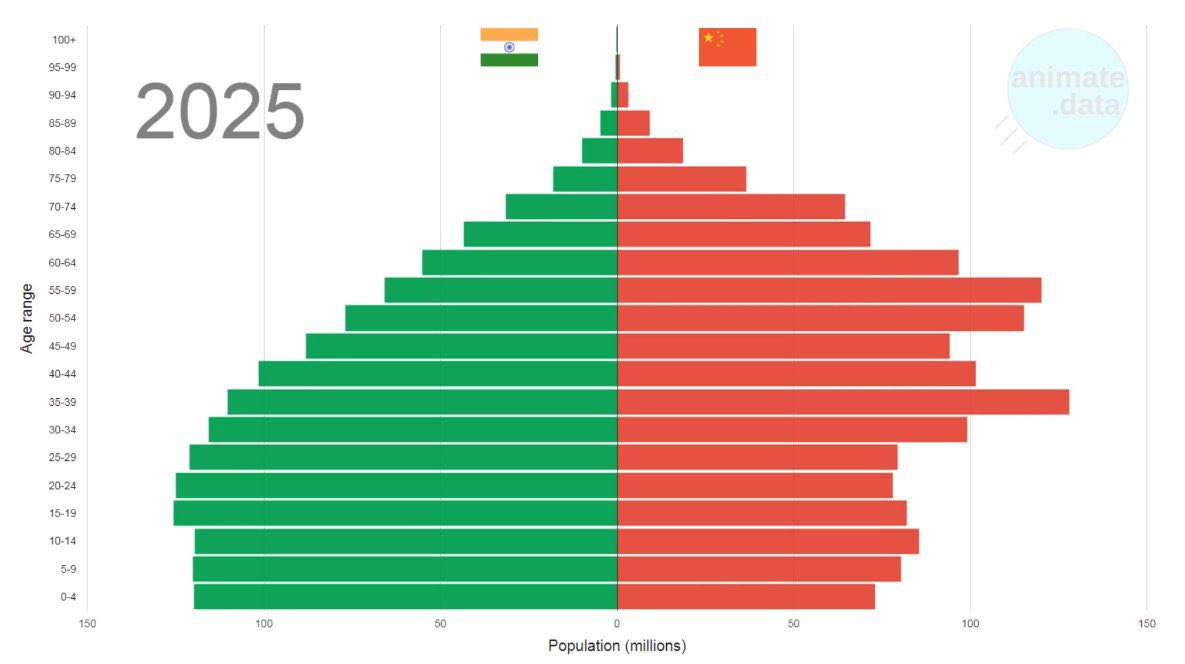
Demographics, not often looked at in investing: China and India edition!
-
it will be very interesting to see this decades ahead, my quick take: India looks better, yet behind China’s infrastructure and tech/digitalisation
-
where would you invest more based on that?
Research is NOT behind a paywall and NO pesky ads here unlike most other places!
Did you enjoy this extensive research by finding it interesting, saving you time & getting valuable insights? What would be appreciated? Sharing it around with like-minded people and hitting the ❤️ button. This will help me bringing in more & more independent investment research: from a single individual, not a fund, bank or so … !
Have a great day!
Mav 👋 🤝
