✍️ The S&P 500 Report: Performance, Profitability & Special Metrics – #Ed 3
Dear all,
welcome to the 3rd edition of the S&P 500 Report, a unique & comprehensive report via data driven research & visually appealing charts that simply tell 10,000 words. A perfect time for another S&P 500 deep dive now that the Q2 2023 earnings are over.
N.B. This S&P 500 coverage focuses on Performance, Profitability & Special Metrics. Valuation lens will be covered in the dedicated ‘Valuation’ section, prior edition here: ‘Maverick Valuations #2 – USA: Dow Jones, Nasdaq 100 & the mighty S&P 500’
Structured in 6 parts + bonus charts & designed to have a natural flow:
📊 Performance Ins & Outs
📊 Earnings, Profitability, Flows, Value & Growth
📊 The 11 Sectors Performance Breakdown
📊 Sentiment, Seasonality, Volatility
📊 Technical Analysis: Short Term & Long Term
📊 Special & Alternative Metrics
👍 Bonus Charts 👍
📊 Performance Ins & Outs
👉 Bears Make Headlines & Lose Money, Bulls Make Money!
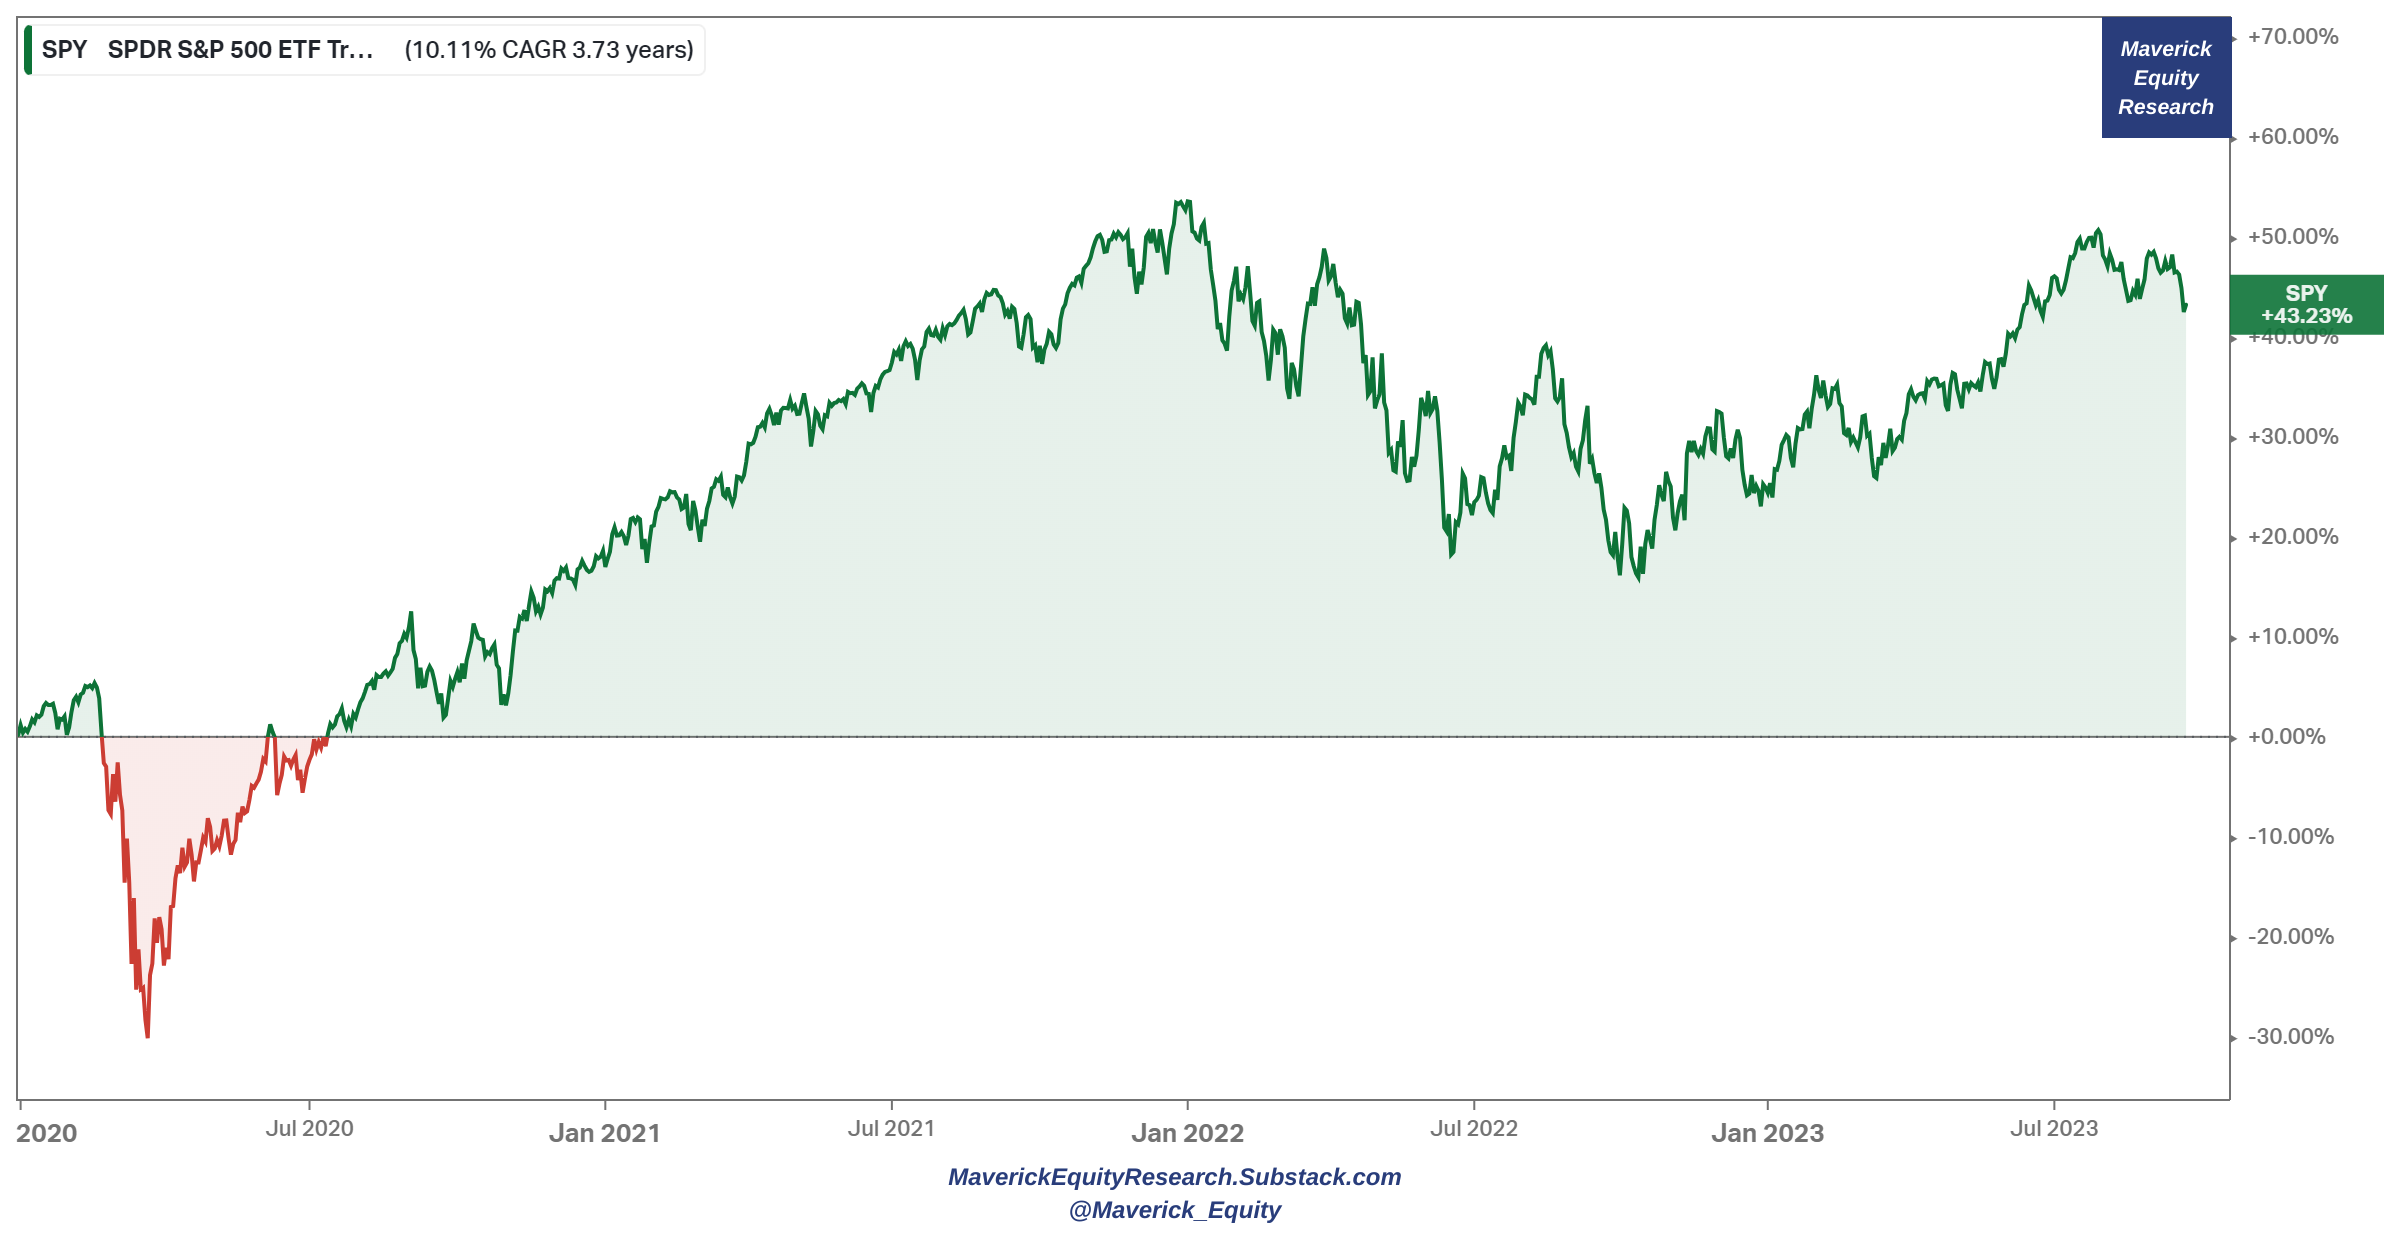
S&P 500 last 30 years: +1,700% return with 10% CAGR … compounding surely works …

👉 Since 2020 we had many outliers: a pandemic, ramping inflation & interest rates (from 0% to 5.5%), an energy crisis, some banks that went bust (Credit Suisse in Europe, SVB & FRC in USA), a worldwide bottled supply chain & a war in Europe.
A key question now: how did the S&P 500 do despite all that?
-
+43.23% = 10.11% CAGR to investors = very very good given the recent context!
-
Recall “The first rule of compounding: never interrupt it unnecessarily.” Munger
-
for that not to happen, one should have a solid plan, a good broker that does not charge them very high fees, and consider taxes when optimising own investments
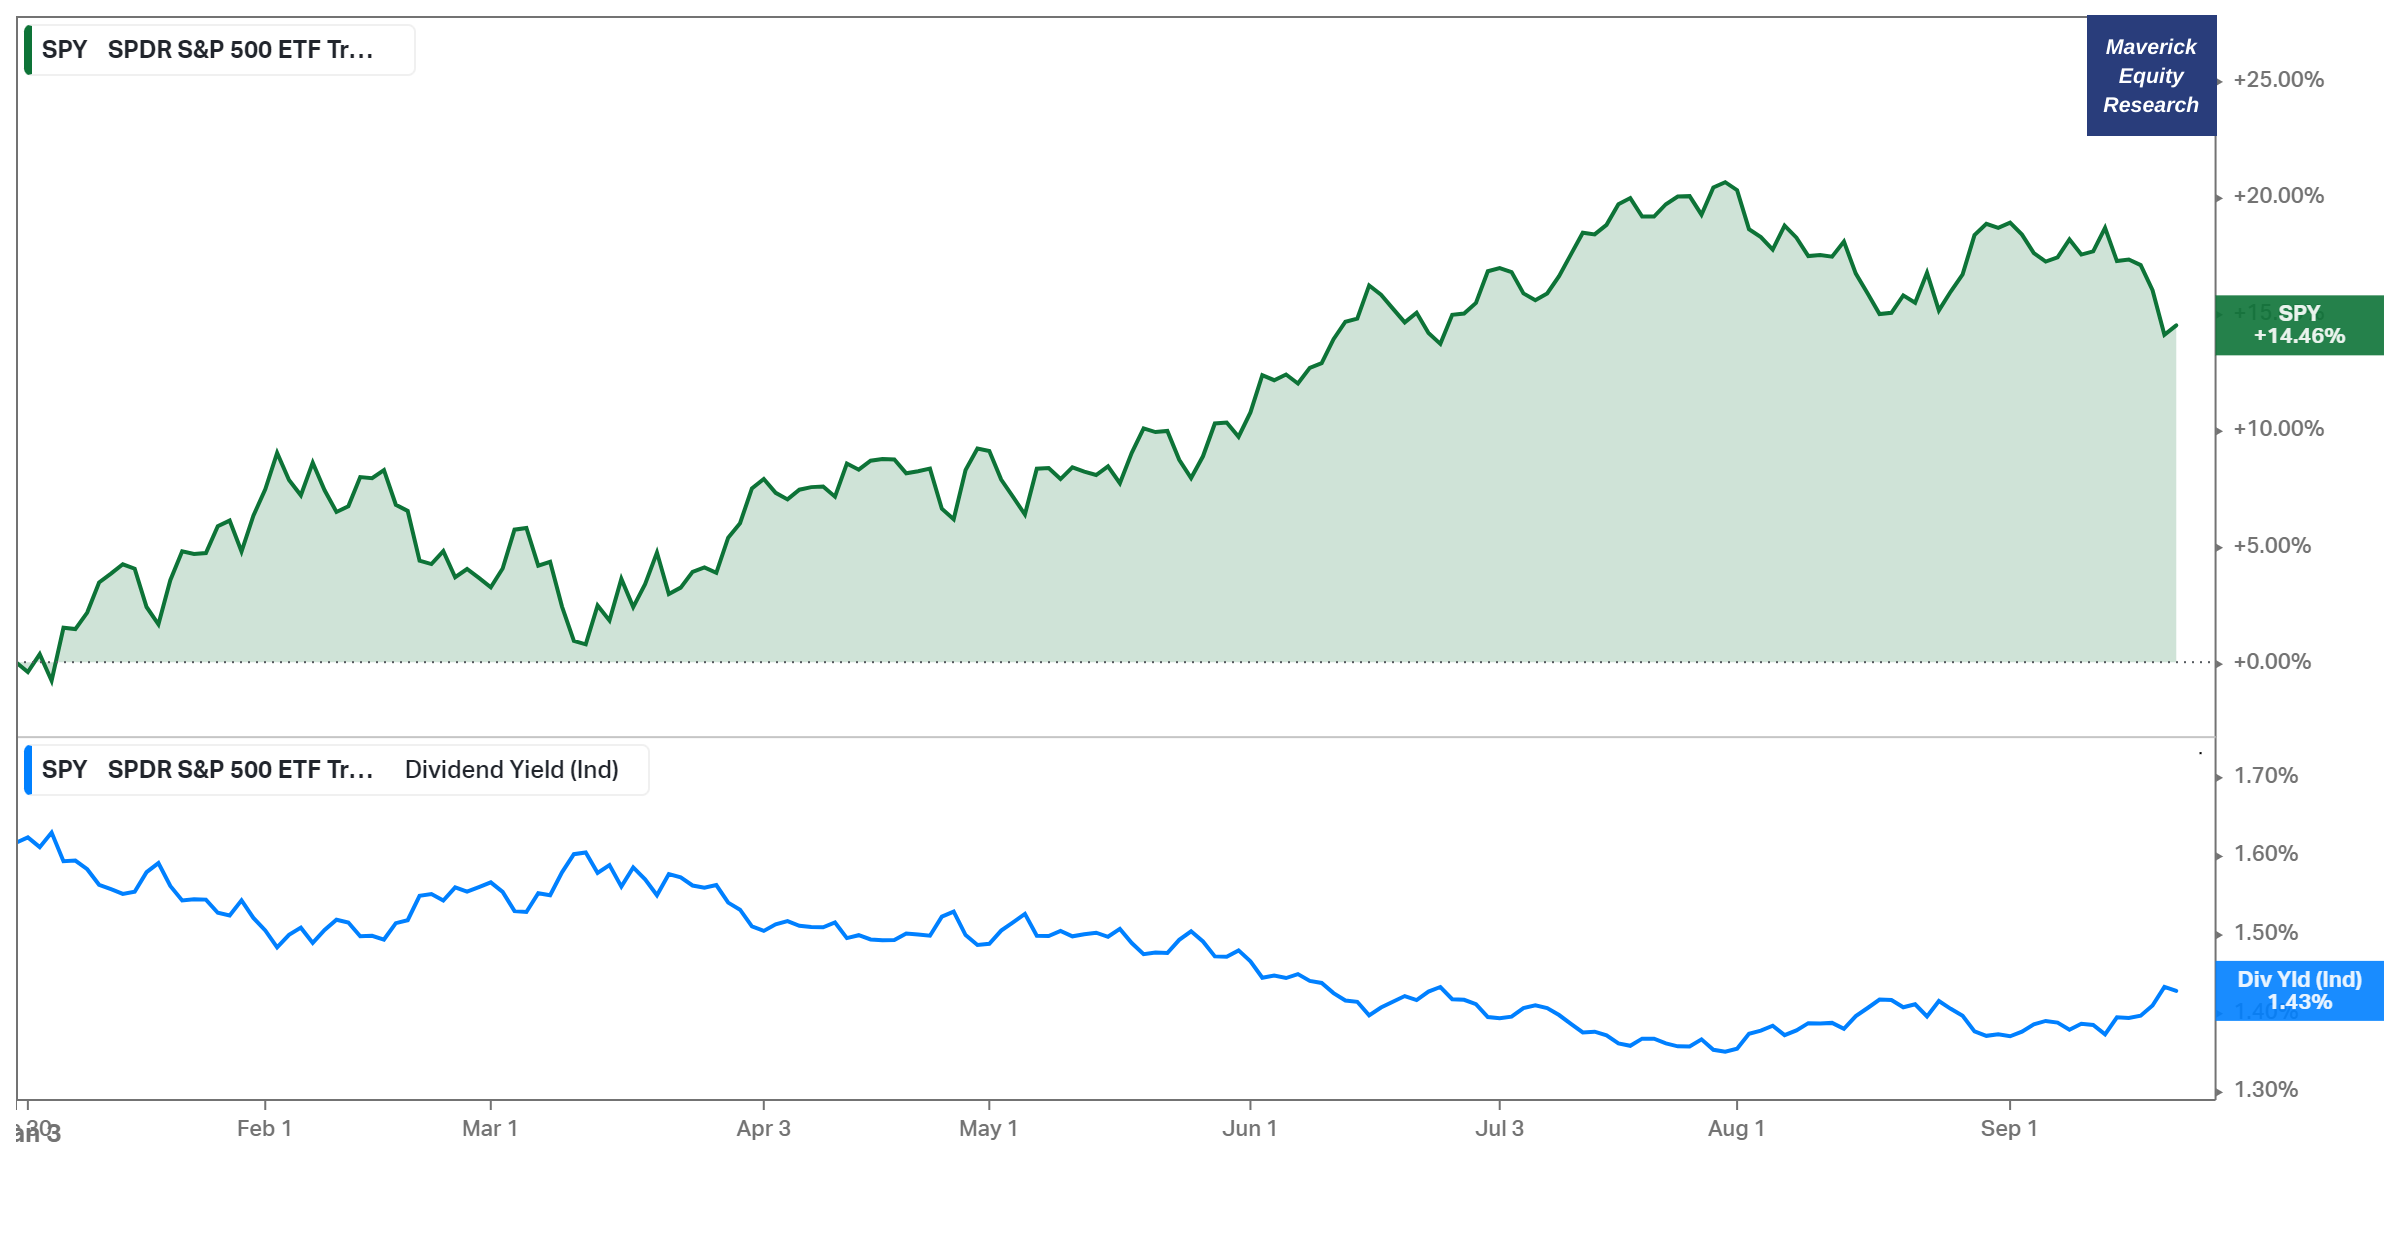
👉 2023 performance now: a great 14.46% with a dividend yield of 1.43%
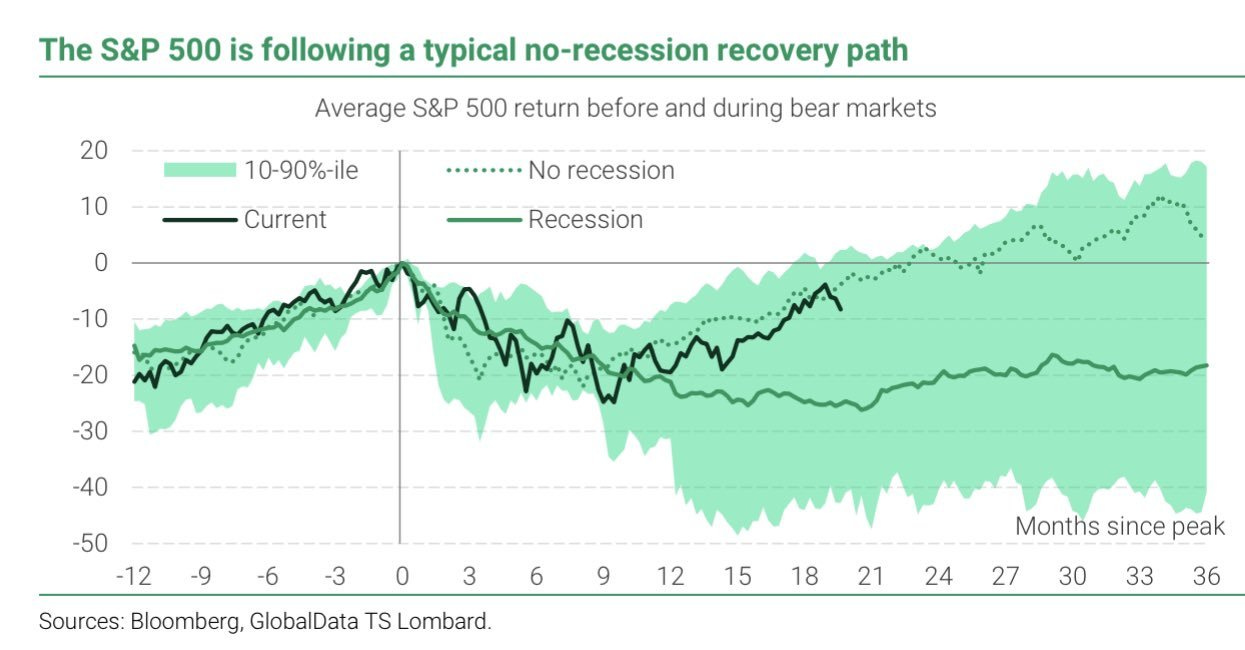
👉 Key note #1: after we had the 2022 bear market (biggest since the 2007-2009 GFC), it follows the typical no-recession recovery path currently
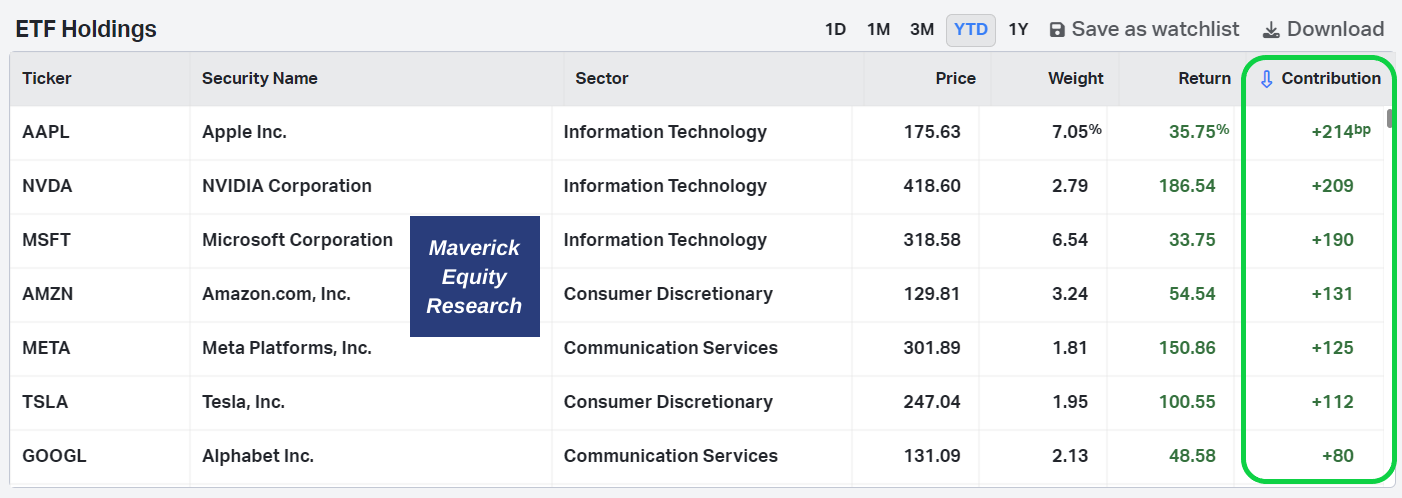
👉 Key note #2: 14.46% return is concentrated in a few names or more distributed?
-
2023 % returns & the holdings weightings

-
return attribution analysis tells us exactly that 10.61% (1061 b.p basis points) are due to just 7 stocks, the M7 (Magnificent Seven) tech stocks: Apple, Nvidia, Microsoft, Amazon, Meta/Facebook, Tesla & Google/Alphabet.
-
hence, 73.37% (10.61/14.46) of the 2023 performance is due to the M7 tech stocks
Let that sink in! And bring the sink if you feel like 😉
The laggards are the following 7 stocks: their weight is small in the index, but note that most of the individual returns are materially negative in 2023: Pfizer, Schwab, Bank of America, Nike, Dolla General and J&J as household names

The major M7 stocks positive contribution is also showcased via the returns of the weighted (SPY) VS equal weighted (RSP)! The weighted SPY outperforming big time!
-
note that it started in March when the recent AI breakthroughs & narrative took over completely the center stage
-
I am quite certain that there will be big AI winners in the next 5-20 years, though also certain that many will pump their AI capabilities and real world use cases, hence hype is almost a given, hence down the road many will naturally deflate…

👉 now let’s ignore weighting and switch to the S&P 500 unweighted components via the following 2D chart: 2023 % returns & Above 52-Week Low %: Nvidia the mega outlier after the recent AI driven parabolic run, followed by Meta & Tesla
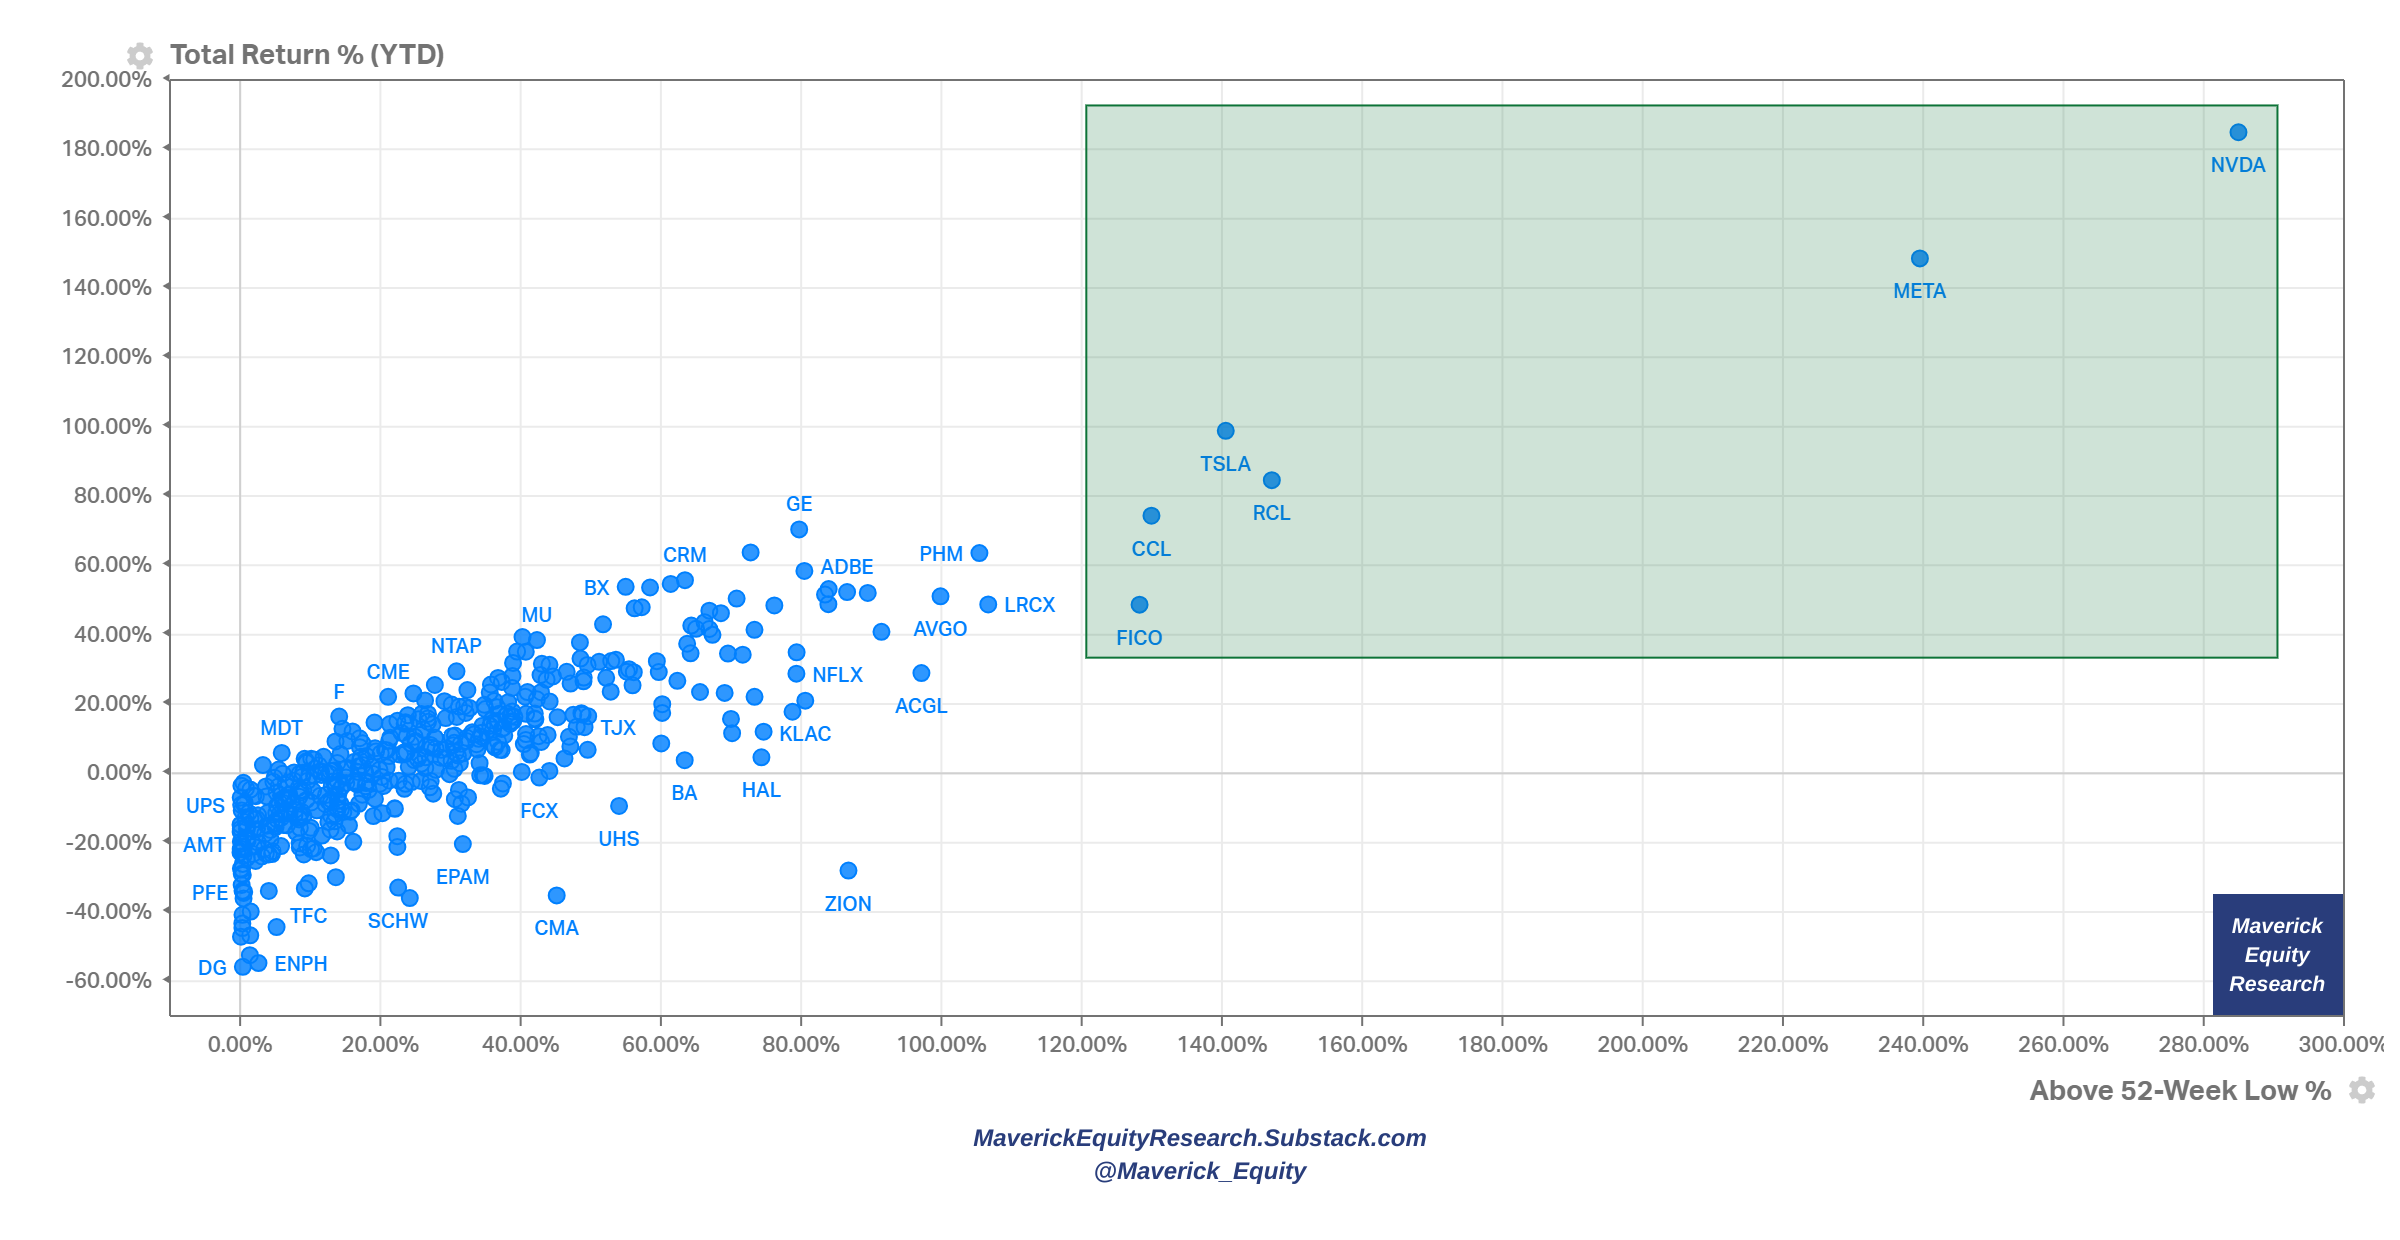
Complementary by single names in the 11 sectors and 24 industries, size = market cap

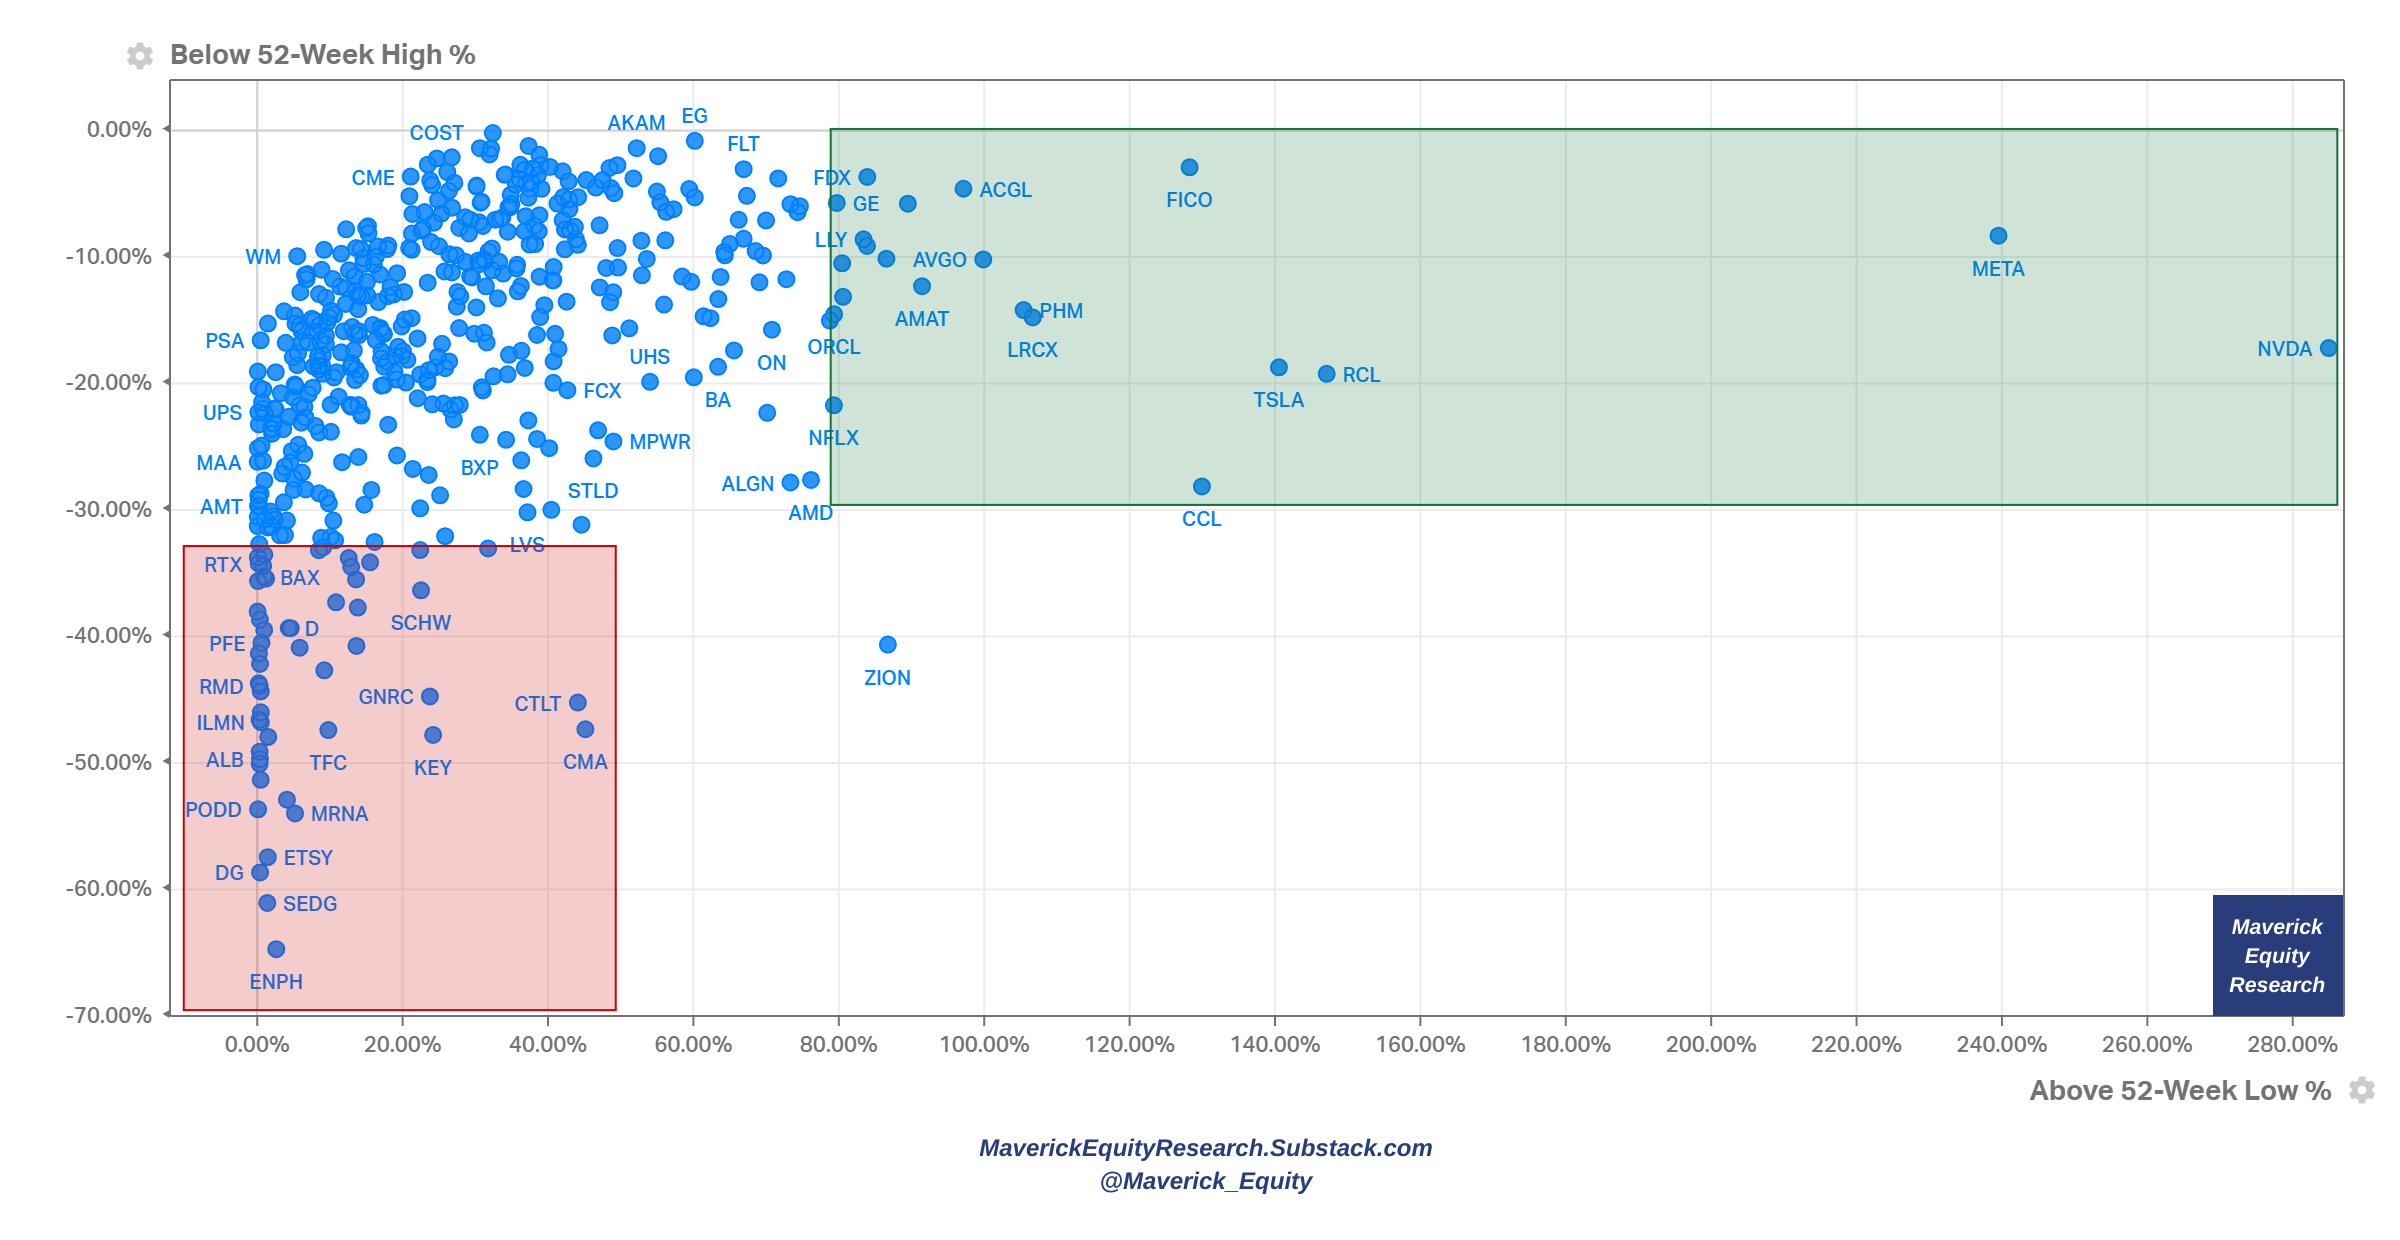
👉 continuing smoothly with the S&P 500 stocks above their 52-week lows & below their 52-week highs as my quick way to see both positive & negative momentum
-
if you see some of your names in one of the extremes, it’s interesting to relate to the other close clusters, peers or market overall and derive insight from there
📊 Earnings, Profitability, Flows, Value & Growth
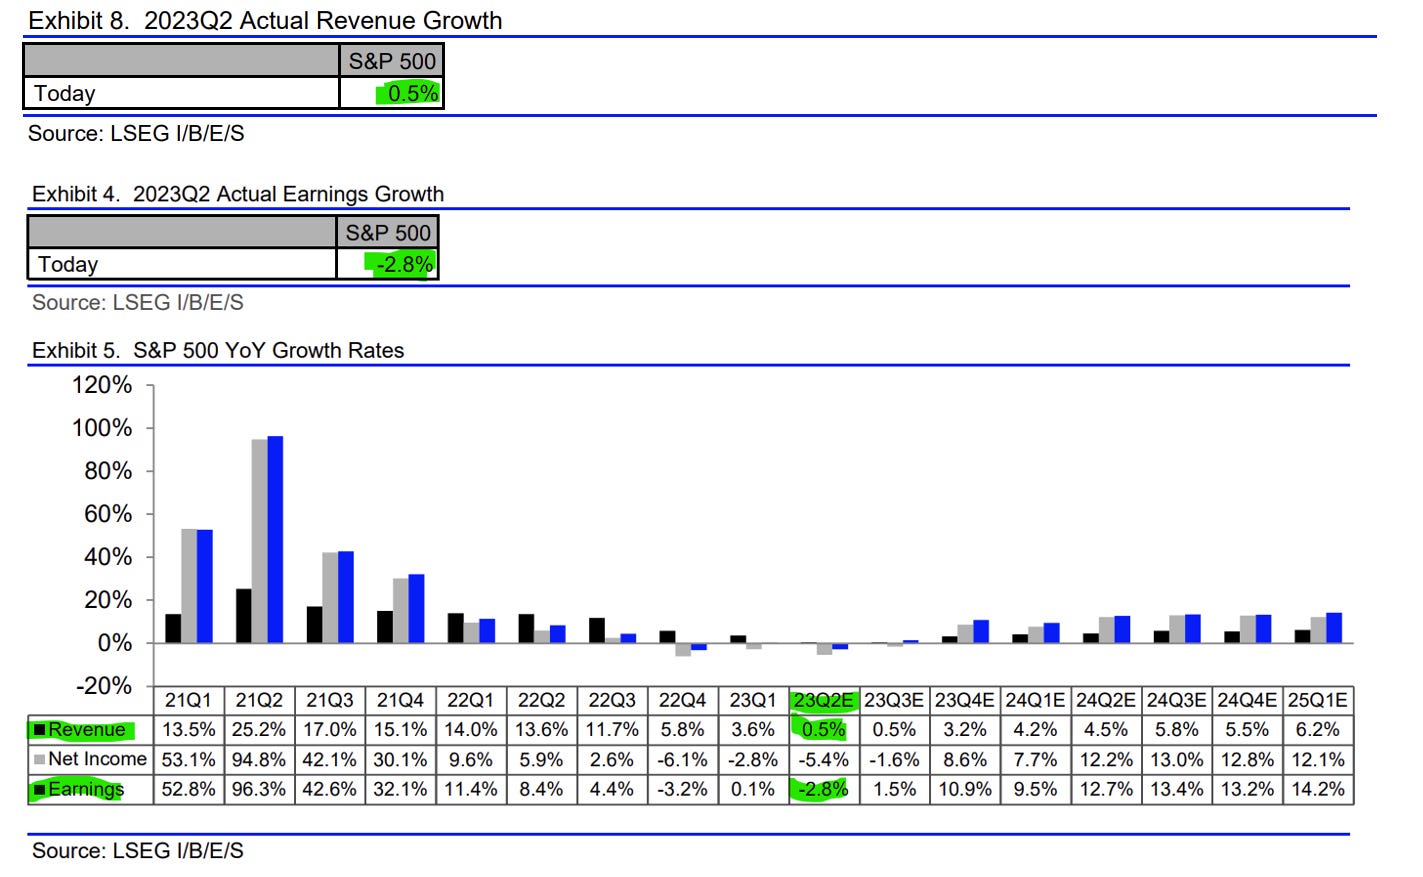
👉 2023 Q2 earnings season:
-
revenue growth +0.5% going against the most anticipated recession ever talks
-
earnings growth -2.8% which is expected to be back positive in Q3 and taking off starting with Q4 … that is rather too optimistic in my view, but still I see expect decent positive developments earnings wise
👉 Profitability:
S&P 500 Net Profit Margins (ex-Financials & Energy) sequentially improving lately

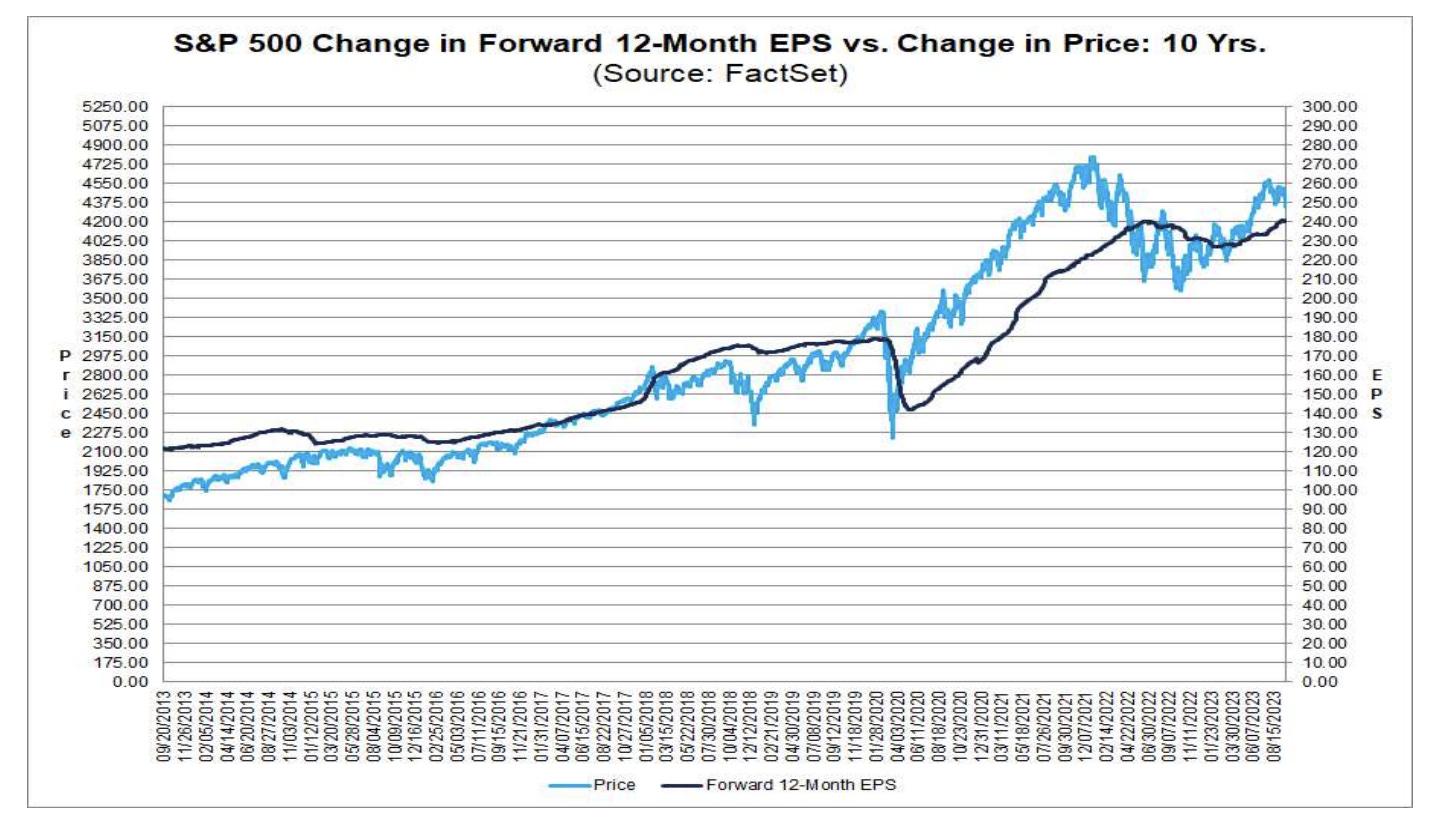
S&P 500 EPS (earnings per share) forward 12-month & price
-
back to earth & more aligned after the FED (and fiscal policy) induced parabolic run once the Covid outbreak
-
when stock prices go way above earnings/EPS consider getting cautious …
-
fundamentals matter always sooner or later. In the end it is all about earnings I heard on the street …
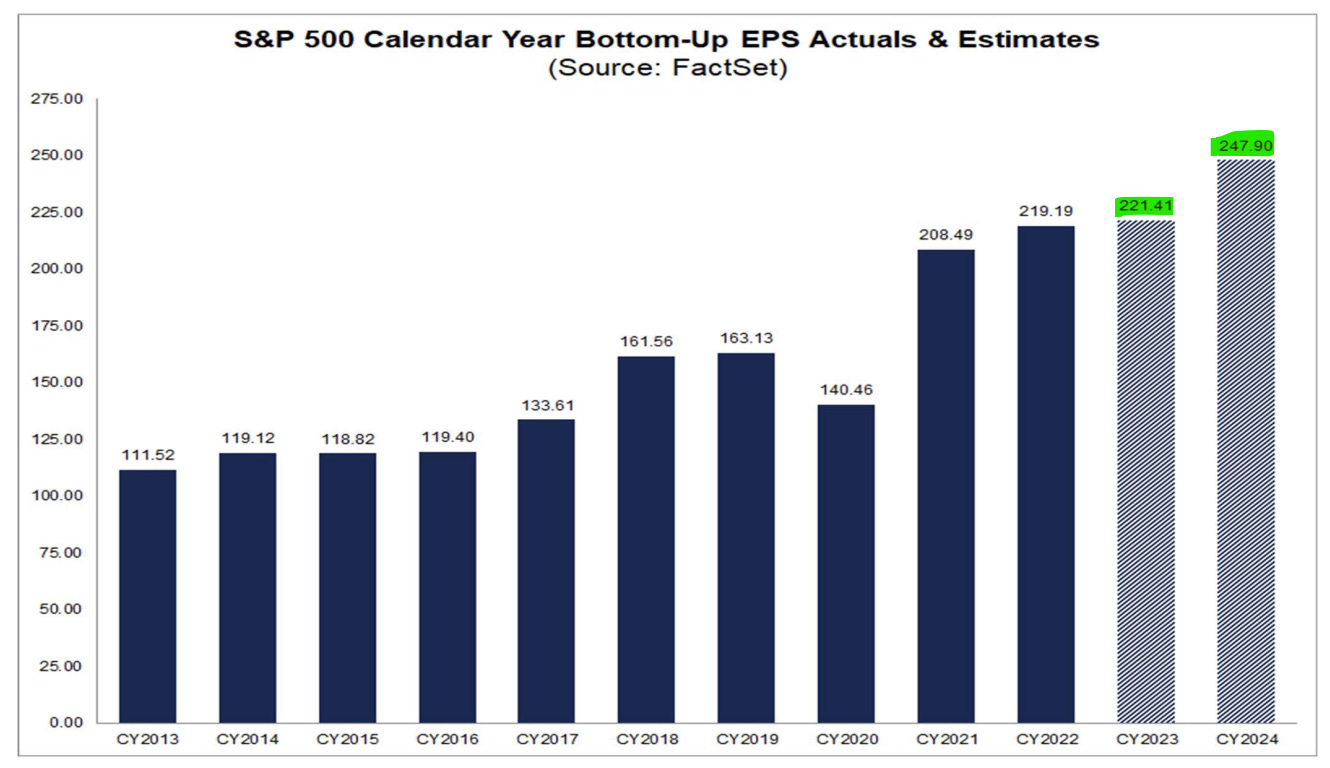
Complementary, the S&P 500 EPS Actuals & Estimates via consensus bottom-up:
-
221 for 2023 & 247 for 2023. No earnings recession on the horizon …
👉 Industry analysts median forecast +19.0% return in the next 12 months
-
imo likely too optimistic, I target for less & would be surely happy with less as well
Side personal note here, in investing (but not only):
-
better to have less expectations than high ones, if results are higher than it’s just a very nice and welcomed surprise
-
key to be realistic: would be great another 19% to compound on top of the 14.46% this year, but it will be tough with high interest rates which are seen now as they will be ‘higher for longer’ among other reasons
-
as you might have noticed, true and genuine research aims to stay grounded and withing what’s realistically possible: this is not a ‘trading room’, not a place where people are lured in for ‘multi-baggers’ ‘generational wealth’ ‘10-100x your money’ and get rich quick schemes … plenty of scams and places like that out there…

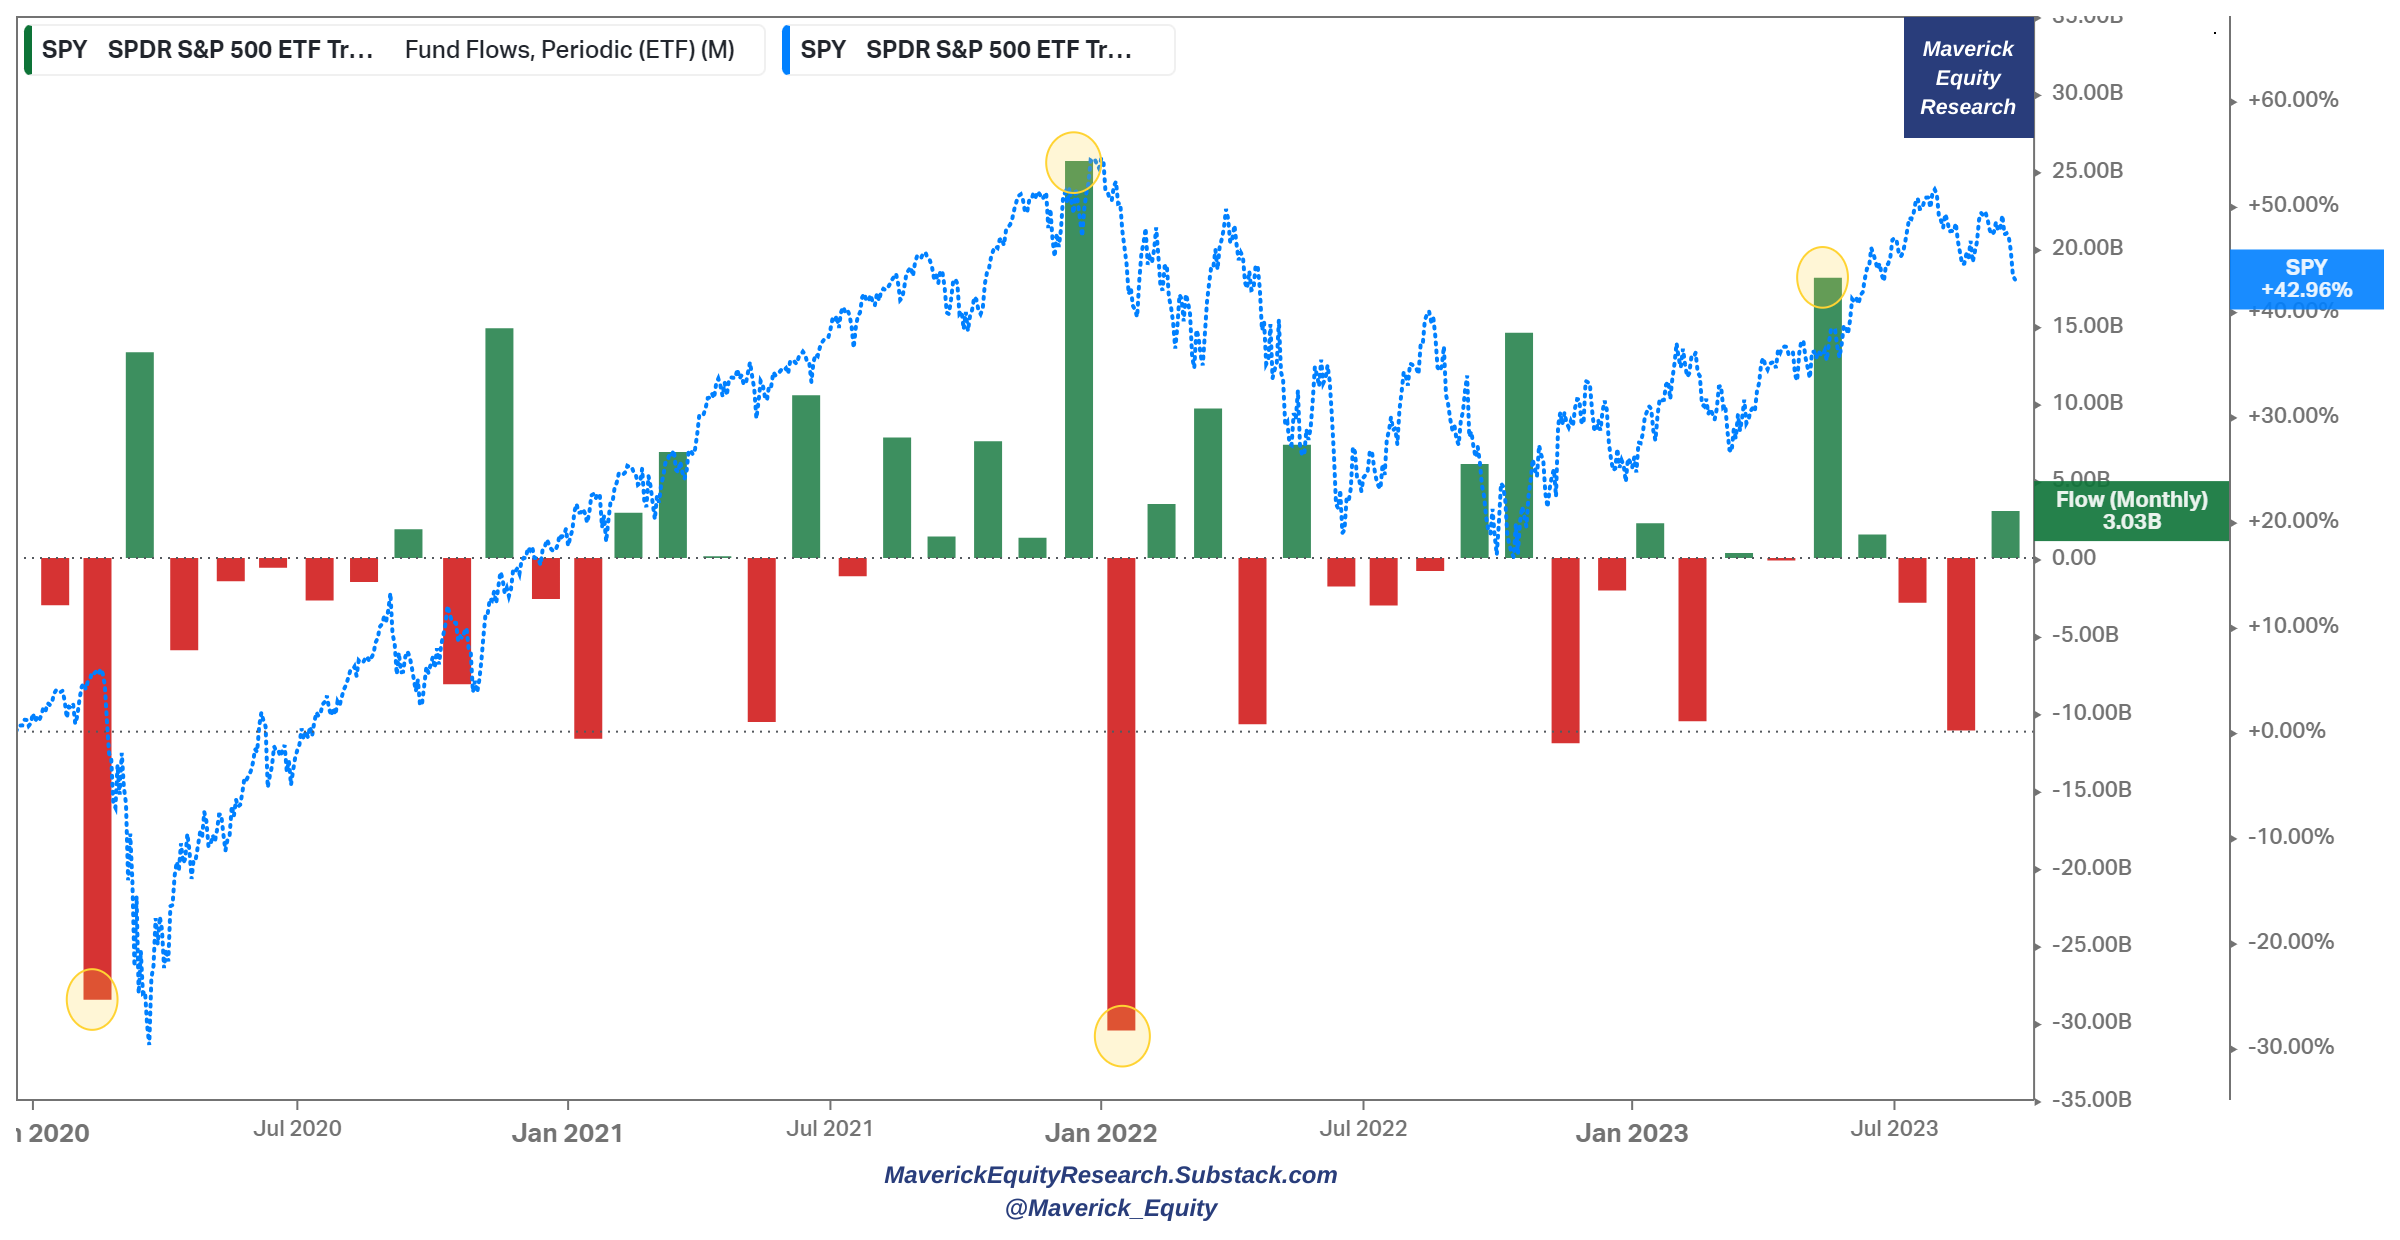
👉 S&P 500 (SPY) monthly financial flows (green/red) & total return (blue) since 2020:
-
2020 Covid crash: -$28.5bn in February, +$13.3bn with the March sharp rebound
-
2022 bear market: +$25.6bn in Dec 2021 right at the top, -$30.5bn in Jan 2022 to start the bear market and even bigger than the Covid crash, hence big outflows outliers are a good metric to watch for
-
2023: +$18bn in May as this time it was NOT sell in May and go away because they were bigger even than the October +$14.5bn local bottom which told us there is another leg higher in the 2023 rebound
Going forward, I do not expect extreme outflows nor inflows which are to be watched as reasoned above, while I aim for positive inflows in December for a Christmas rally.
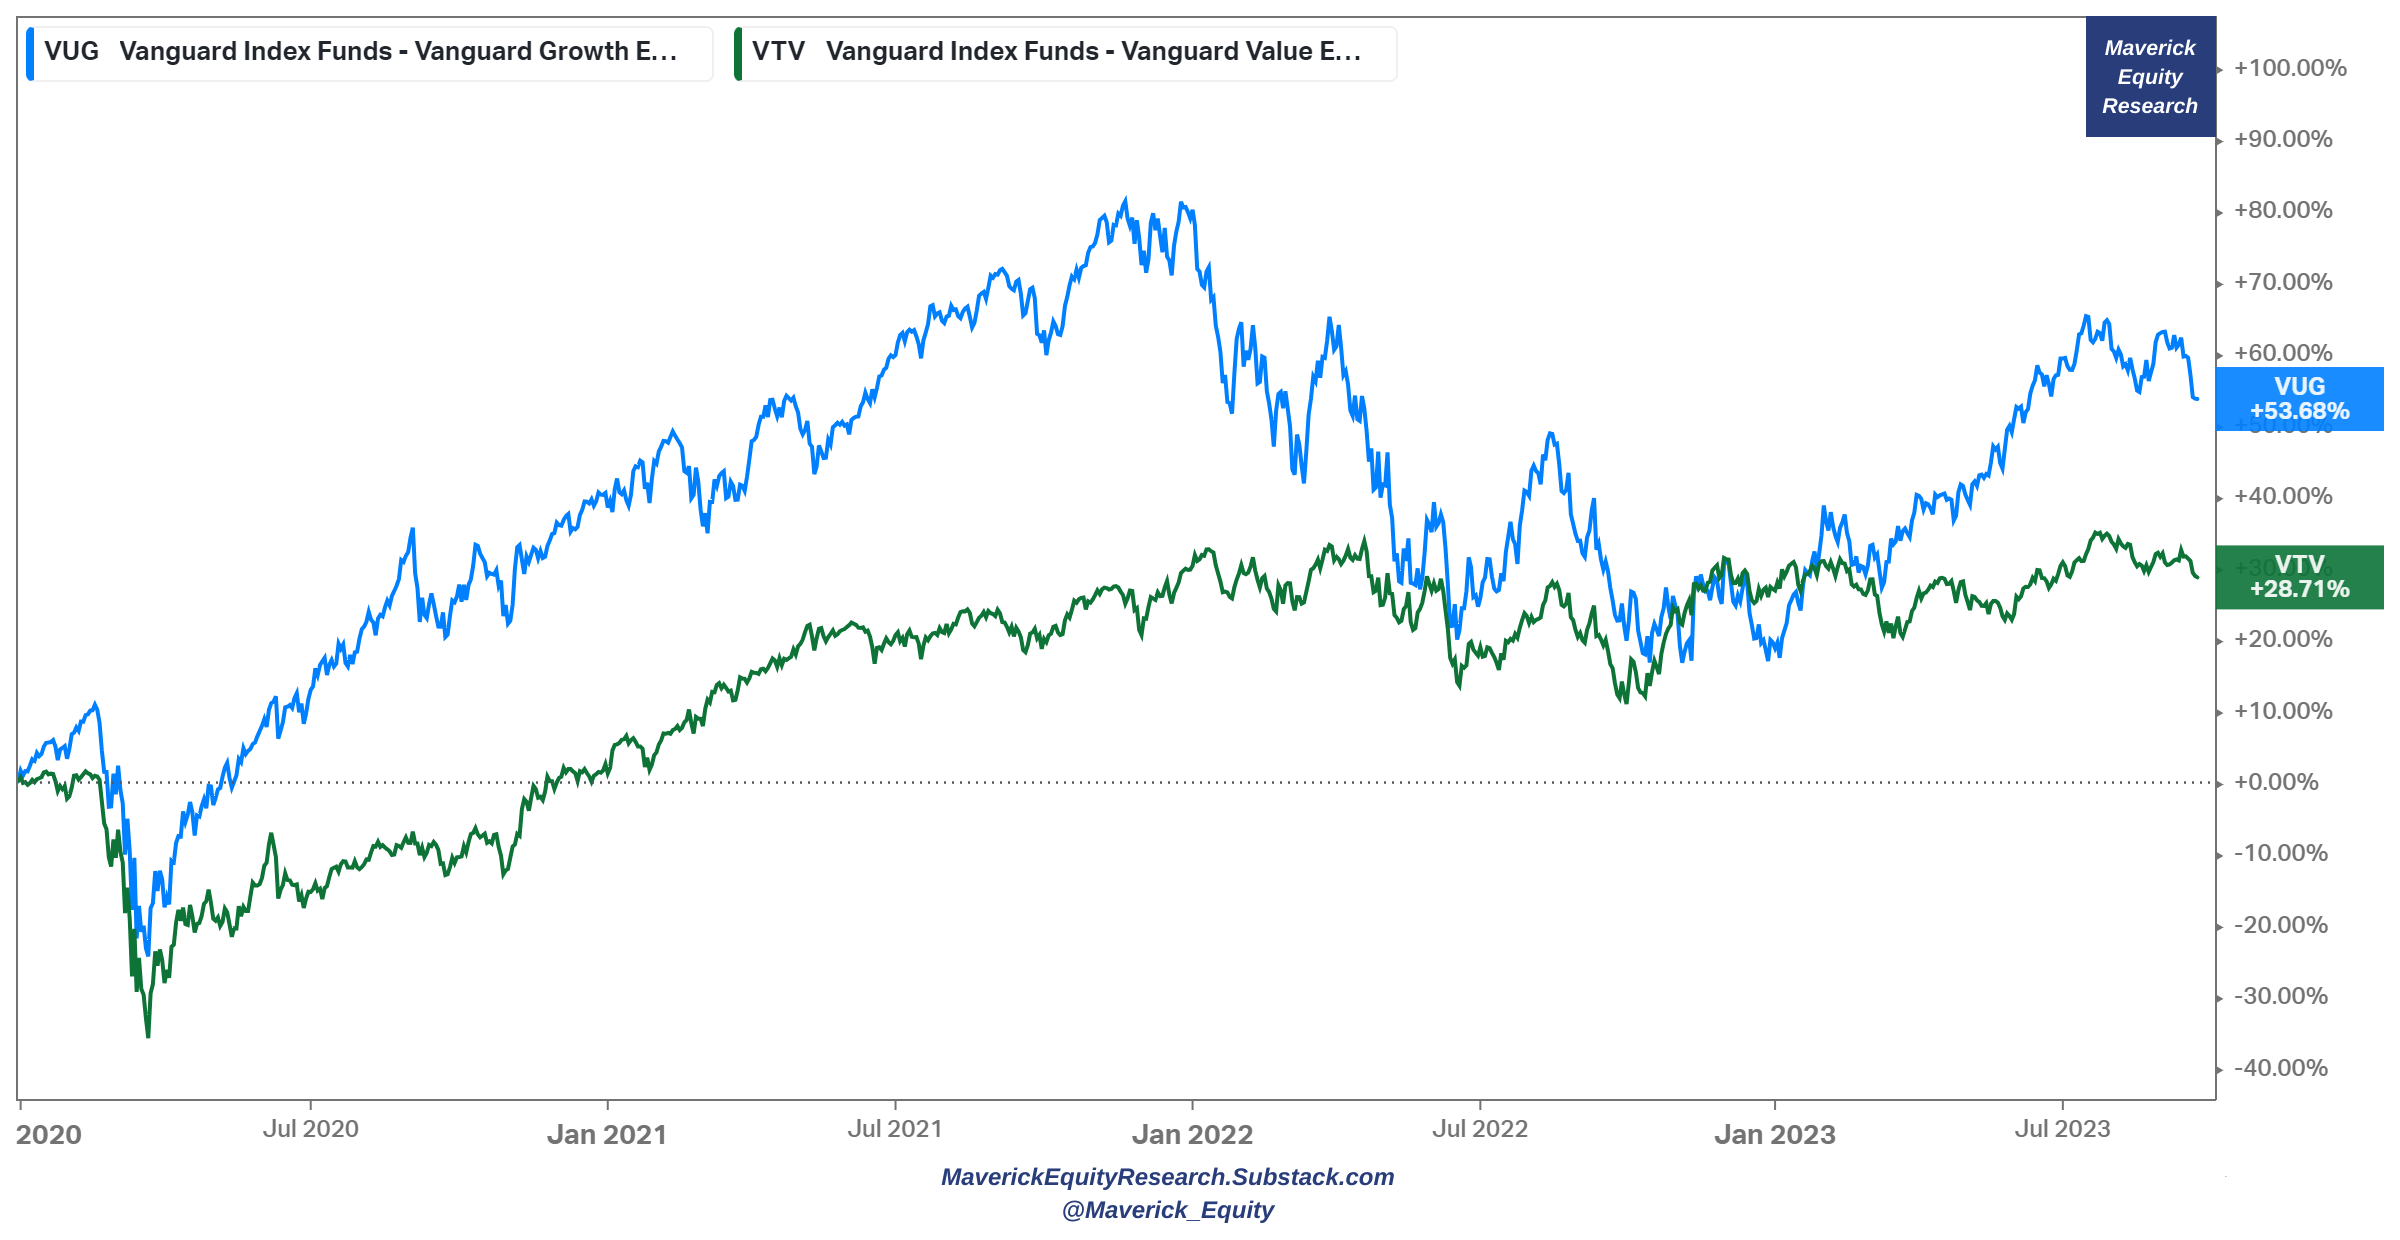
👉 Value & Growth via the investing styles lens:
-
VUG growth (blue) +28.53% rally while VTV value (green) with just +1.24%

3-year timeframe: we see how value VTV value (green) did match VTG growth (VUG) for a good part of the 2022 bear market, now Growth is back big via the AI driven run!
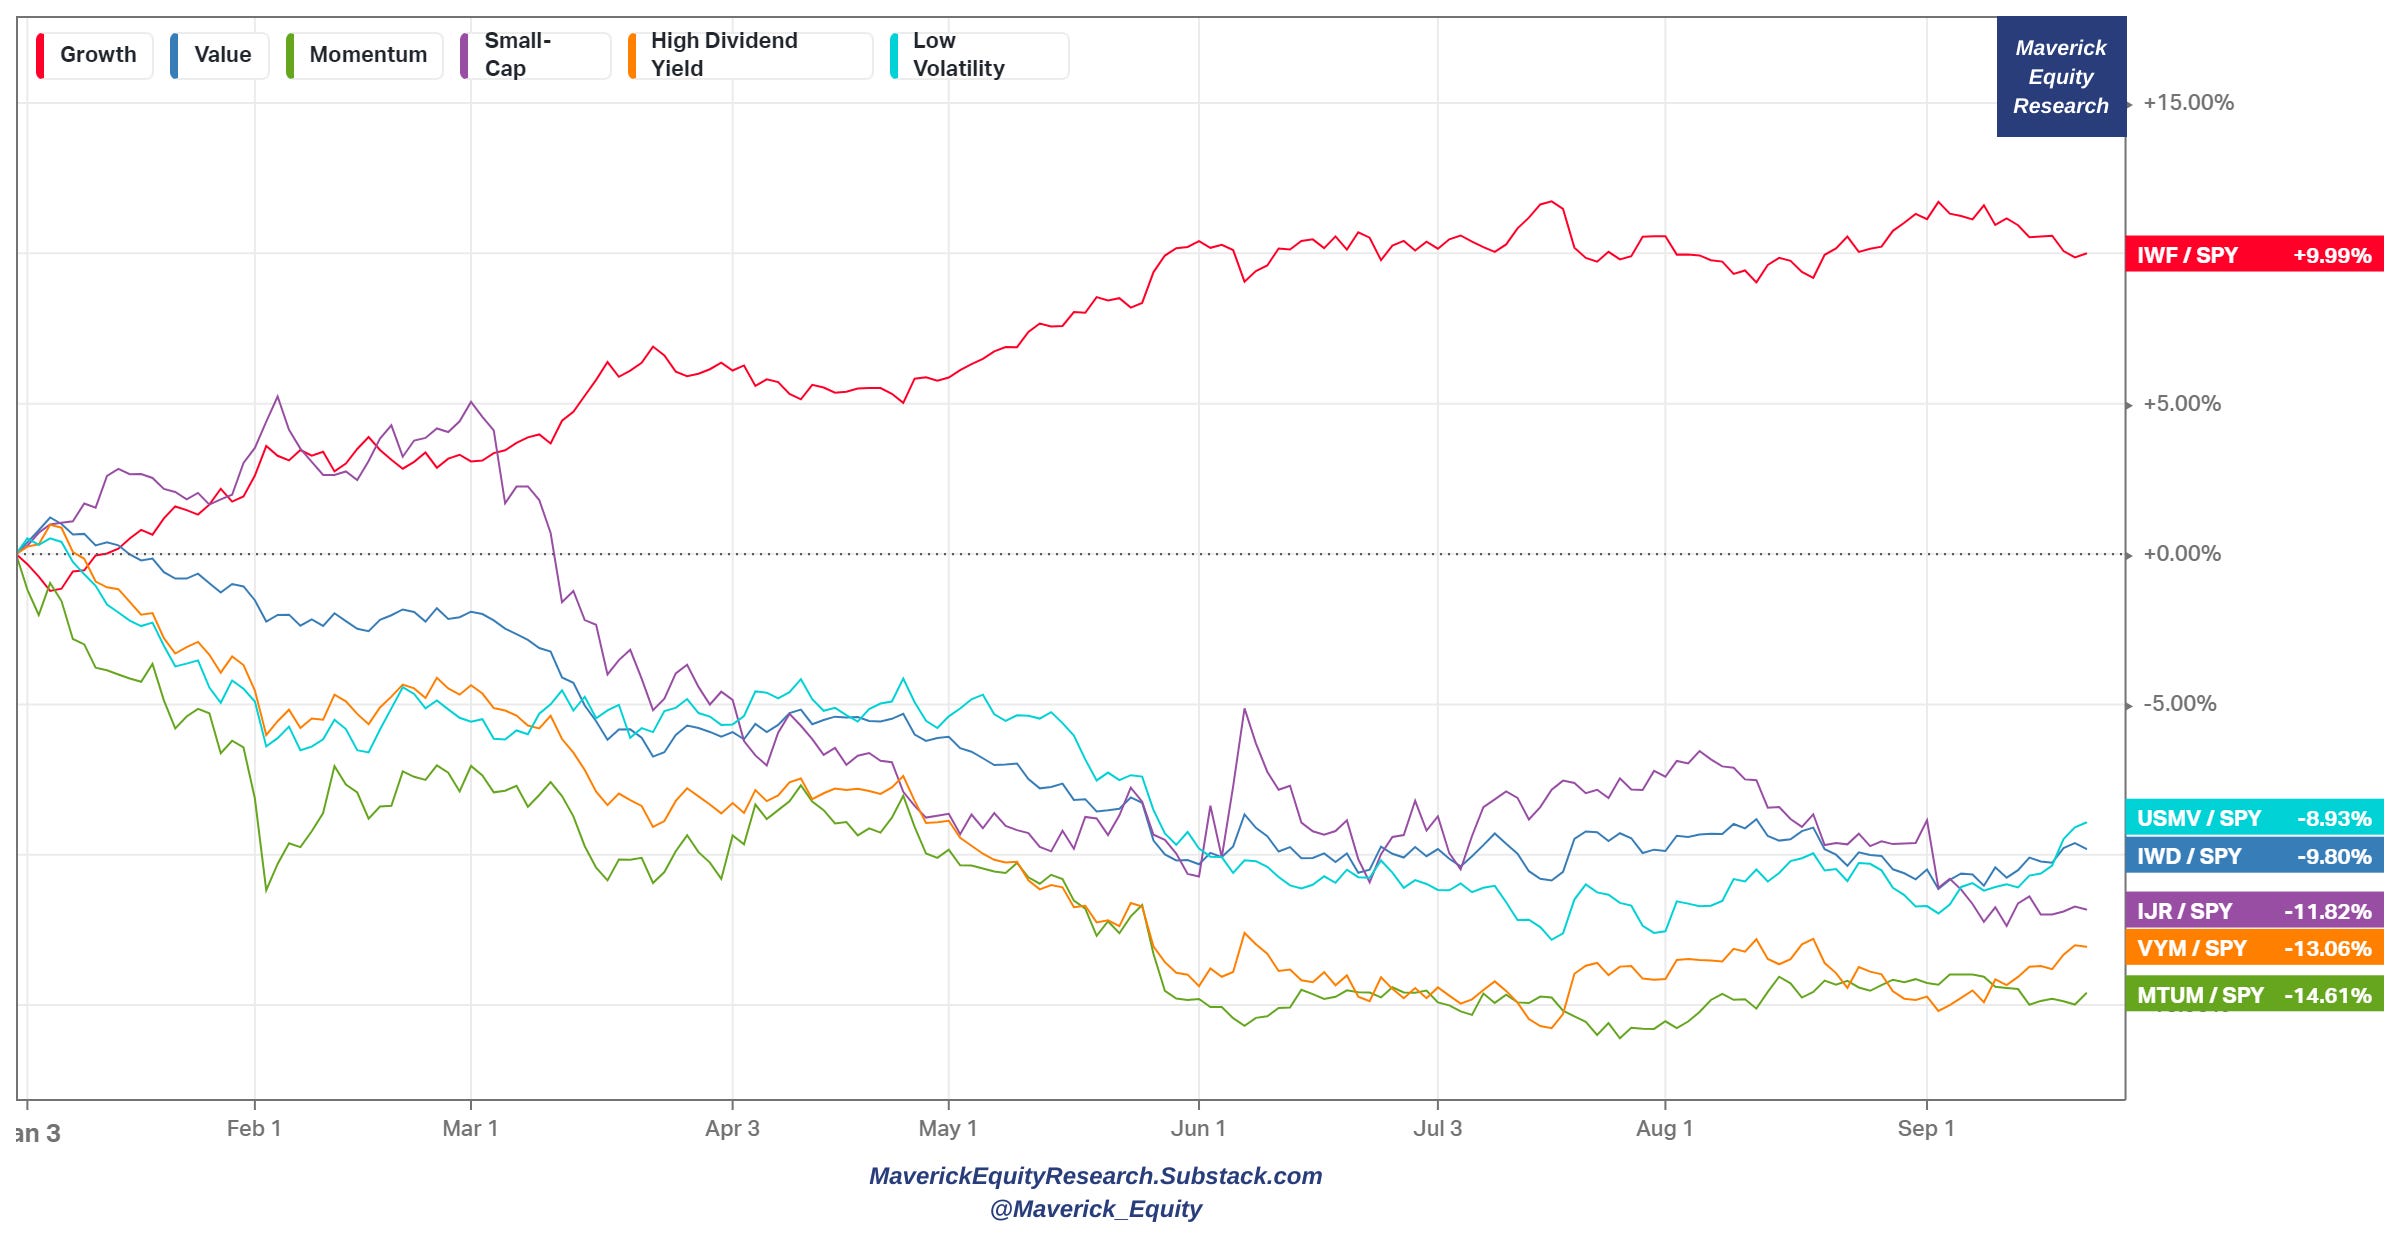
More nuance via factors: growth (IWF) leading & momentum (MTUM) lagging in 2023
📊 The 11 Sectors Performance Breakdown
👉 2023 performance of the 11 Sectors that shape the S&P 500:
-
XLC (Communications) & XLK (Tech) & XLY (Consumer Discretionary) leading
-
46% huge spread between the Top & Bottom sectors which is very rare to see: XLC (Communications) + 37.7% while Utilities (XLU) -8.49%

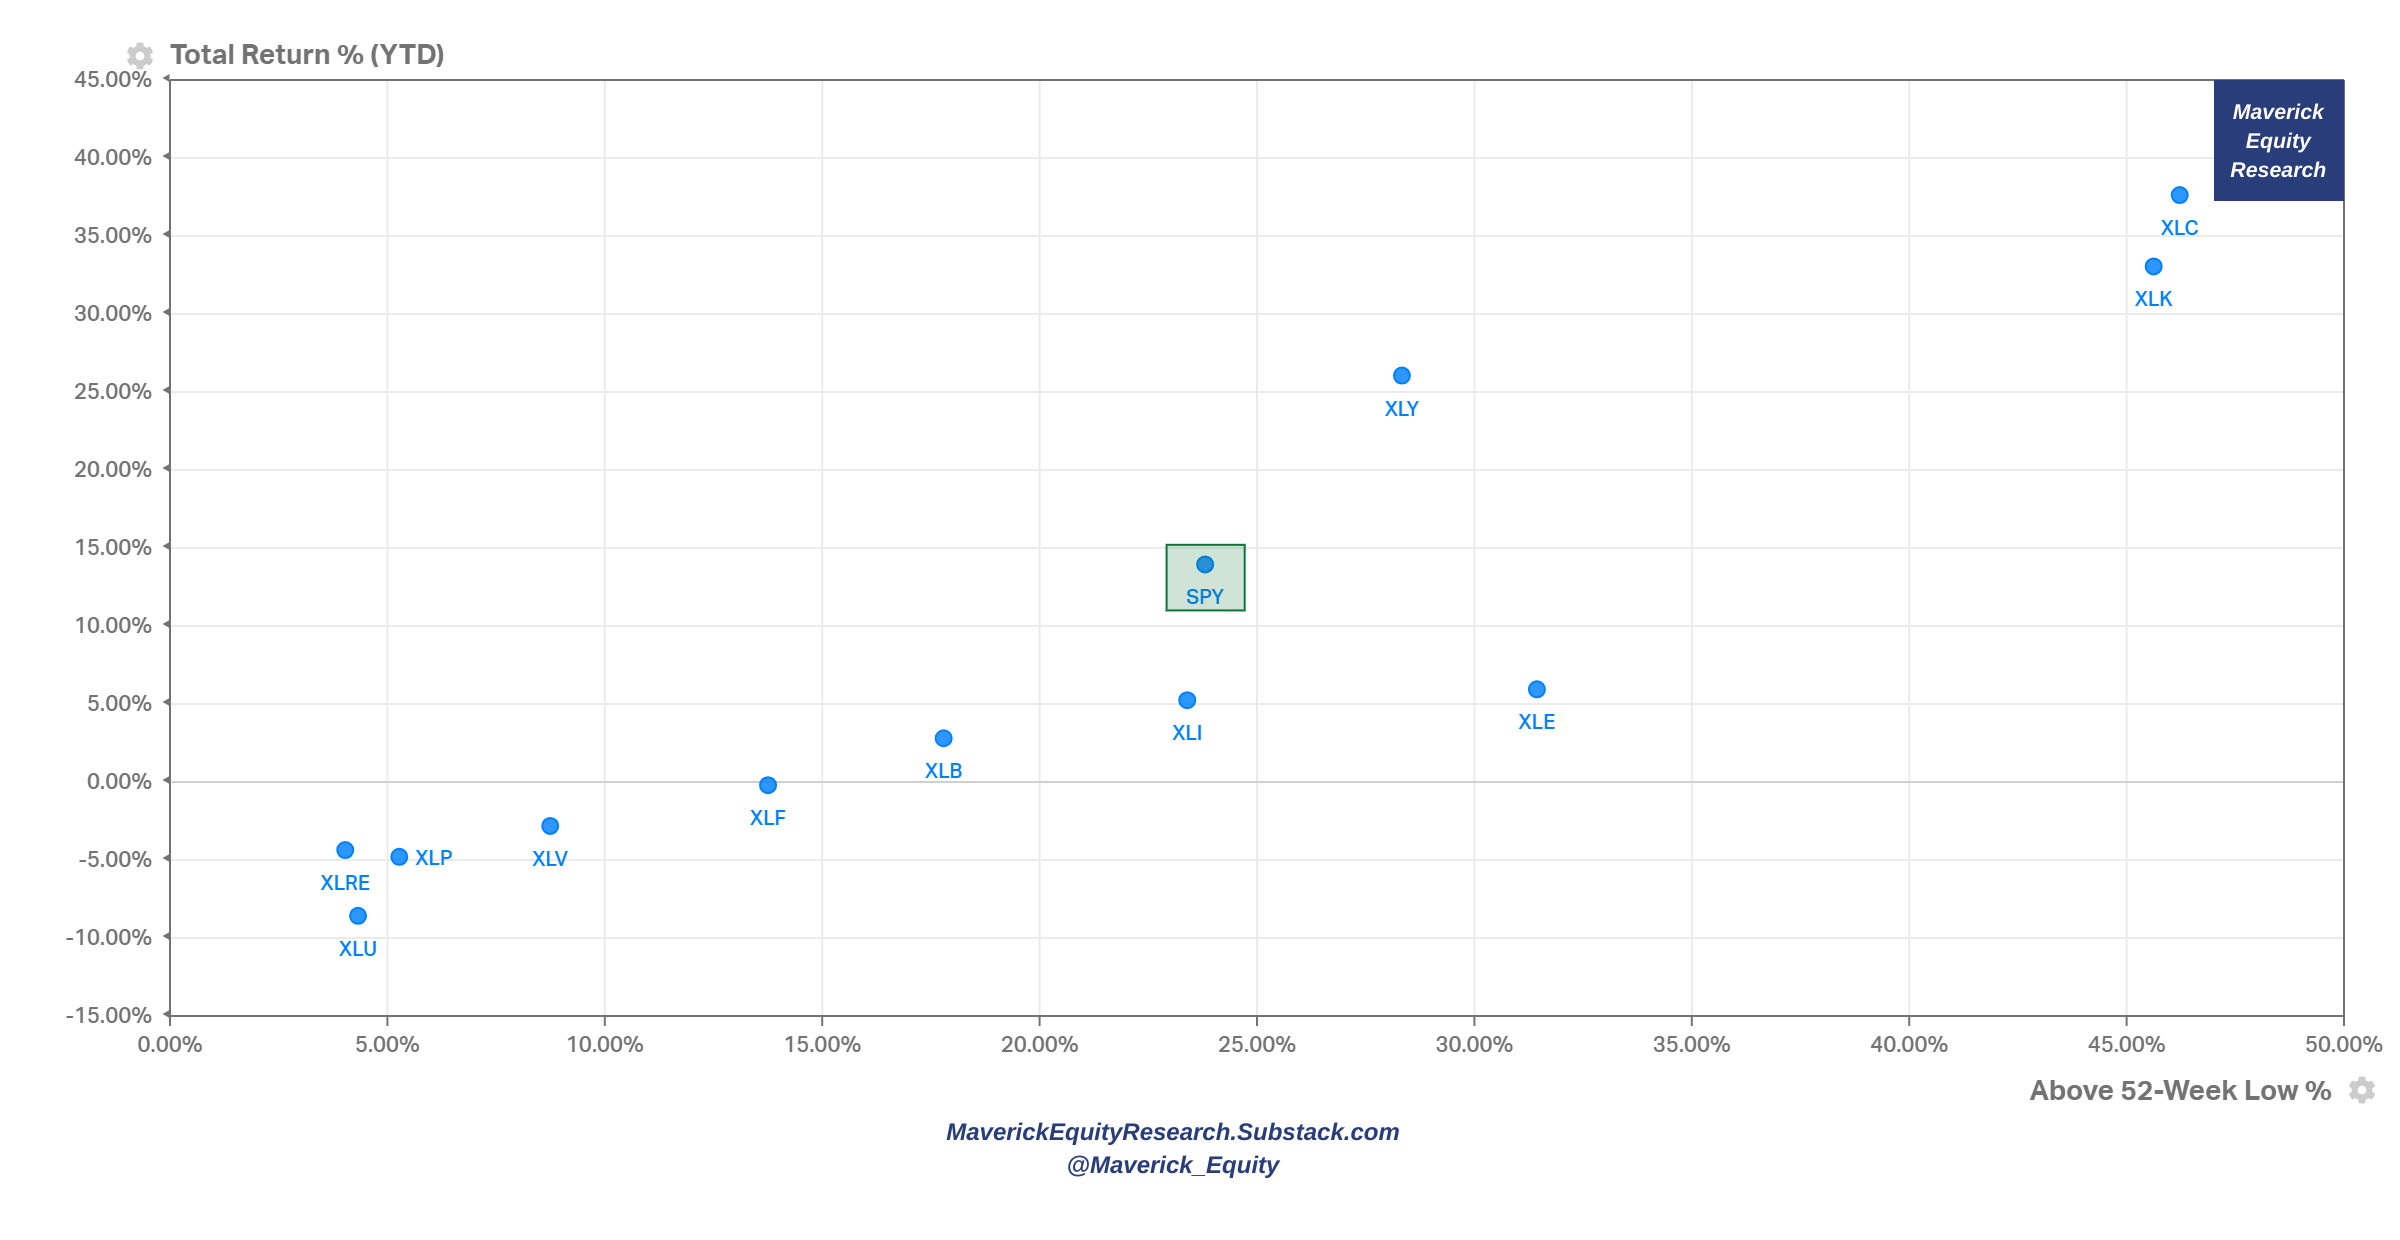
👉 The 11 Sectors + S&P500 itself (SPY) with 2023 % returns & Above 52-Week Low % for an extra dimension and same key message:
-
XLK, KLC & XLY also with the momentum from their 52-week lows
-
note, energy is bouncing back also from the 52-week lows
👉 Sectors rotation graph for relative strength & momentum dimensions:
-
Energy (XLE) leading while note the weaking Tech (XLK)

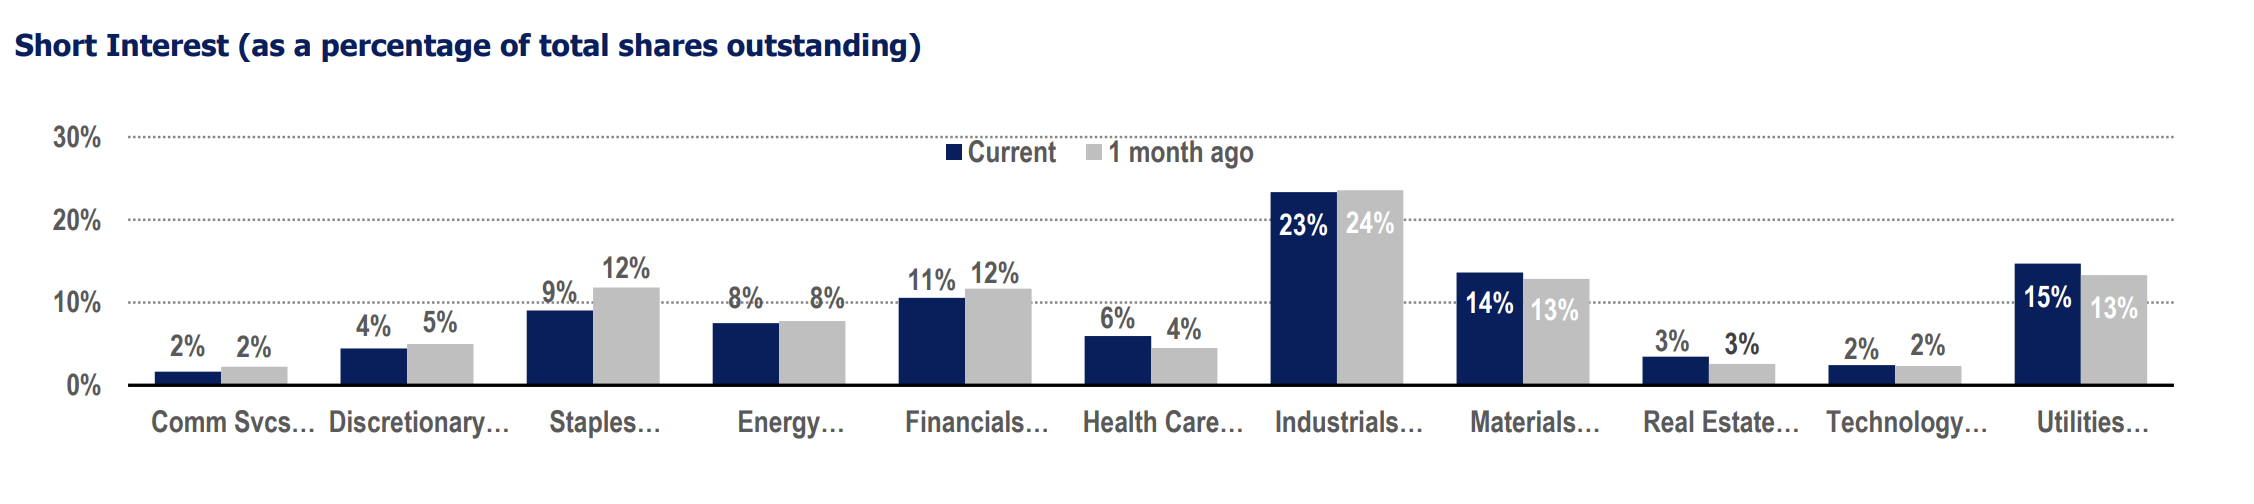
👉 Short Interest breakdown for the 11 sectors: Industrials (XLI) the most shorted, Tech (XLK) and Communication Services (XLC) the least
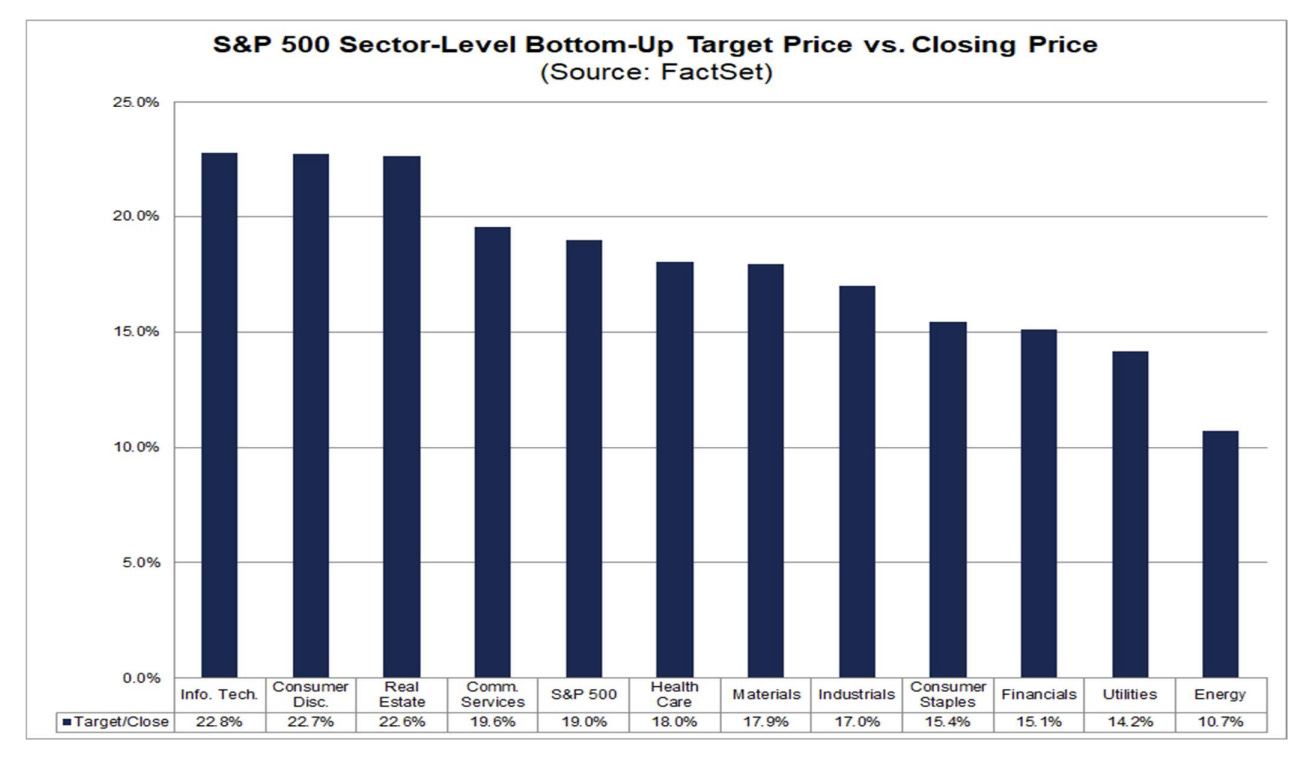
👉 Industry analysts 12 month median forecast / target price for the 11 sectors:
-
Tech (XLK) the most optimistic while Energy (XLE) the least
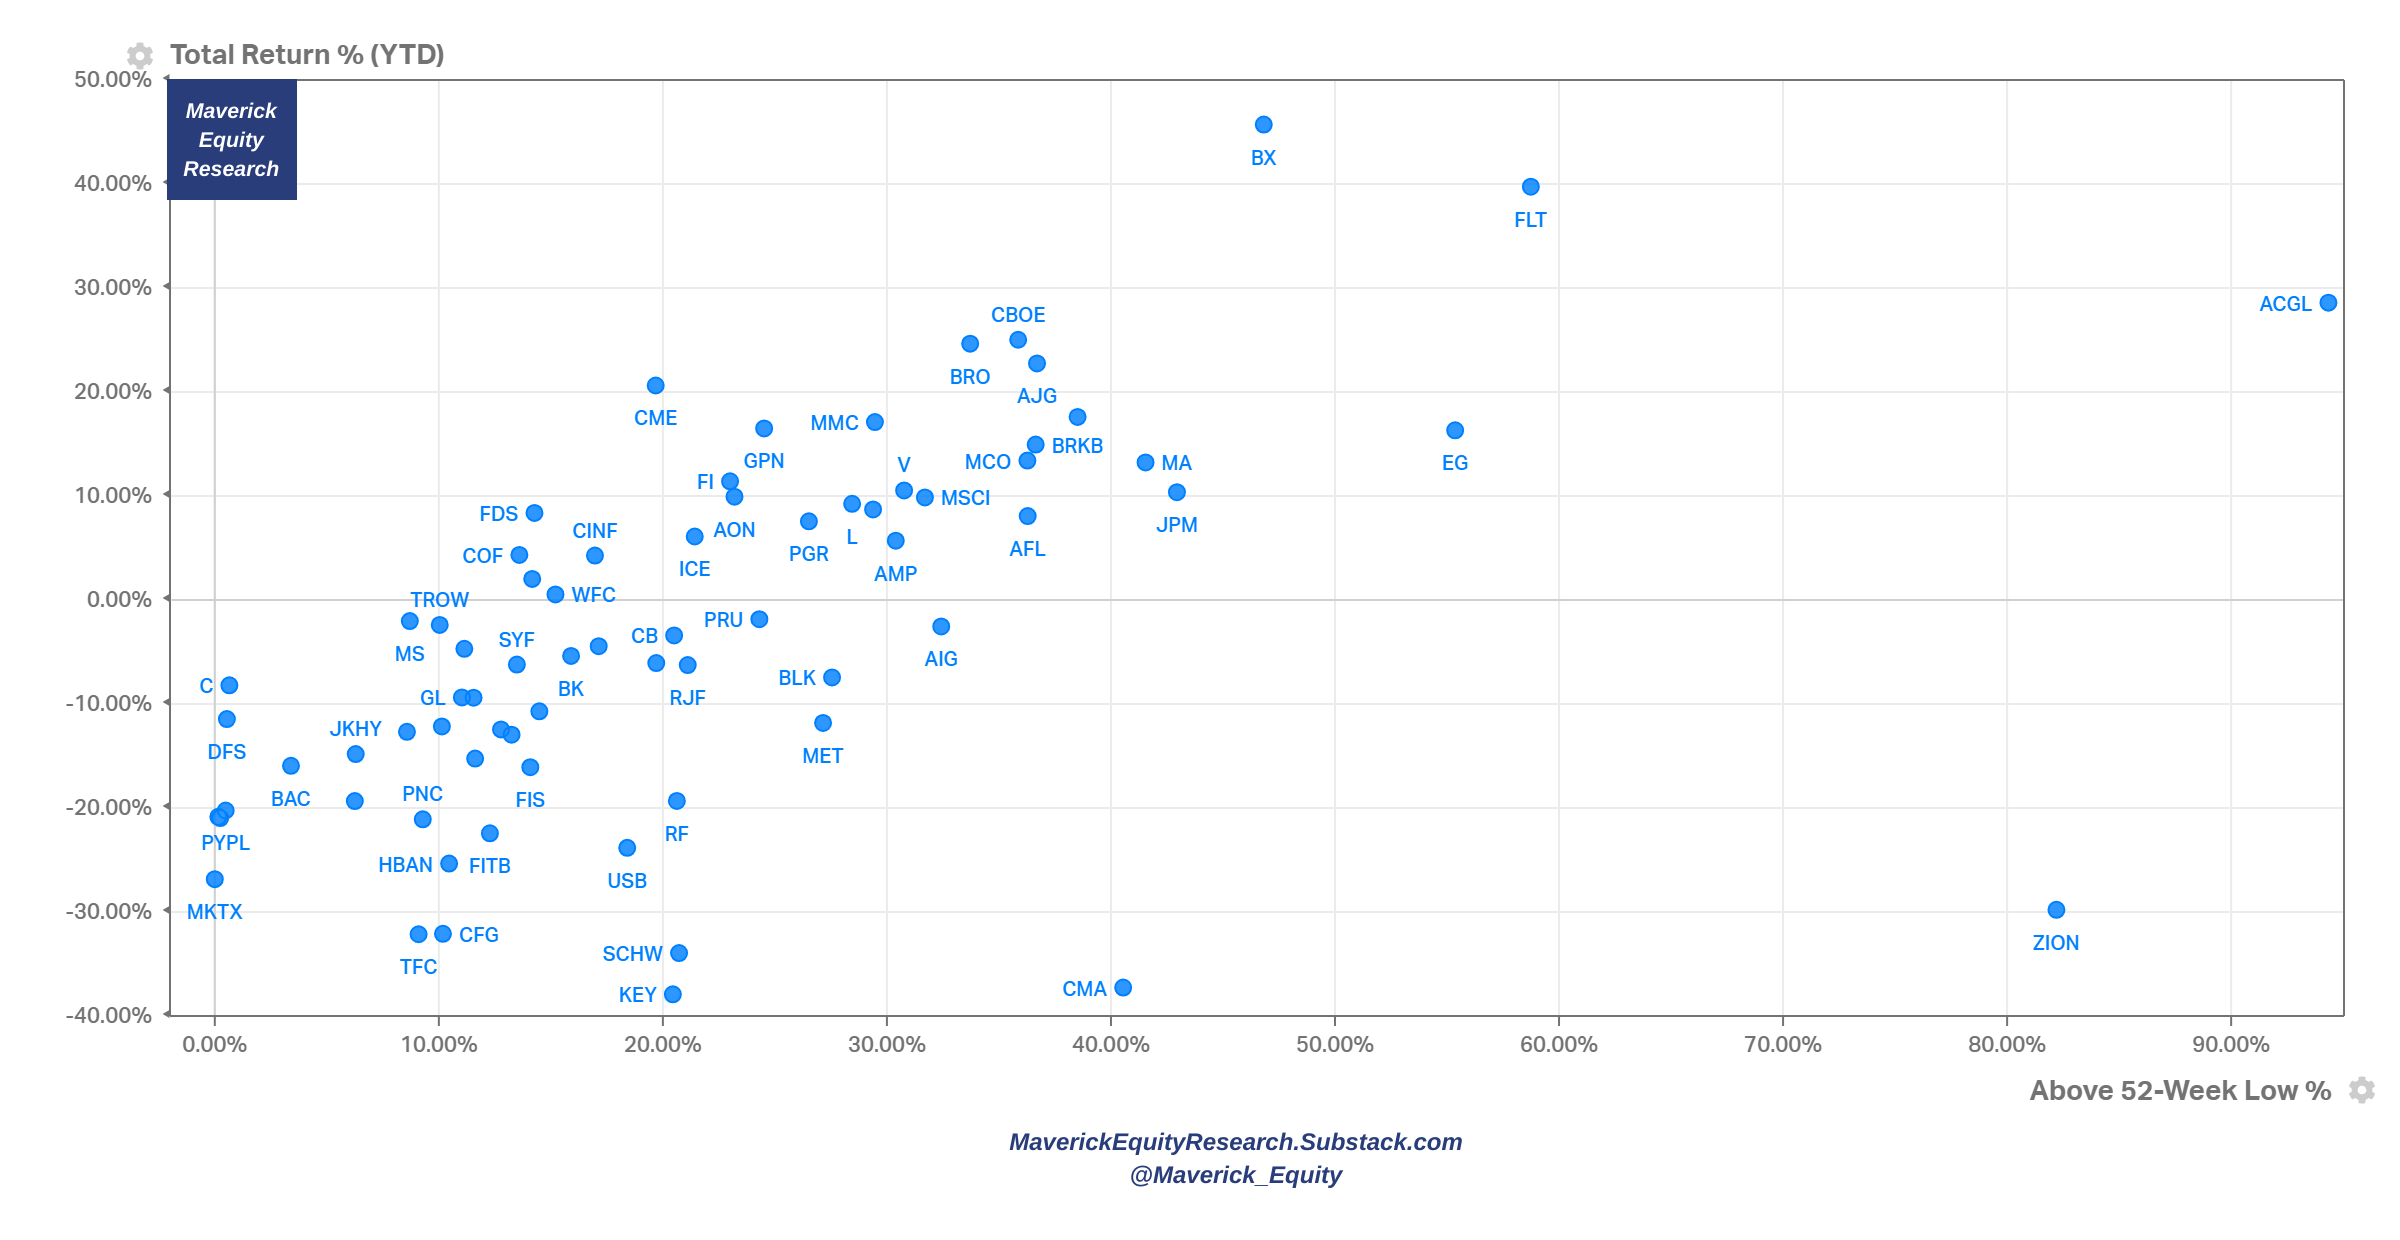
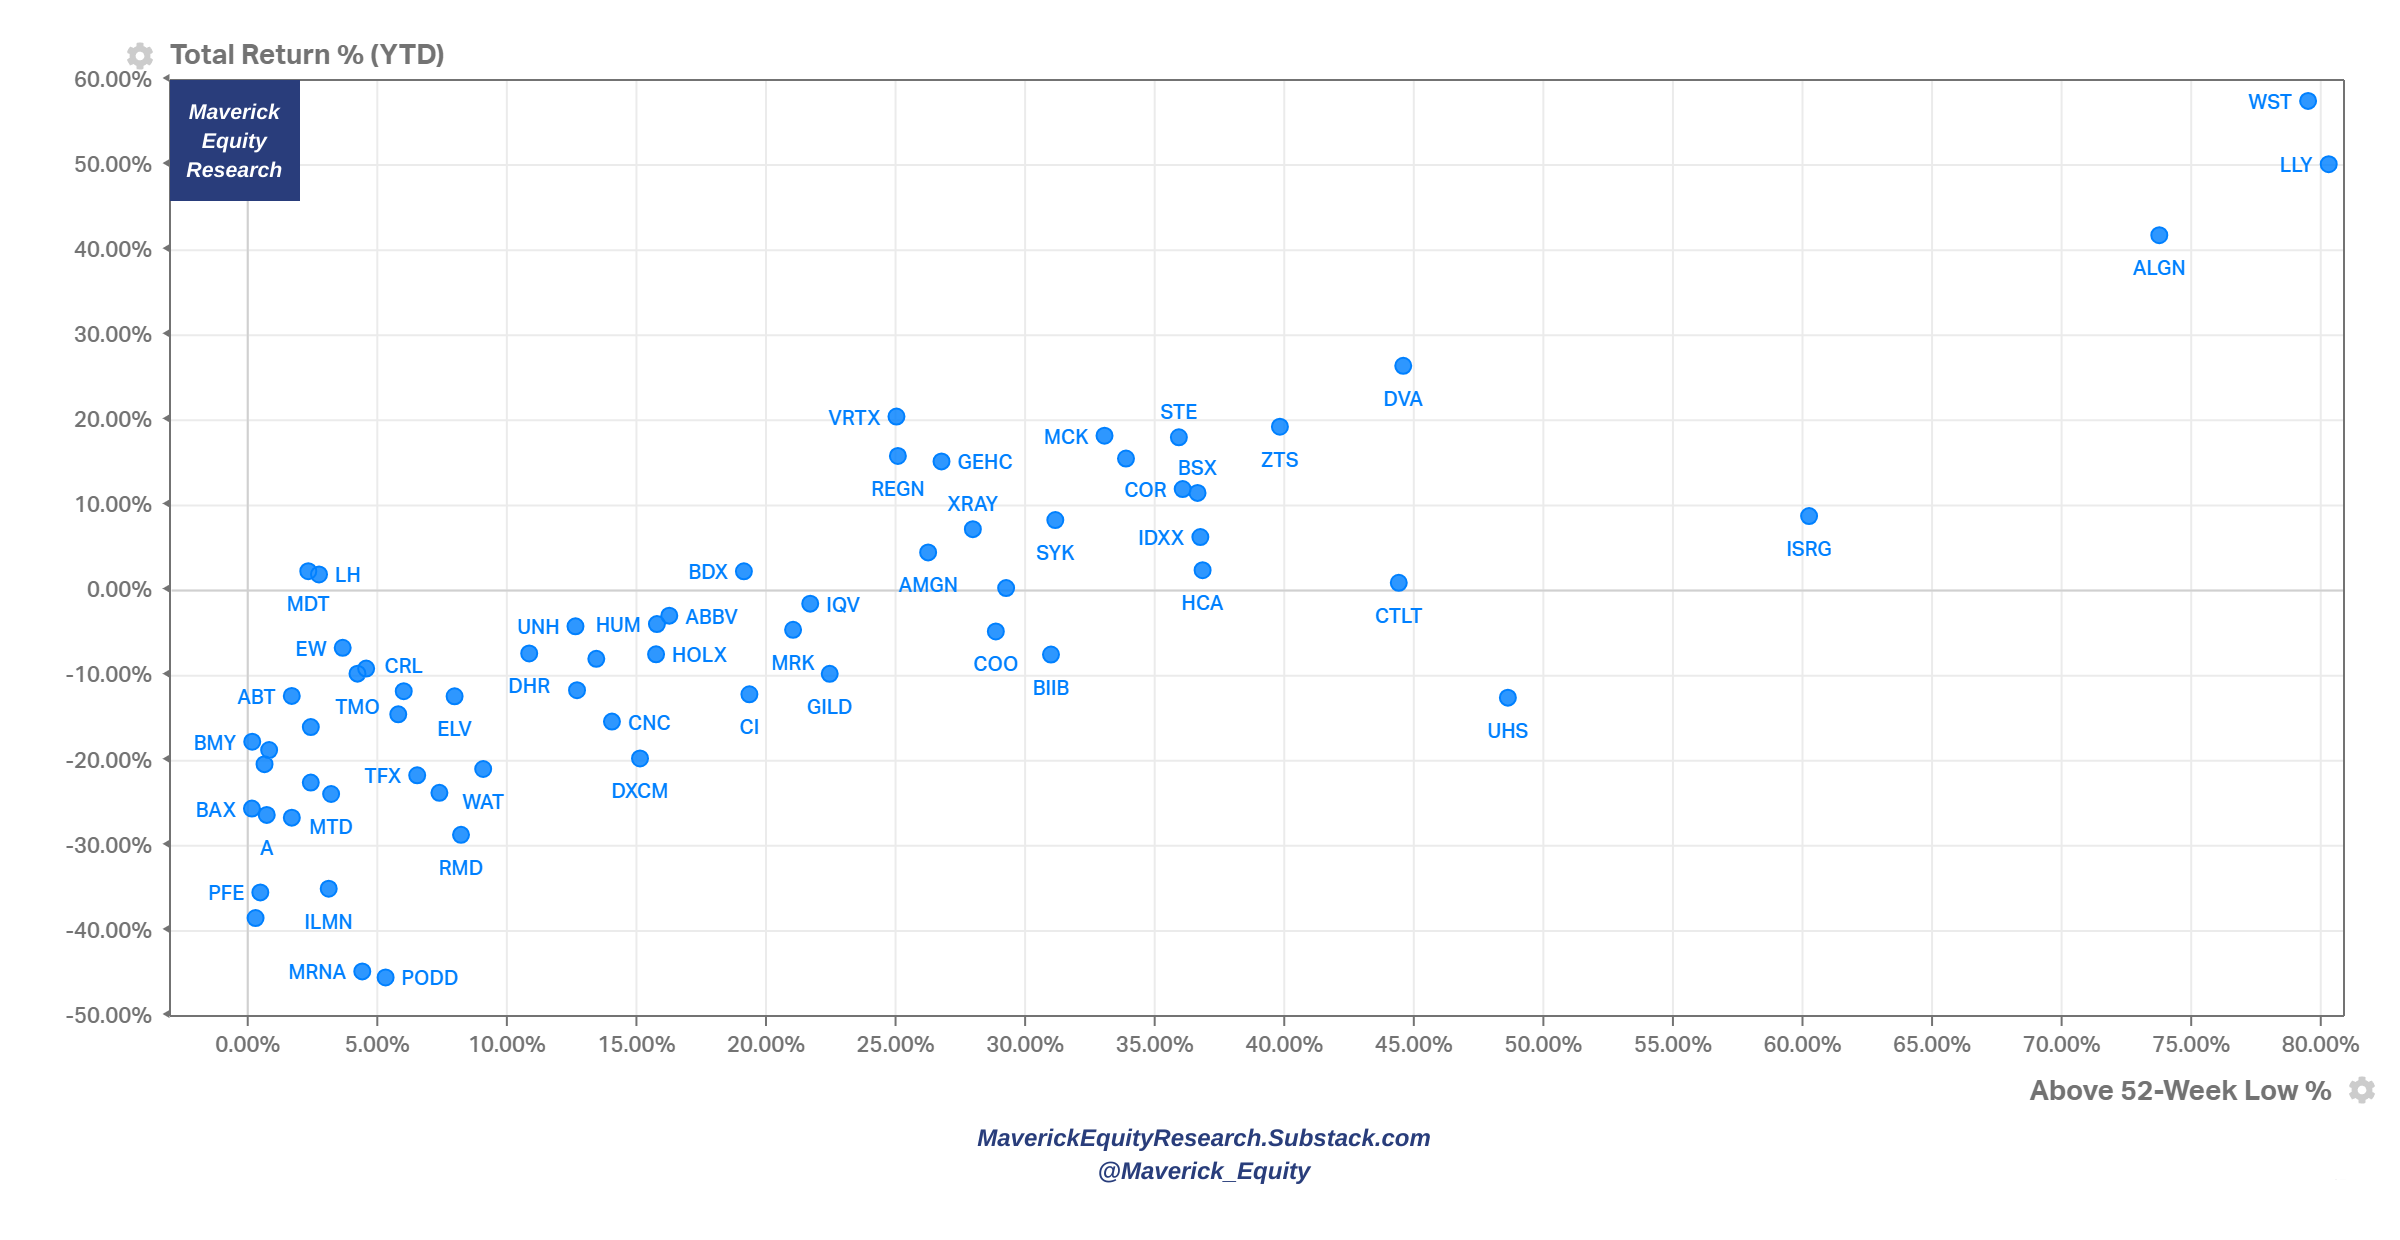
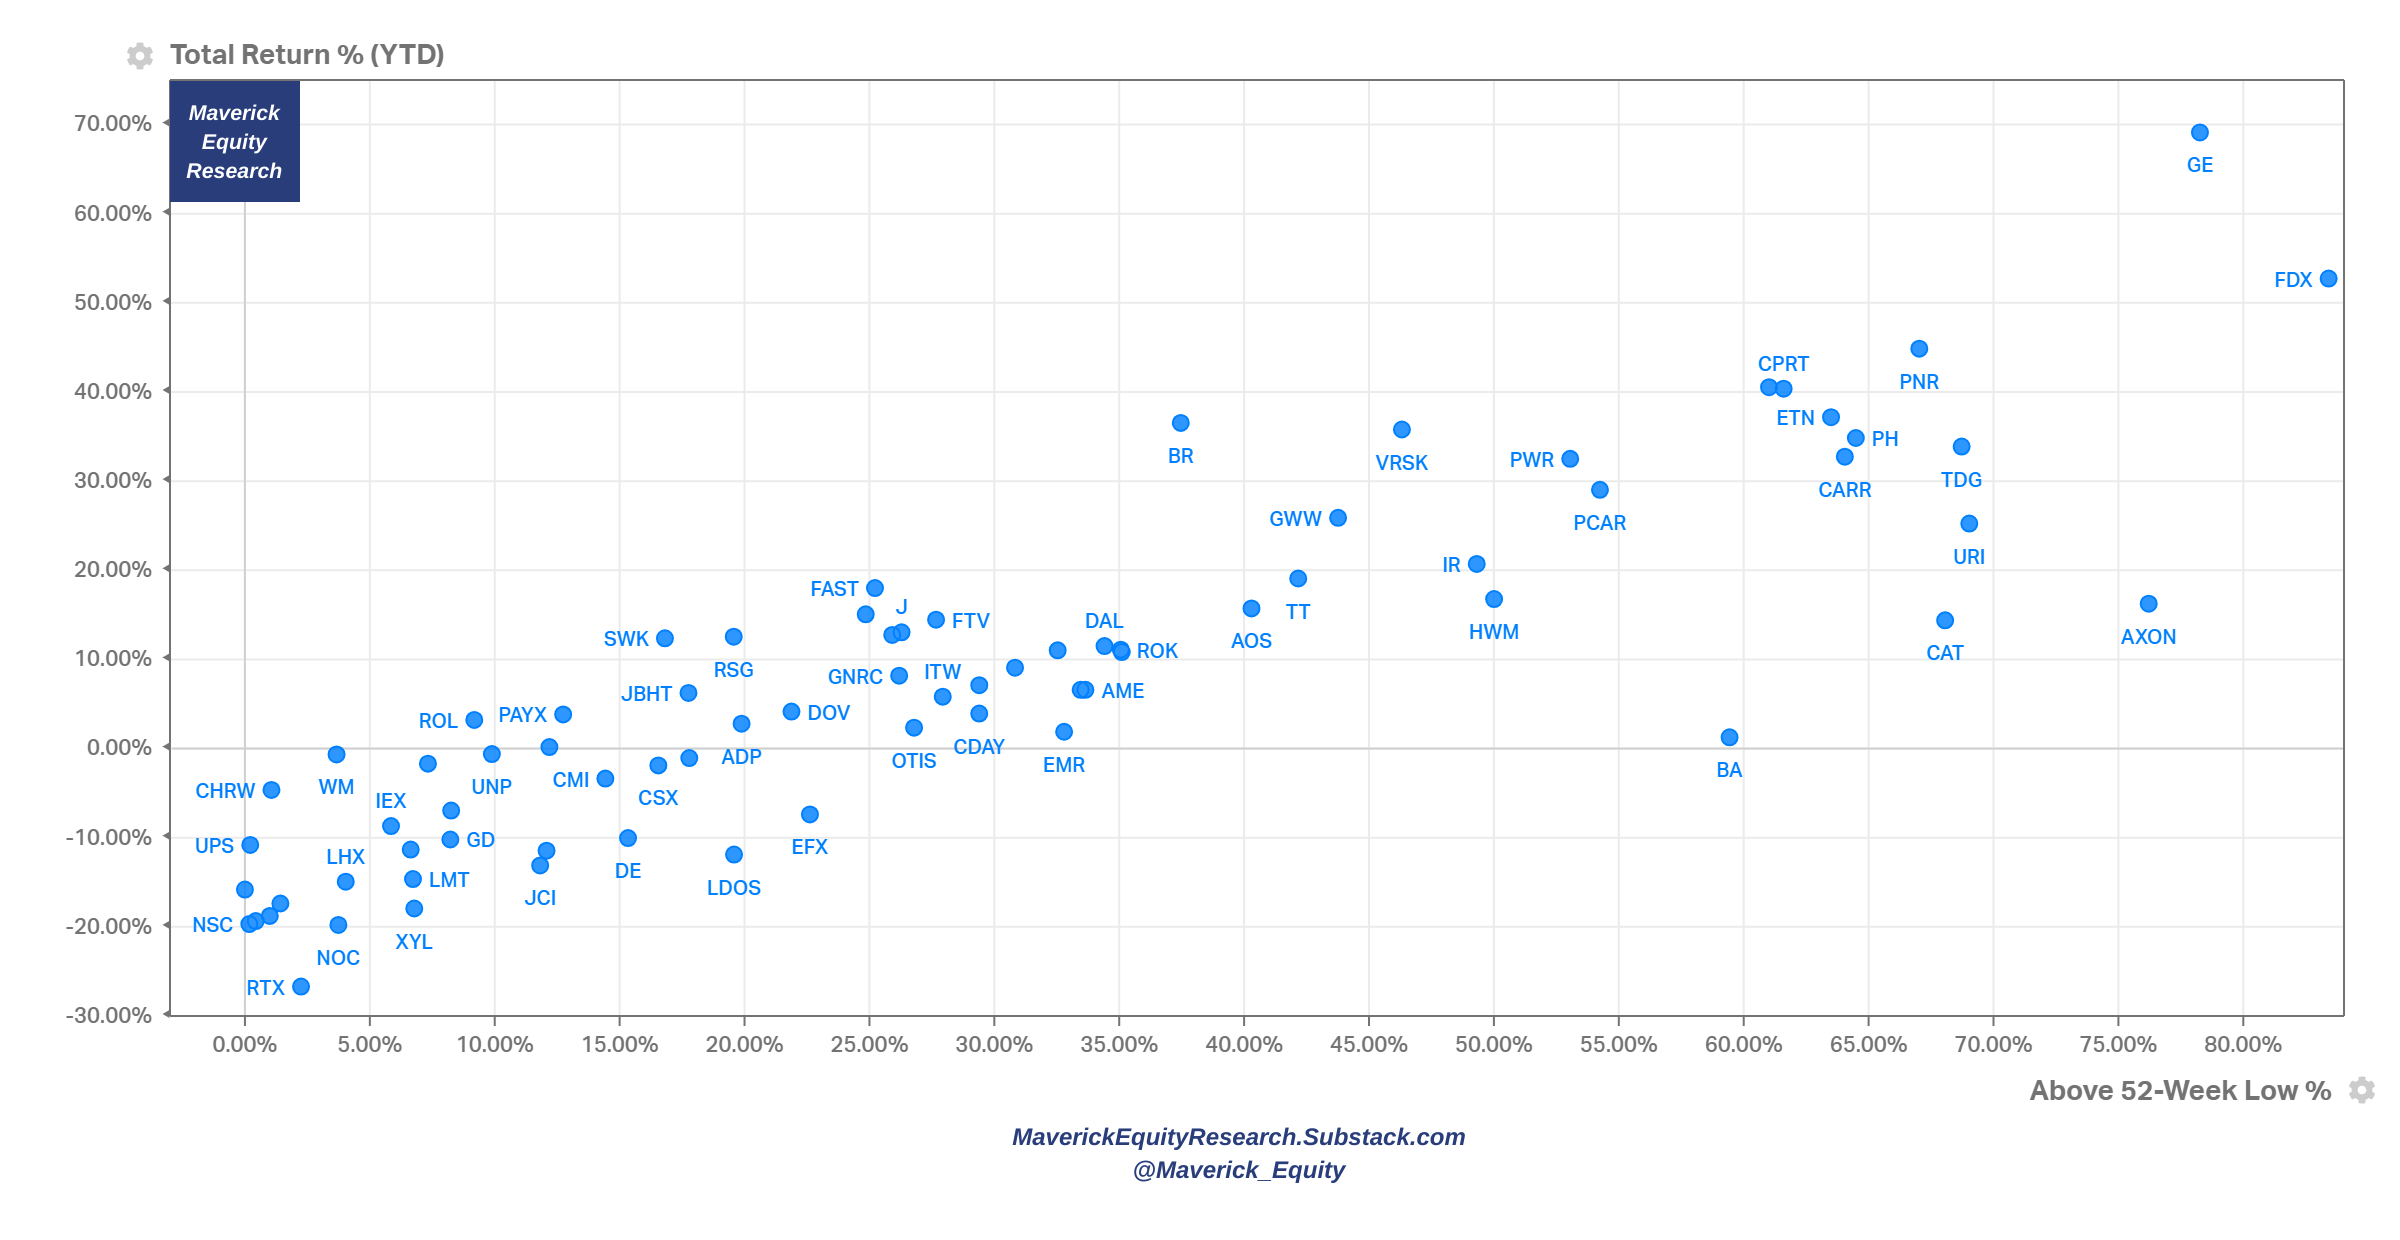
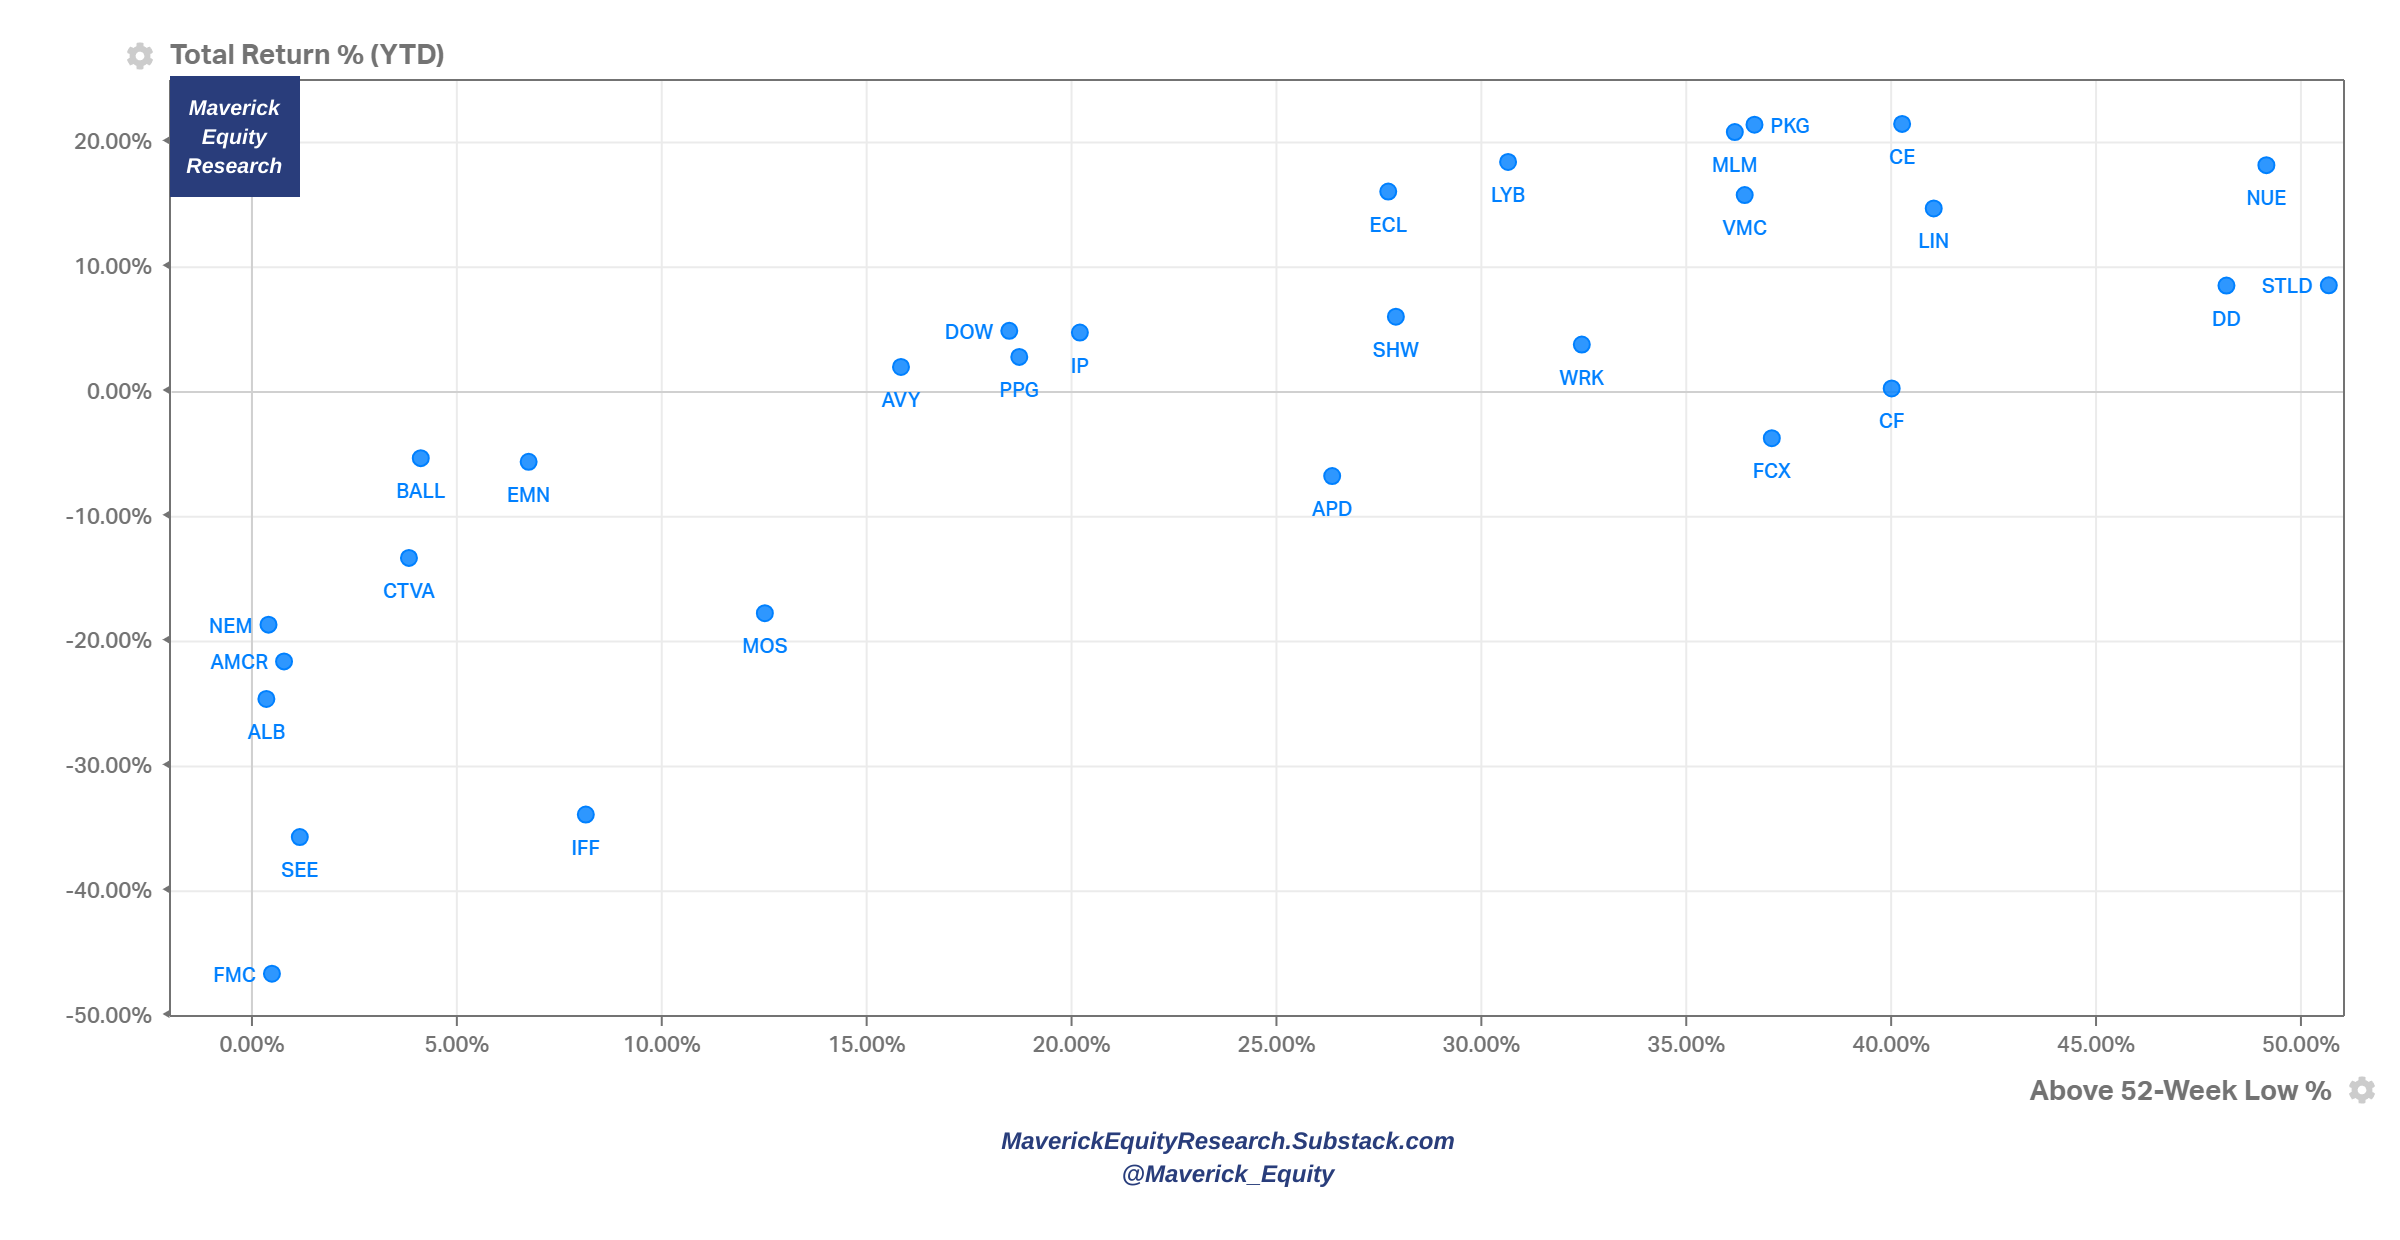
👉And now let’s zoom into the Price/Performance of the 11 sectors via scatterplots: 2023 % returns & above 52-week low % returns. General use cases for this visuals? Check for outliers, market leaders & laggards, positive/negative momentum, relative strength and/or likely un/warranted cheap or expensive stocks:
-
XLY – Consumer Discretionary: Tesla (TSLA) & the cruisers Royal Caribbean (RCL) and Carnival (CCL) rocking the boat …

-
XLP – Consumer Staples: Dollar General the big story on the negative side, Costco (COST), Walmart (WMT) & Mondelez (MDLZ) keep bringing the goodies…

-
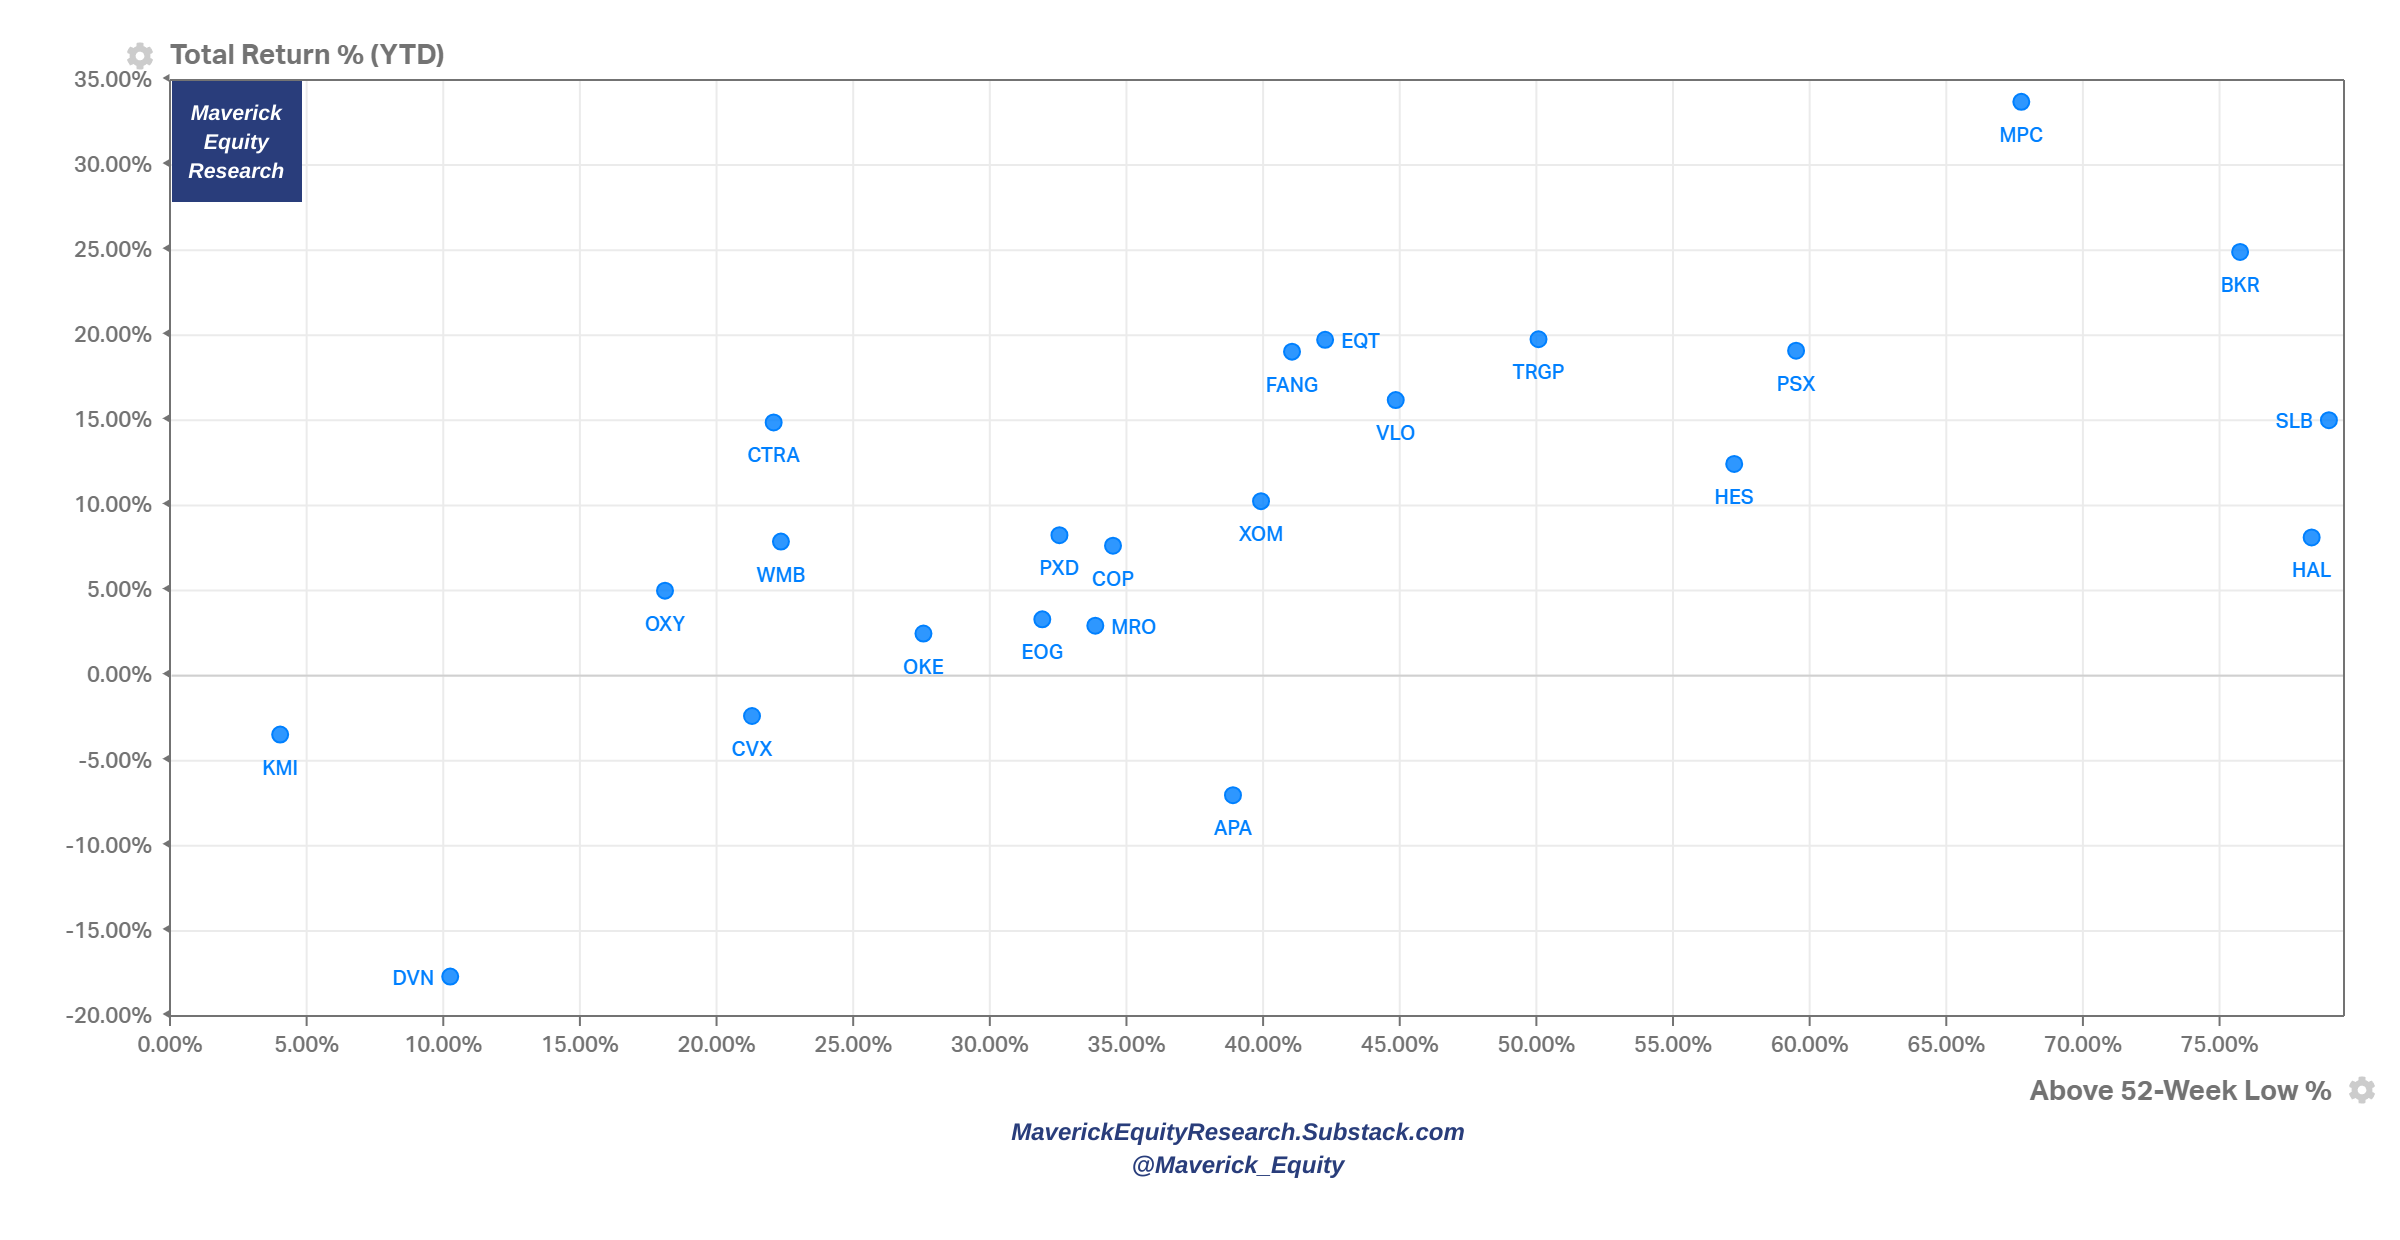
XLE – Energy: most energy names making a nice comeback …
-
XLF – Financials: a mixed bag as pretty much most of the times, PayPal (PYPL) continuing the slide in 2023 while Arch Capital Group (ACGL) +30% in 2023 and almost 2x since the 52-week low
-
XLV – Health Care: many names down this year while West Pharmaceutical Services (WST) the big outlier on the positive side
-
XLI – Industrials: General Electric (GE) and FedEx (FDX) the big rebounders …
-
XLB – Basic Materials: many names rebounding nicely from the 52-week low … infrastructure needs and demand anyone? …
-
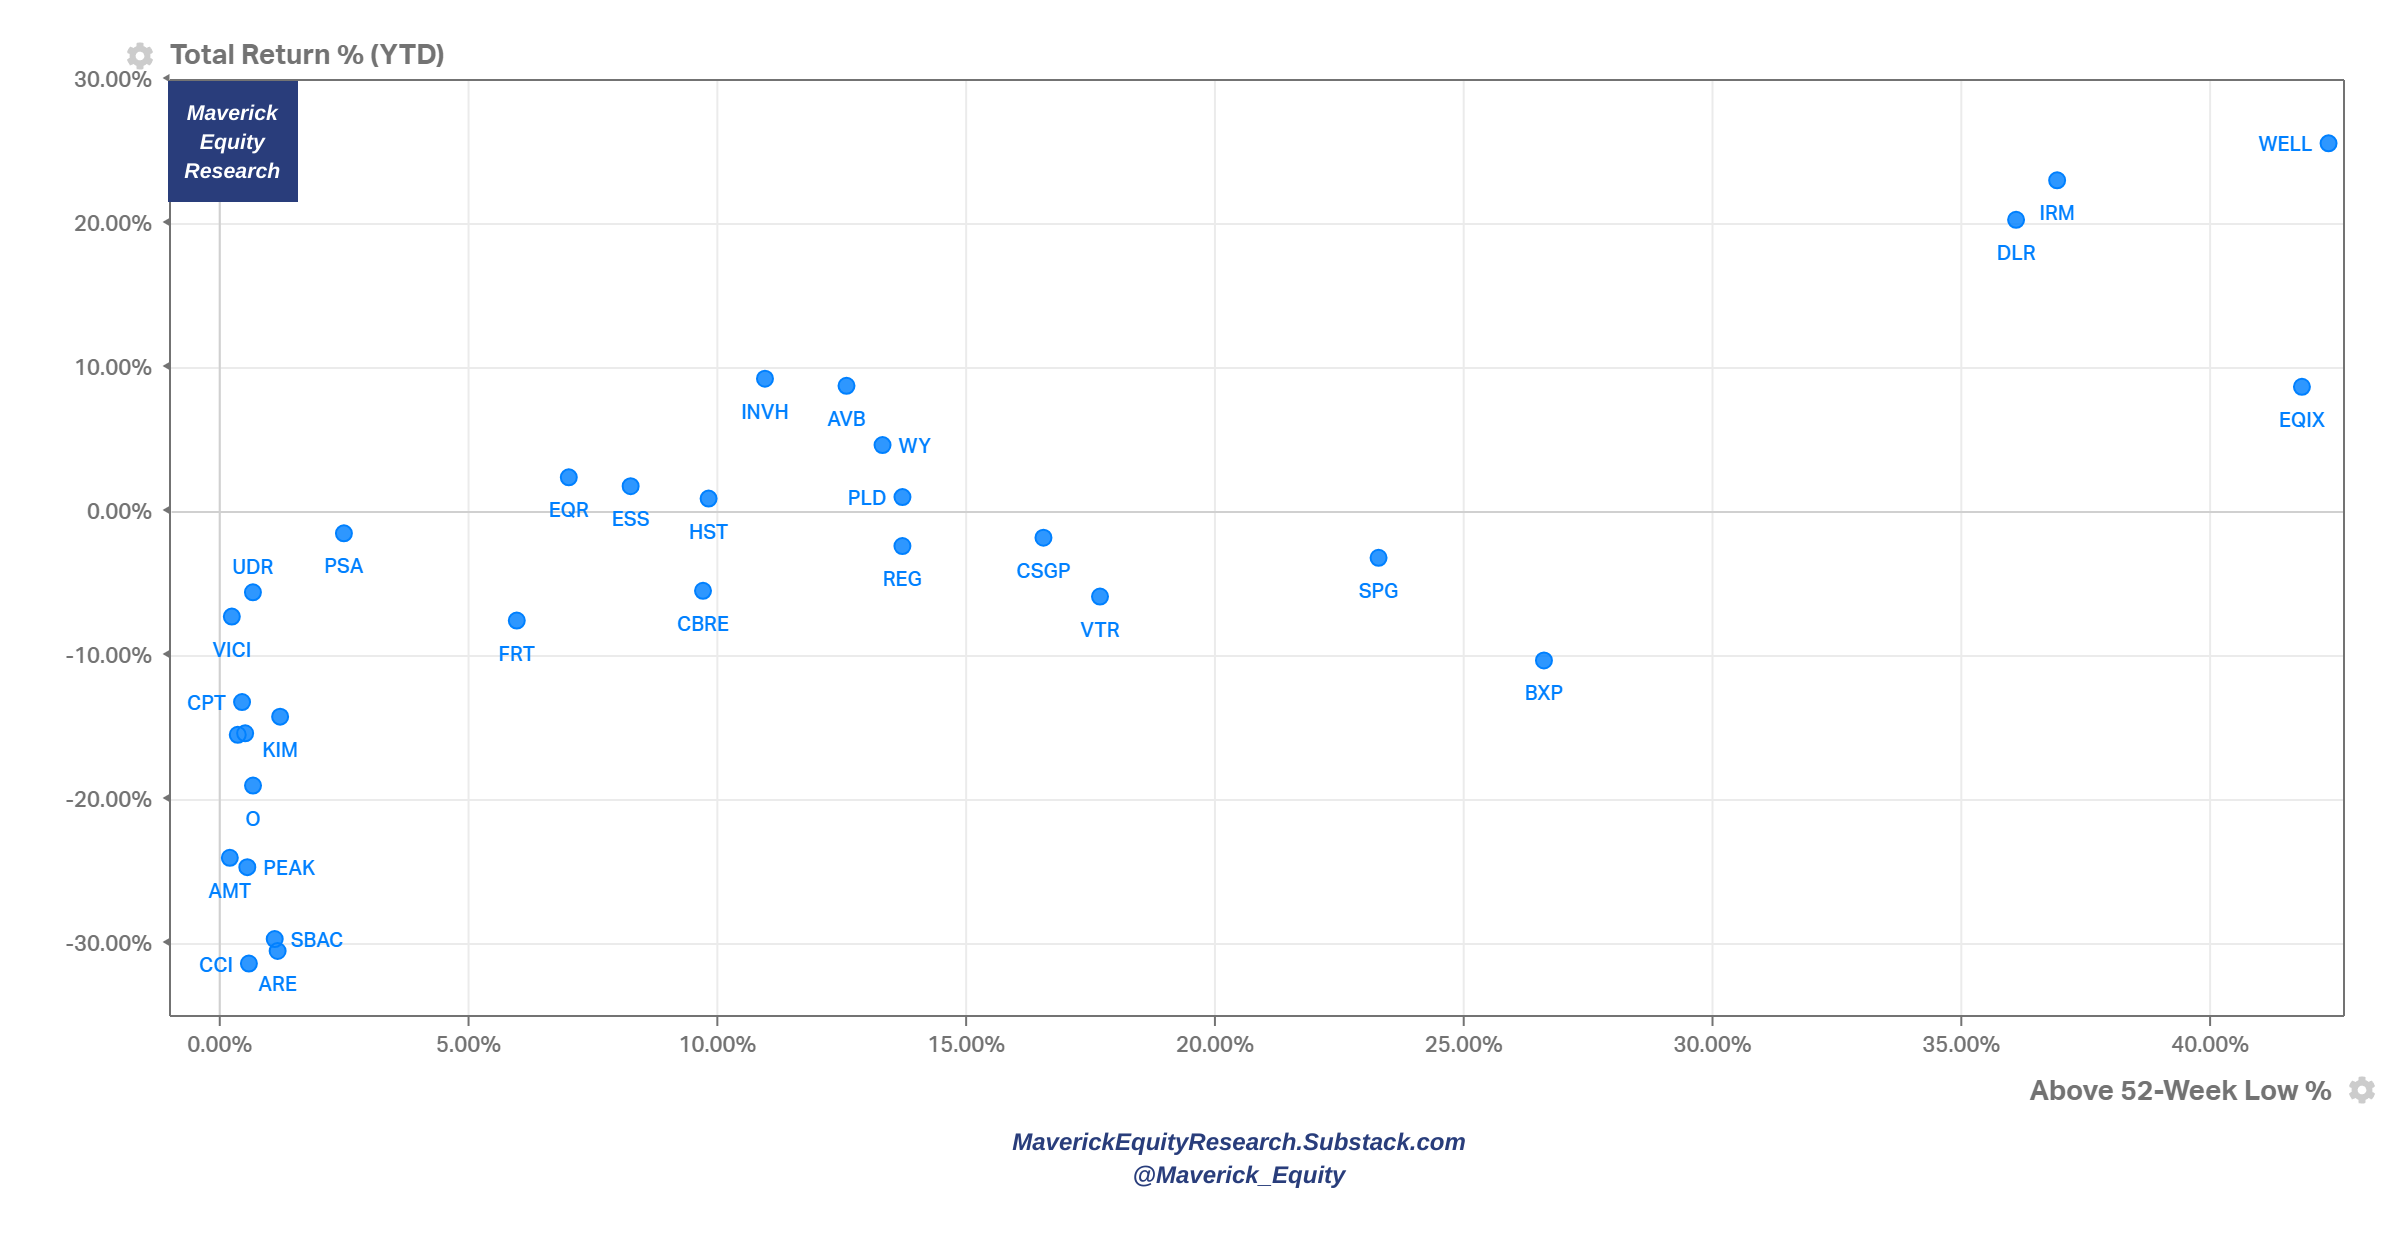
XLRE – Real Estate: Welltower (WELL) the outlier in this space …
-
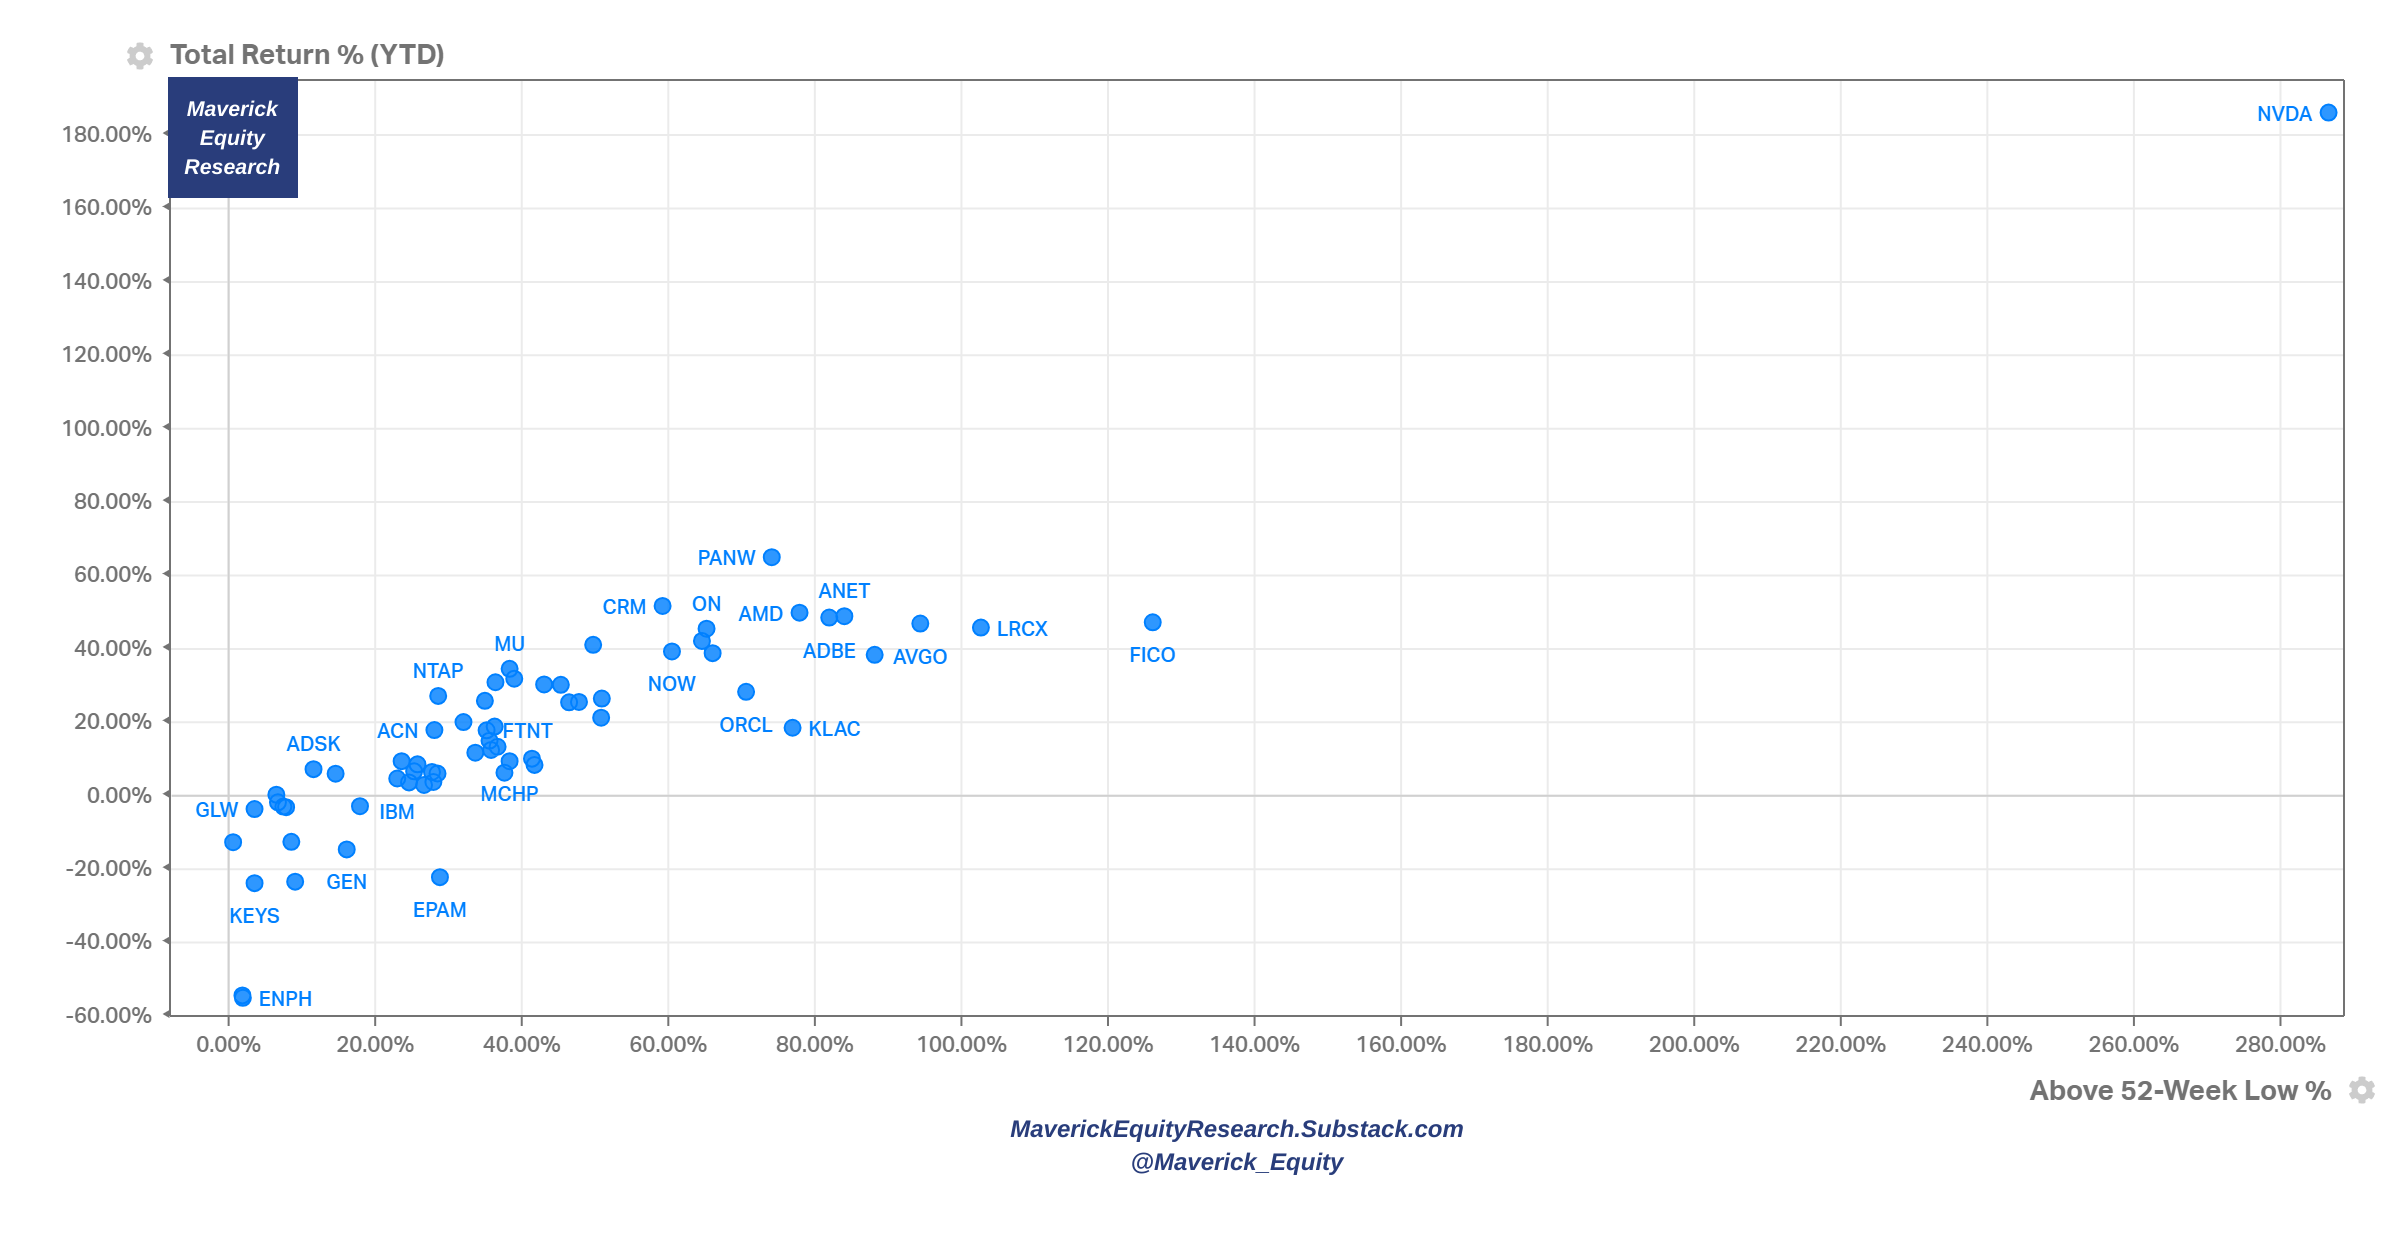
XLK – Technology: Nvidia (NVDA) the big outlier, AI AI AI …
-
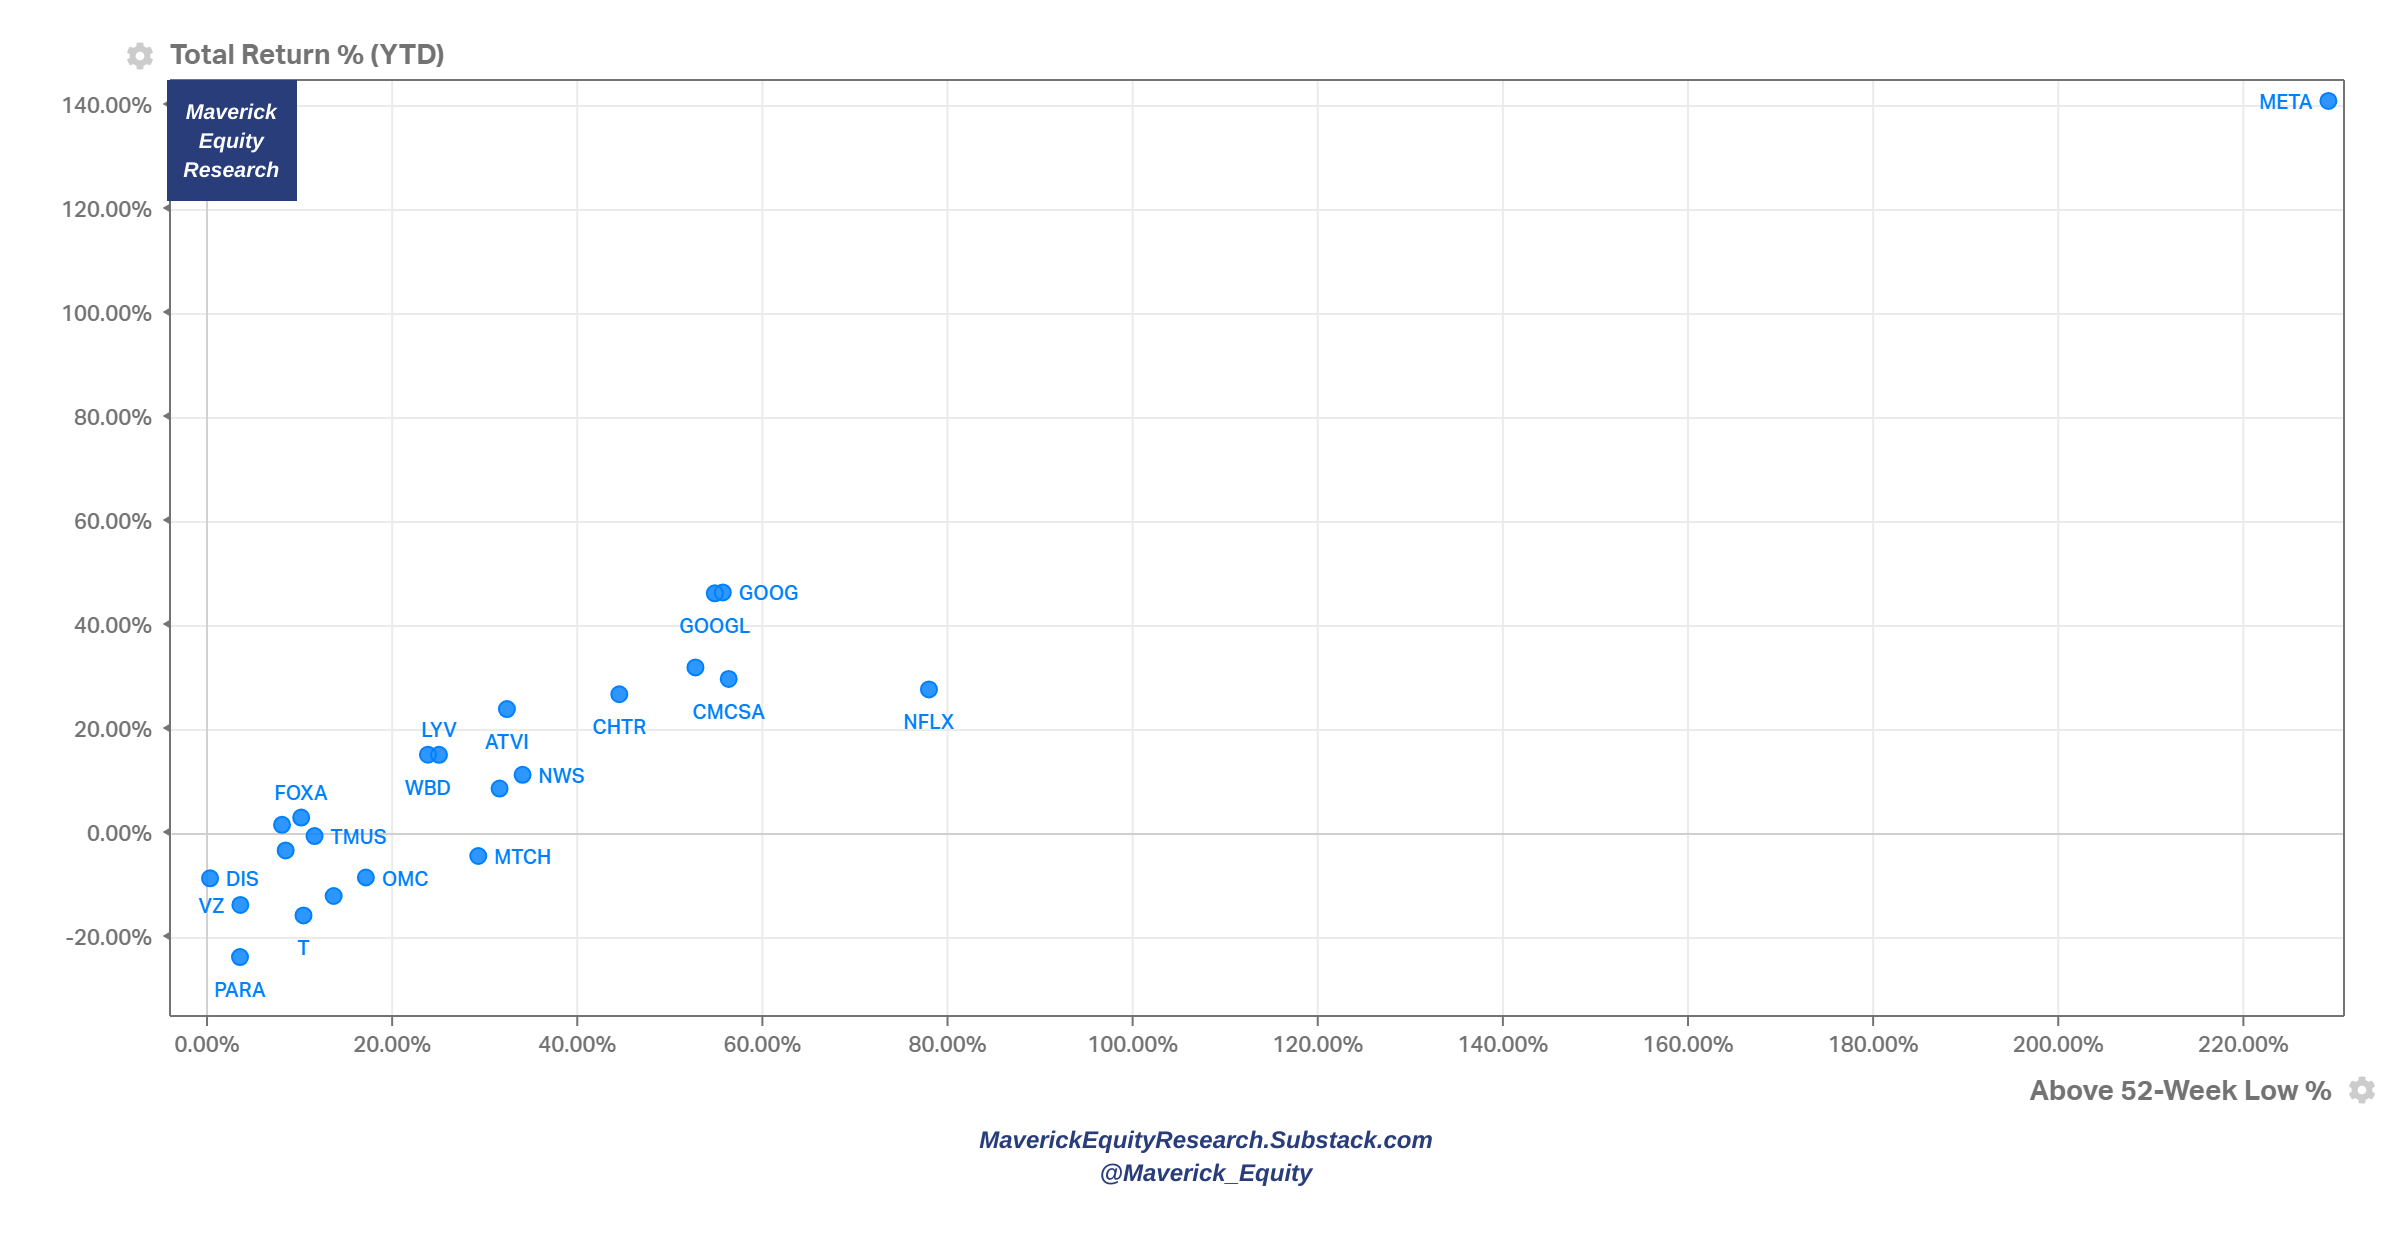
XLC – Communications: META/Facebook with a mega rebound, currently in the MetaVerse … with the CEO planning and training to fight Musk in the ring ;). Google (GOOG) & Netflix (NFLX) not chilling anymore with a nice rebound also …
-
XLU – Utilities: Constellation Energy Corporation (CEG) a big outlier …

📊 Sentiment, Seasonality, Volatility
👉 Sentiment: retail investors, institutional & mixed/composite indices
-
After the 2022 bear market, retail investor sentiment is picking up materially

-
BofA fund manager survey: despite global growth expectations being more pessimistic with net 53% expecting a weaker economy over the next 12 months, there is optimism for the stock market which is likely driven by likely interest rates cuts as priced in currently by the market

-
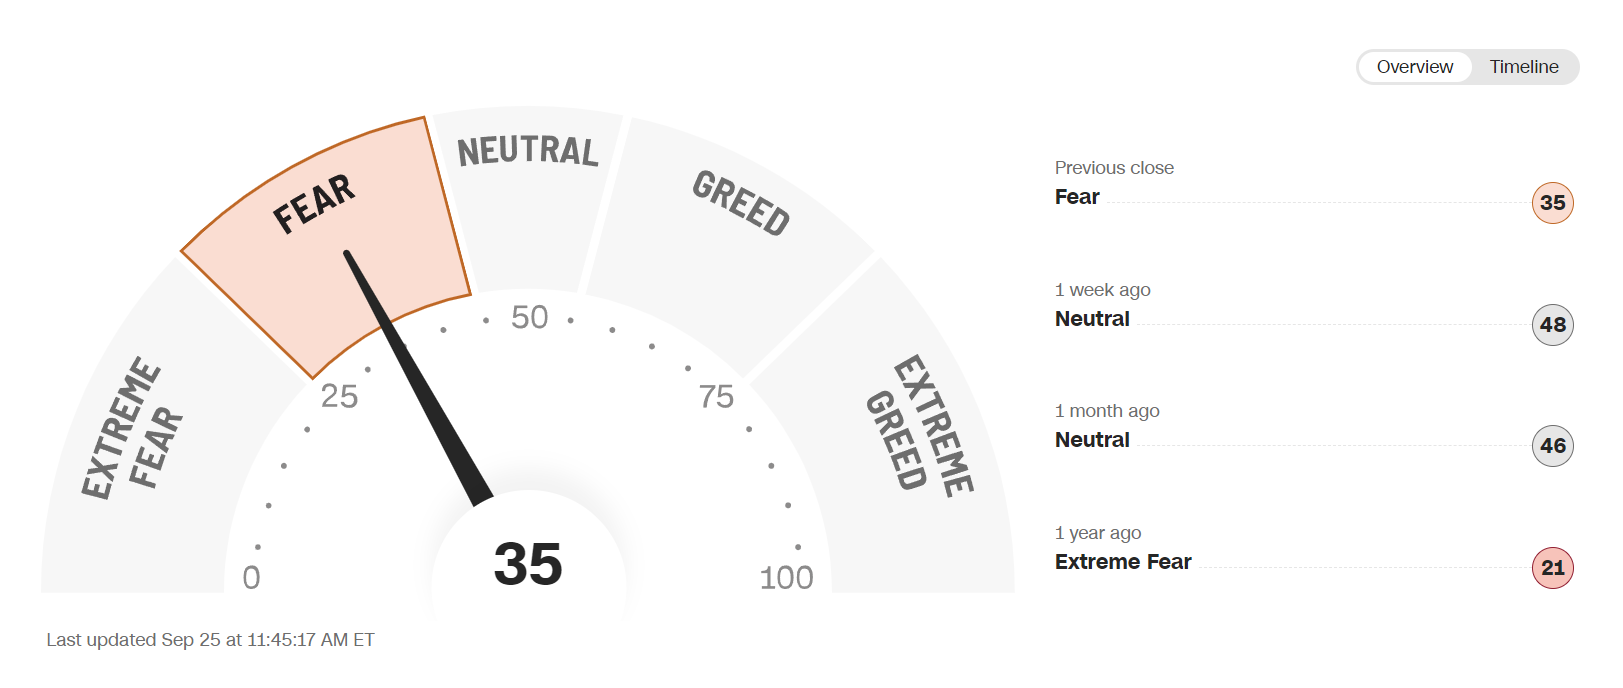
The Fear & Greed index shows Fear at 35, materially less than the Neutral 46 from 1 month ago, while note that 1 year ago in the 2022 bear market we were at the 21 Extreme Fear level
-
Consumer Sentiment and the S&P 500 dance together: after the 2022 bear market (biggest since 2007-2009 GFC), recovering more and more

-
S&P 500 companies themselves via earnings calls narrative
2022 worries are fading for Corporate America

And the ‘R’ word: fewer & fewer citing ‘recession’ for the 4th straight quarter

👉 Seasonality tells us we are behind the next move higher
-
Quarterly wise, since 1985 we have a 6.1% return in Q4; personally, I expect less given we already had a great year this year

-
Daily/Monthly wise, it points out up as well

👉 Volatility wise:
-
2023 stock market rally caused VIX (indicator of market uncertainty) to fall since June to its lowest level in more than 3 years (since January 2020)
-
recent spike to 17.2 as we cooled off a bit, but still below 19.6 average since 1990

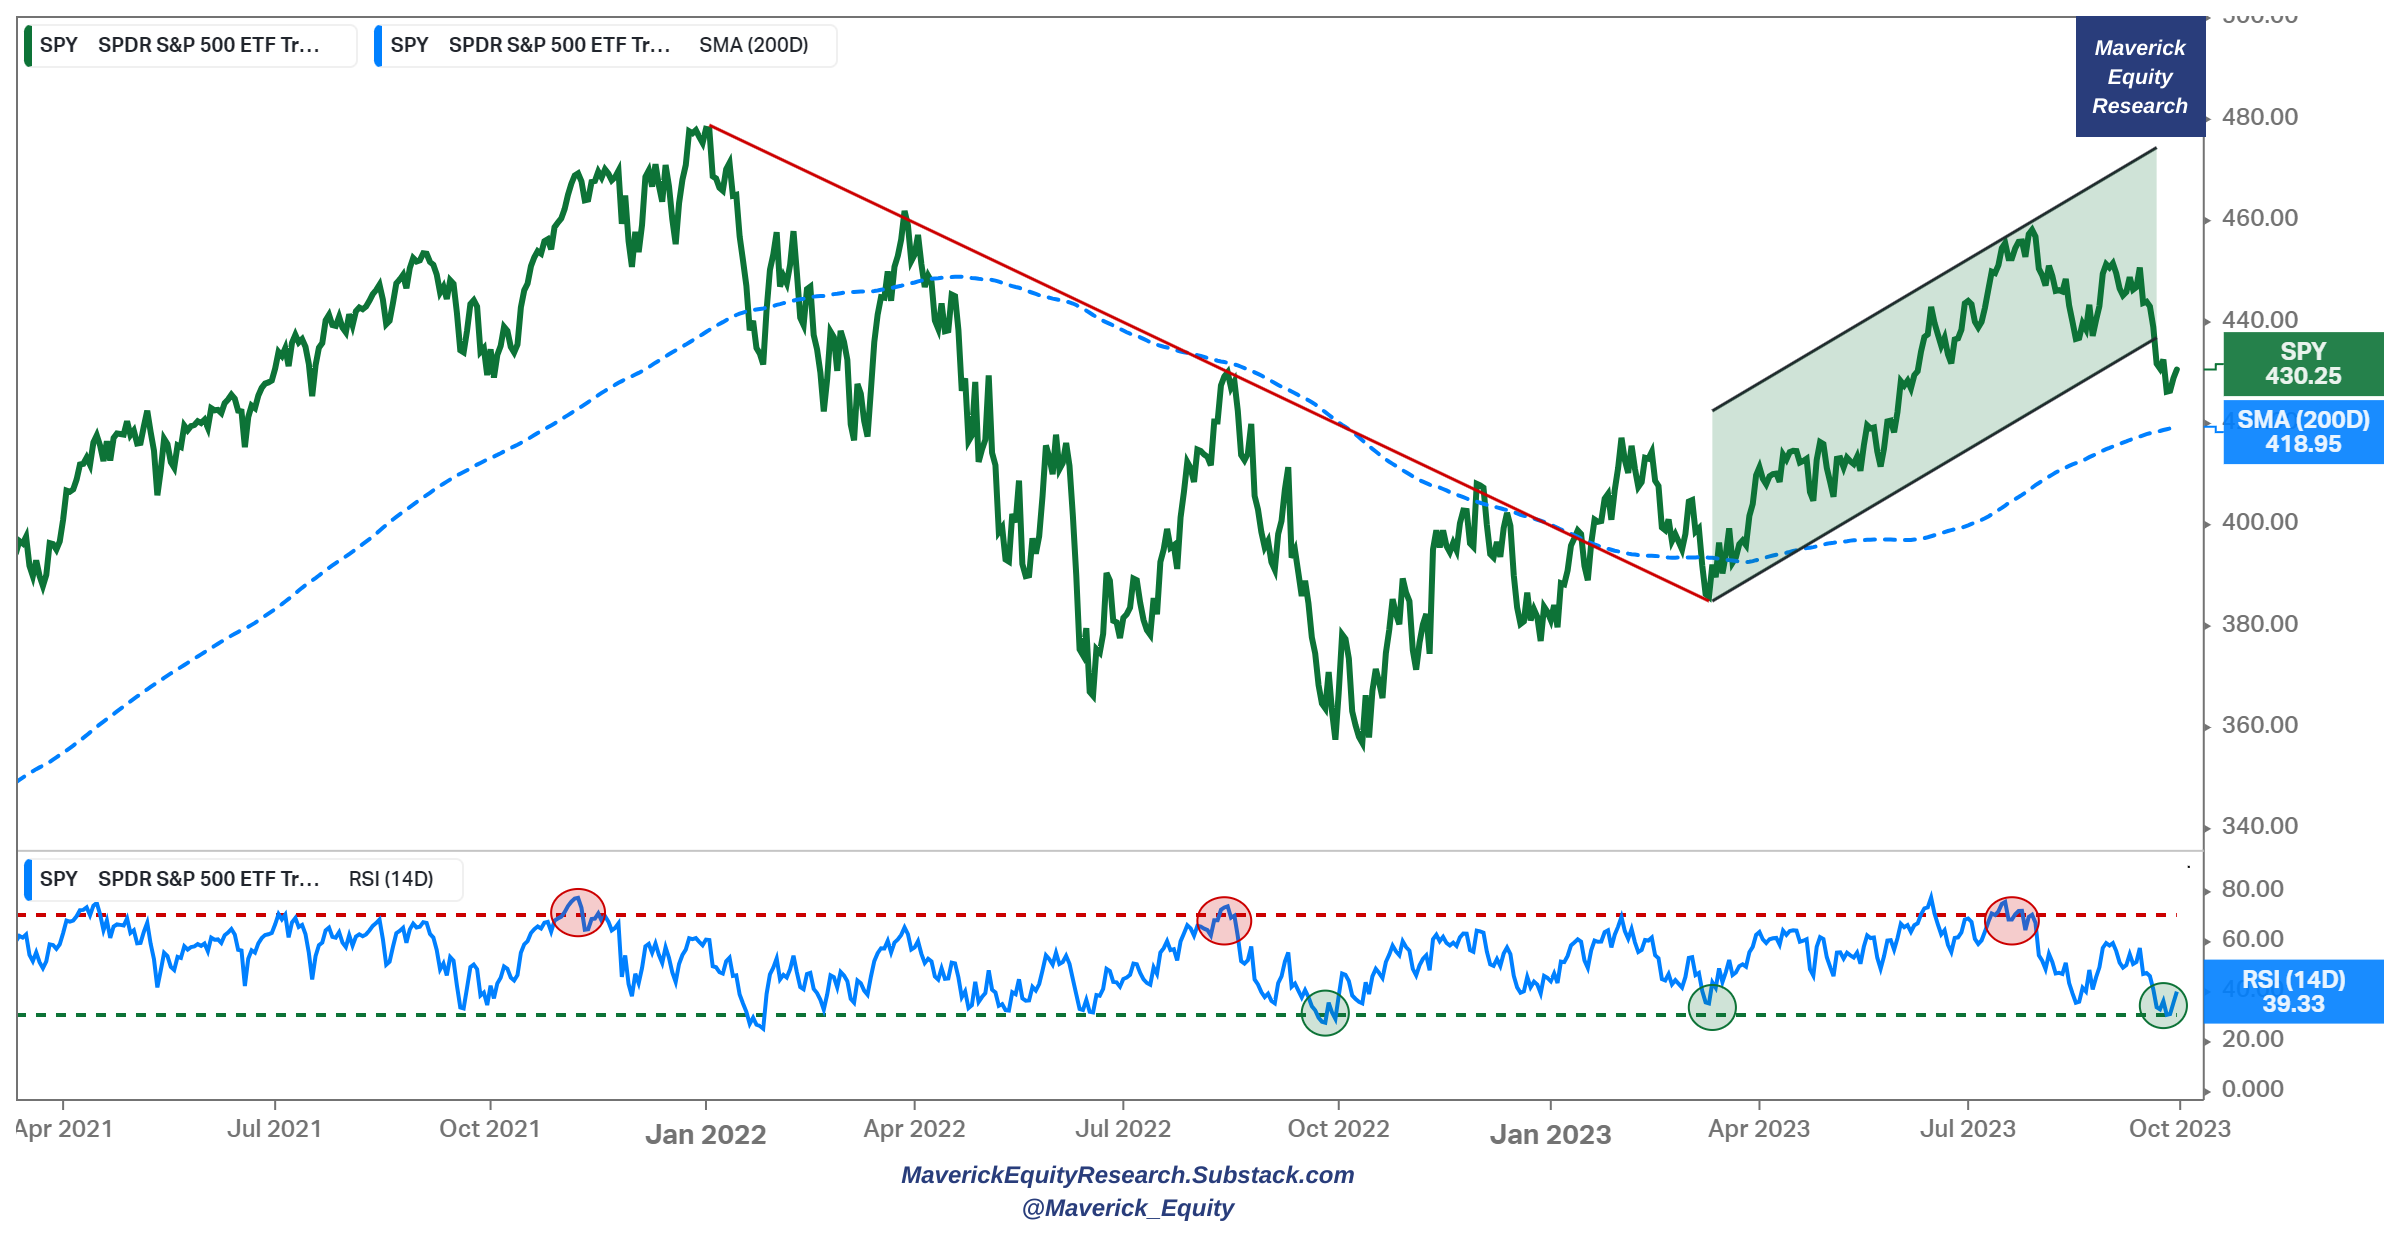
📊 Technical Analysis: Short Term & Long Term
Short Term:
-
once we broke out of the major resistance level (red) & the 200-day MA, we did exit the 2022 bear market and headed up nicely via the trending channel
-
channel resistance level broken recently with the next support at the 200-day MA
-
however, the RSI at 34 is signalling oversold conditions as it signalled also before local bottoms, hence pointing to a likely bounce back going into the year end
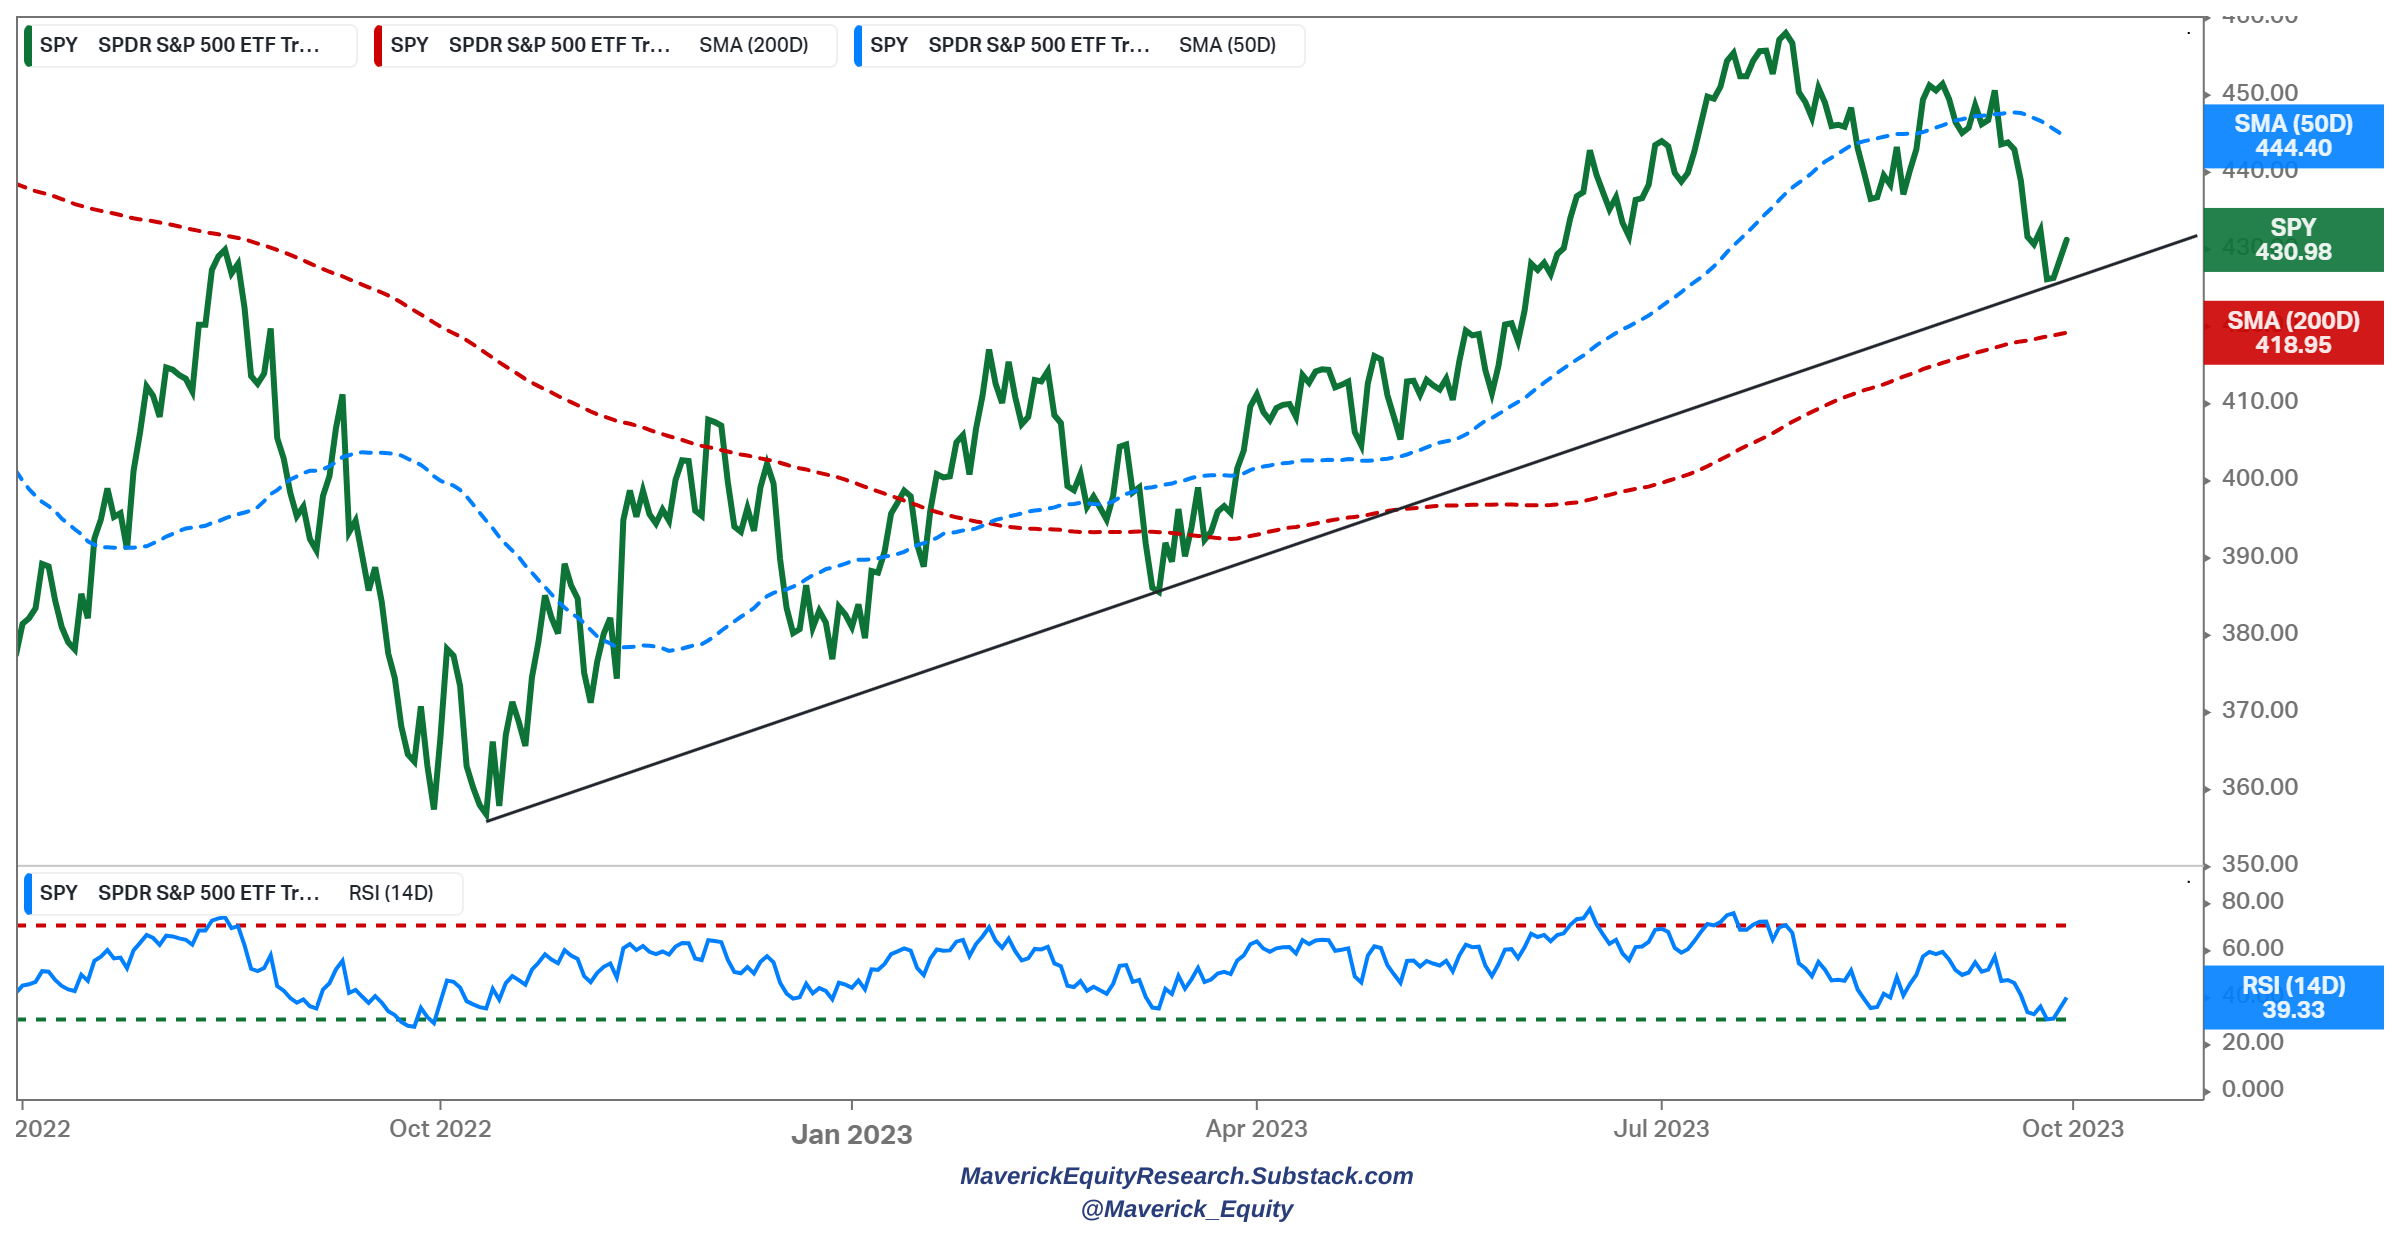
Complementary with an even shorter time frame, specifically from July 2022:
-
trendline (black line) from the October 2022 lows is the support level
-
tested for the 2nd time recently, only to bounce back from in the recent days which was also signalled by the RSI that reached oversold territories
-
hence, still a support level and in case broken, the 200-day MA is the next one
-
the 50-day MA (blue) is the resistance level here should the 2023 rally continue
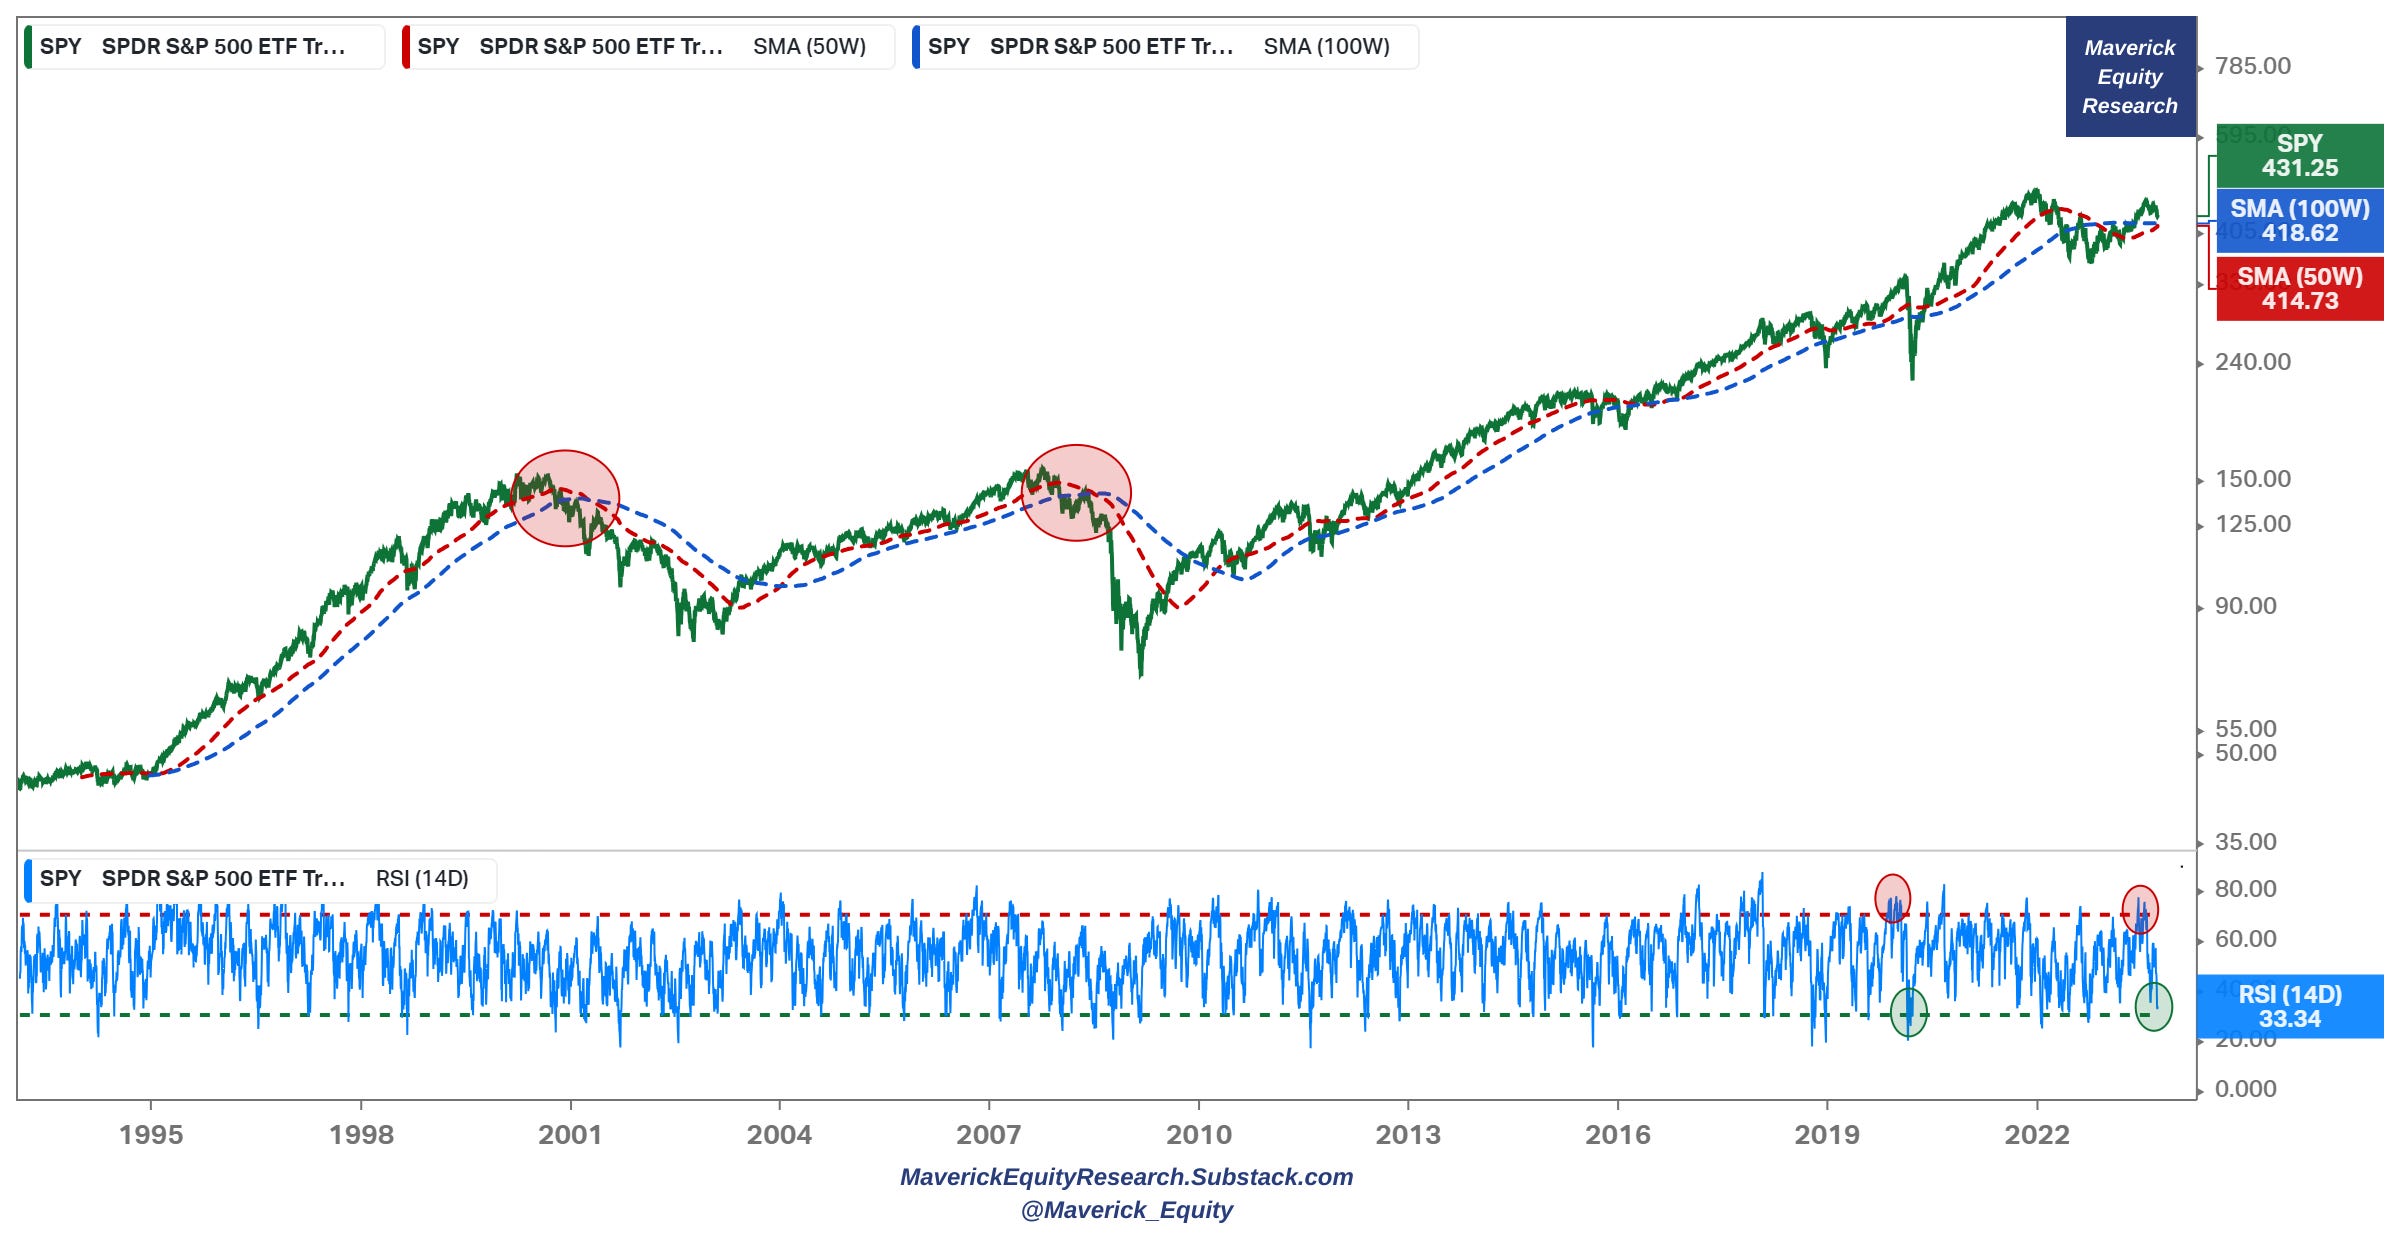
Long Term:
-
after the recent drop still above the 50 & 100-week moving averages which are now support levels going forward
-
RSI in oversold territory at the 33 level which often signals a bounce back
📊 Special & Alternative Metrics
👉 S&P 500 EPS to be boosted for the next 20 years by +0.5% in annual growth driven by widespread AI adoption (0.5% seems not a lot, but CAGR aka compounded)

👉 S&P 500 set to triple to 14,000 by 2034 via the generational cycles:
-
current 16-18 year cycle likely to peak around 2023
-
3x might sound ridiculously high? It is highish but not something bombastic and that is because: a) reaching 14,000 would imply around 11% annualised returns which is not that uncommon b) not too long ago in 2010 the S&P 500 was at 1,000

👉 How is the S&P 500 dealing with the high & fast rising rates environment?
-
debt service burden is extremely light
-
strong Corporate America is also a reason for why the most anticipated recession did not happen

Complementary angle to answer, ‘how comes rates are not impacting S&P 500?’
-
almost half of the S&P 500 is set to mature AFTER 2030
-
hence, rate hikes have had not much of an impact on their interest expense so far
-
also, many of the S&P 500 companies have big pricing power etc

S&P 500 labour costs across the 11 sectors:
-
At the aggregate S&P 500 index level, labour costs equal 12% of revenues
-
At the stock level, they equate to 13% of revenues for the median constituent

👉 The Power of Dividends in the S&P 500:
Dividends contributed almost 30% to the 10.4% annual total returns of the S&P 500 over the long run. Some further key notes:
-
In the 1970s, a decade characterized by high inflation and weak economic growth, dividends made up 70% of total returns
-
The 1990s—the decade of the dot-com bubble—had the lowest contribution from dividends of just 15%
-
The 2000s was the only decade with negative total returns: the dividend returns of nearly 2% provided a cushion to offset negative price returns driven by the bursting of the dot-com bubble and the Global Financial Crisis

S&P 500 distance from a 52-week high (green) and recession periods (grey):
-
20% drops (grey horizontal line) do not happen often outside of recessions

👍 Bonus Charts 👍
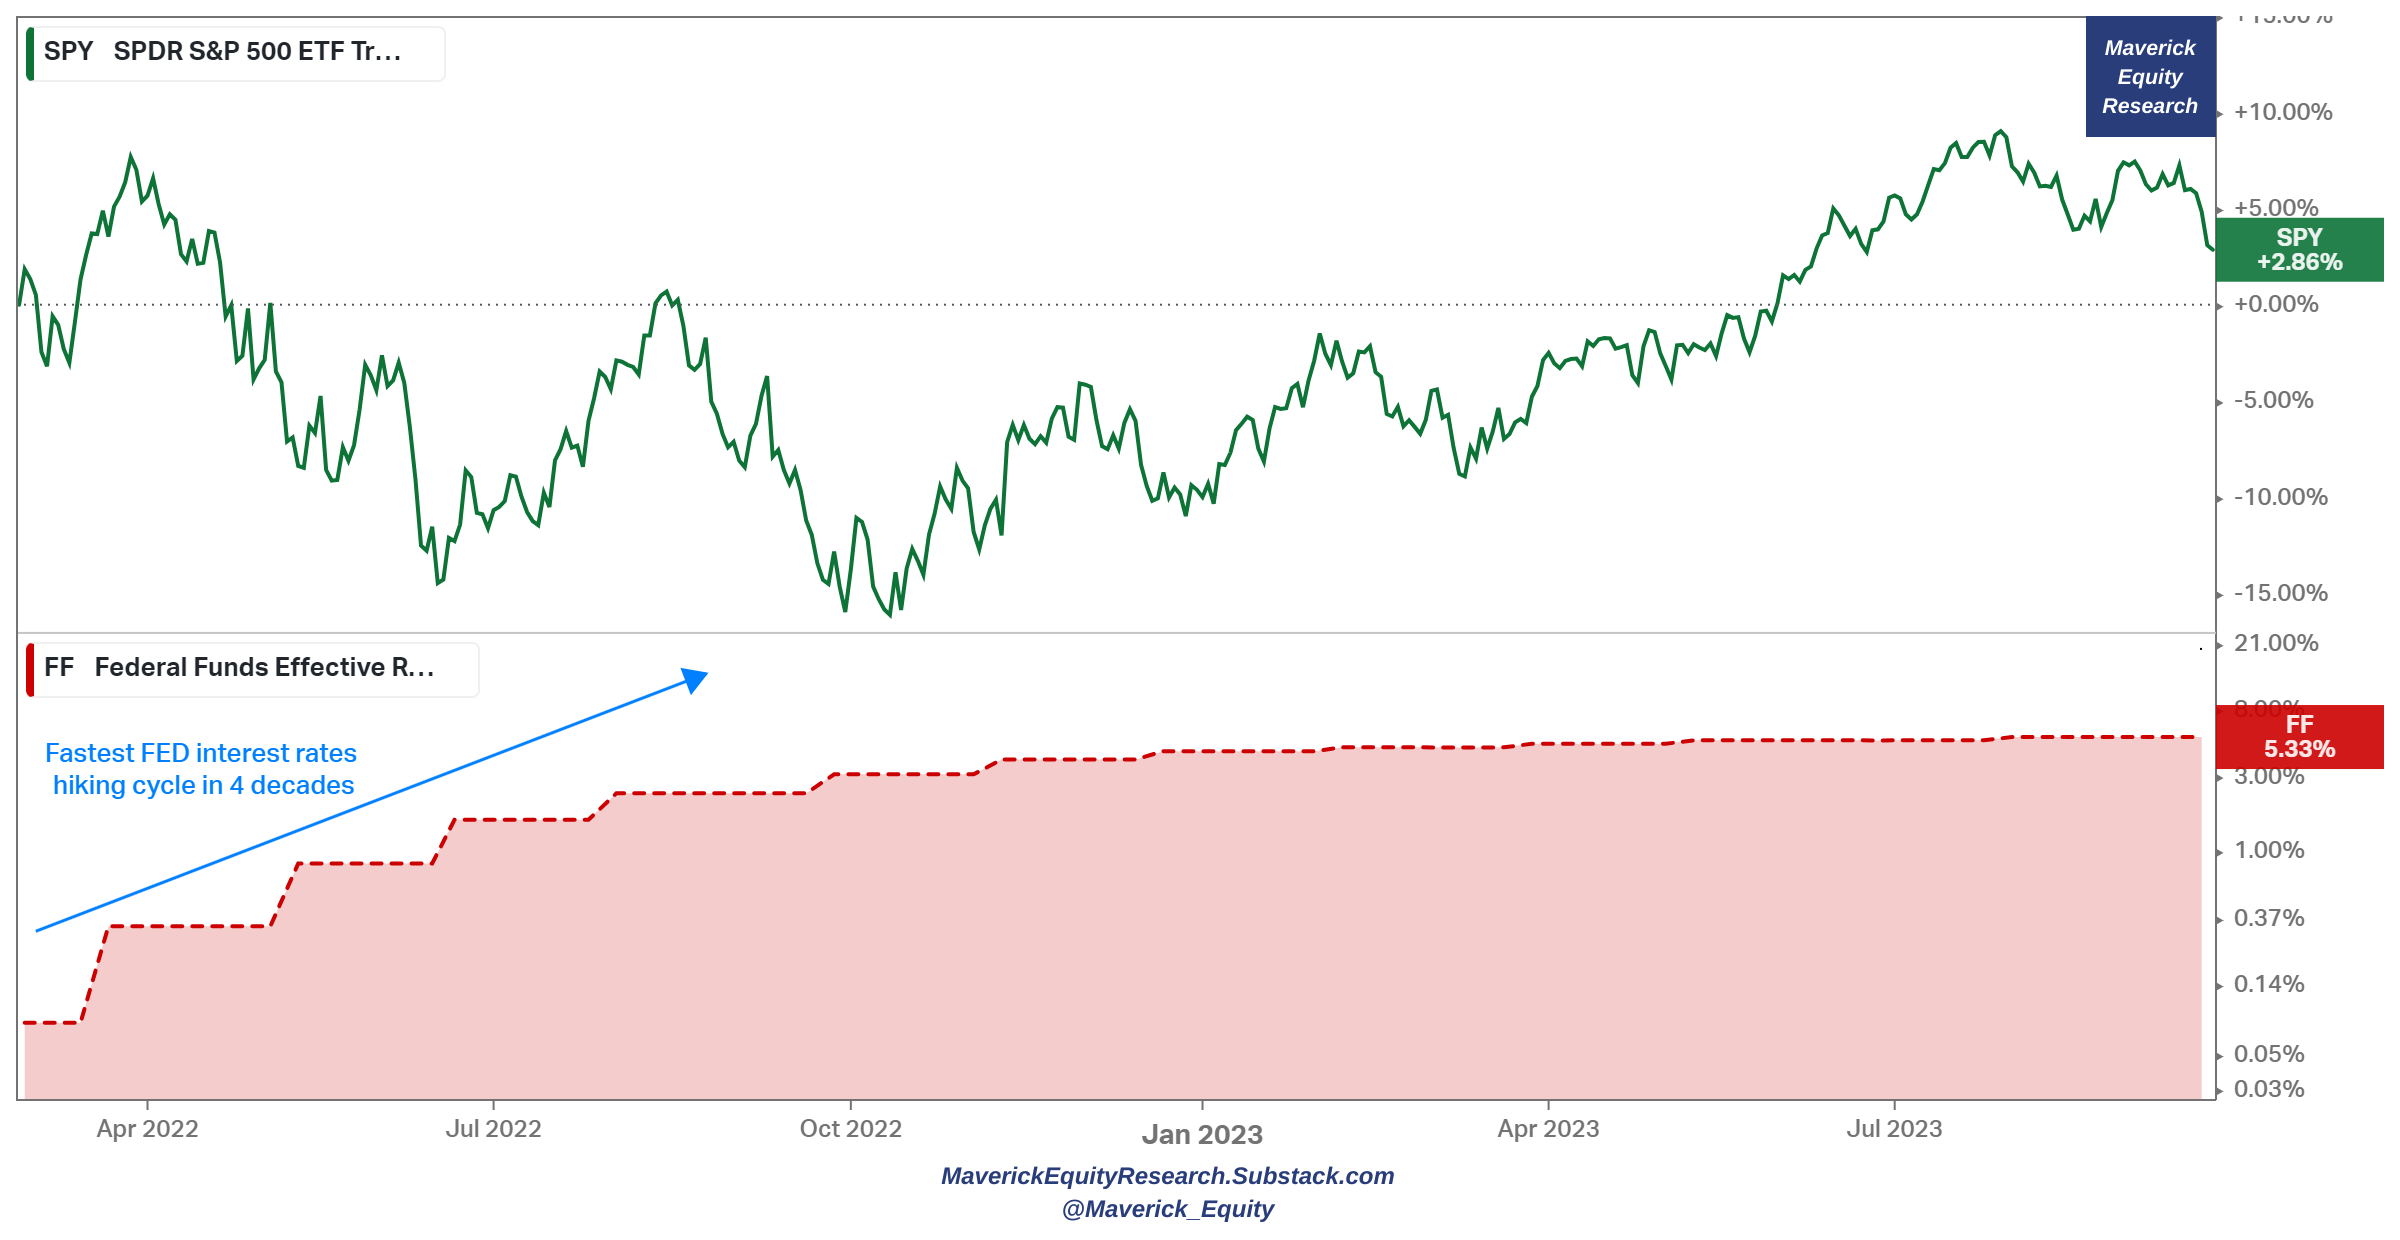
👉 interest rates a main talking point, S&P 500 (green) & US FED interest rates (red):
-
we went from 0% to 5%+ interest rates in no time = 2022 FED with the fastest interest rates hiking cycle in 4 decades, yet despite that outlier, stocks still +2.86%
-
stocks as a (natural) hedge to interest rates! Not the first time, nor the last …
👉 How does the S&P 500 perform around final interest rate hikes which we should have sooner rather than later? There you go:

👉 ‘AI’ mentions on earnings call rose sharply in the most recent quarter

👉 Top 5 stocks contribution by year since 2010:
-
Apple running the show
-
Big Tech domination present in the last years

This research is NOT behind a paywall & there are NO pesky ads floating around.
Did you enjoy this extensive research by finding it interesting, saving you time & getting valuable insights? Now some of you asked how can one support me which is really kind of you 🤗. Therefore, it would be great & highly appreciated if you would support an independent investment researcher for the ‘Maverick-esque’ ongoing & future research. A donation or a tip to support my work can be done via the following:
Twitter thread on this research piece can be found here.
Thank you & have a great day!
Mav

