✍️ Maverick Charts – Macro & More – November 2023 Edition #13
Dear all,
to all US folks, I hope your Thanksgiving holiday was a good one while for the international folks, a good refreshing weekend! I am back as well with your monthly Top 20 Macro & More charts from around the world + 5 Bonus!
Before that, from the legend Warren Buffett: “The most important quality for an investor is temperament, not intellect. You need a temperament that neither derives great pleasure from being with the crowd or against the crowd.”
-
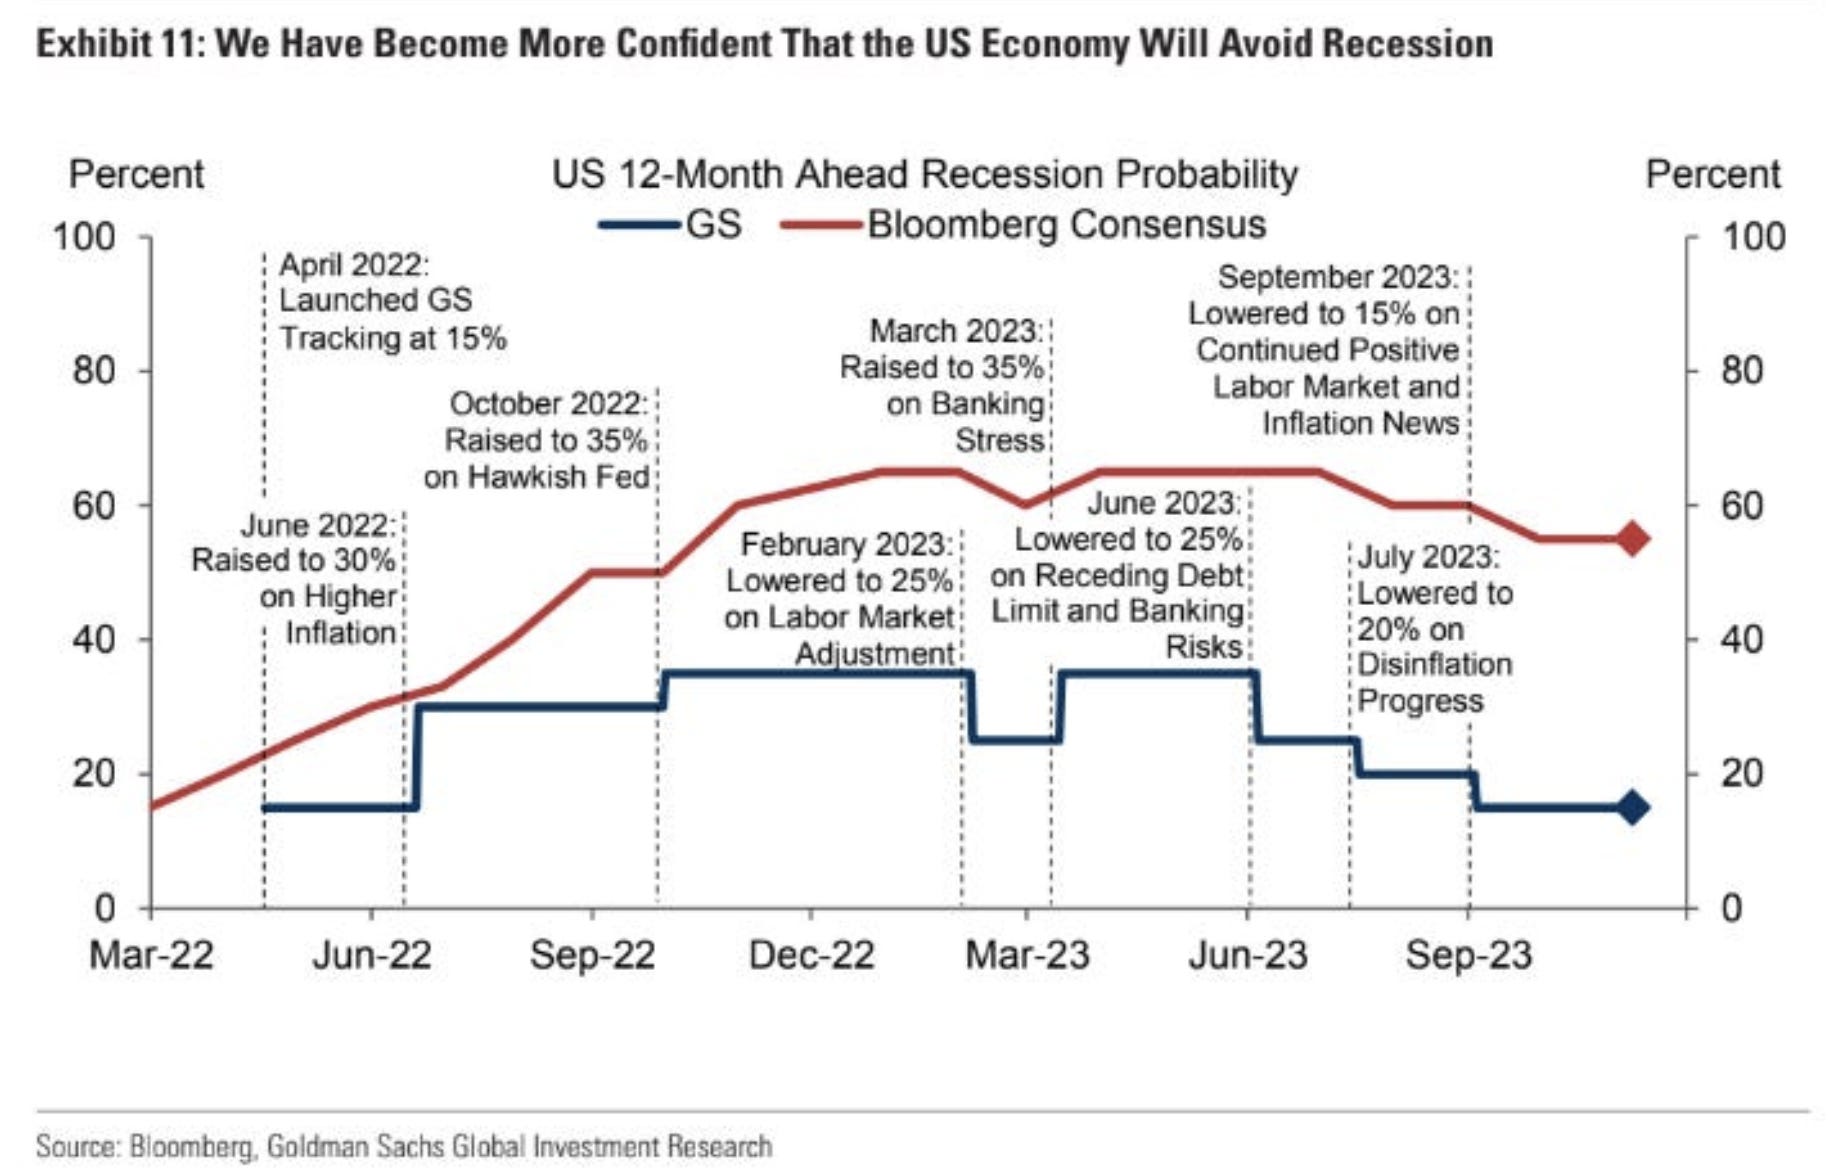
Goldman Sachs lowers the probability of a US recession while consensus around 50% chances, though dropped from 65%
“Despite the good news on growth and inflation in 2023, concerns about a recession among forecasters haven’t declined much. Even in the US, which has outperformed so clearly on growth in the past year, the chart shows that the median forecaster still estimates a probability of around 50% that a recession will start in the next 12 months. This is down only modestly from the 65% probability seen in late 2022 and far above our own probability of 15% (which in turn is down from 35% in late 2022).”
-
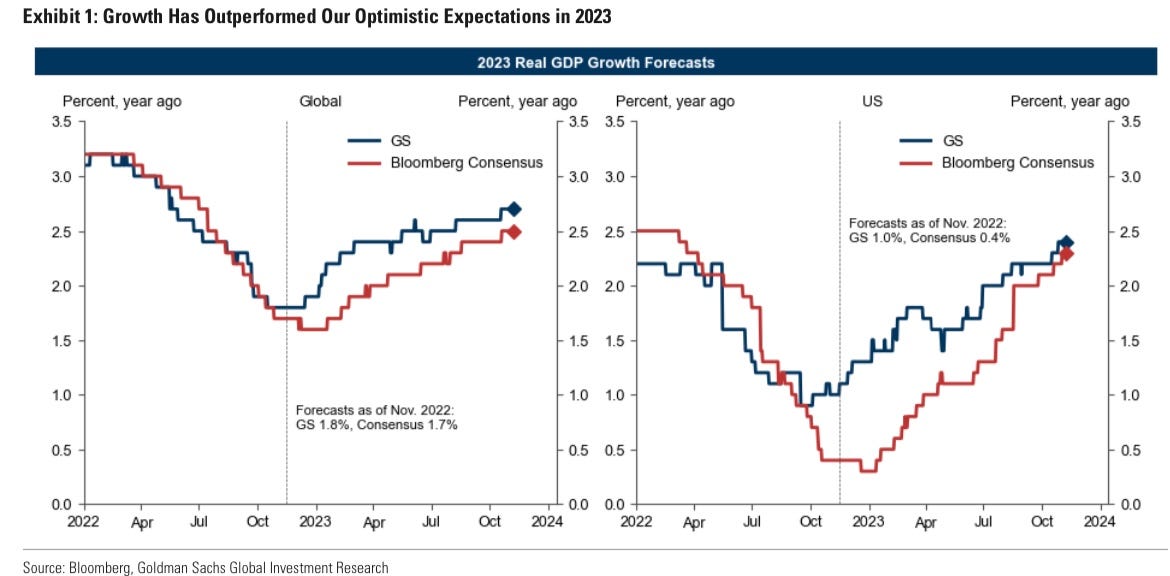
The US & global economy outperformed GS & consensus expectations in 2023
👉 US economy: GDP growth surpassing consensus forecasts by 2%
👉 global economy: GDP growth surpassing consensus forecasts by 1%
-
Small caps & Junk bonds getting good bids and inflows
👉 risky assets going up, traders see a soft landing for the US economy going forward

-
FED interest rates pricing:
👉 0% chance for more rate hikes, while 50 b.p. cuts by July are like a given 😉

-
Zooming out, let’s recall that we had 2 years & 7 FED anticipated ‘pivots’ …
👉 so is this latest one ‘the one’ ? Nobody can say with certainty but I believe we are strongly having rather sooner than later

-
Moody’s changed US rating outlook to negative while affirmed the AAA rating.
Cited the massive fiscal deficit & political polarization which exacerbates fiscal risks. “These projections factor in Moody’s expectation of higher-for-longer interest rates, with the average annual 10-year Treasury yield peaking at around 4.5% in 2024 and ultimately settling at around 4% over the medium term”
7 to 11. I don’t know why the surprise was so big for many out there, the data is clear:
👉 US public debt outstanding coupled with CBO projections
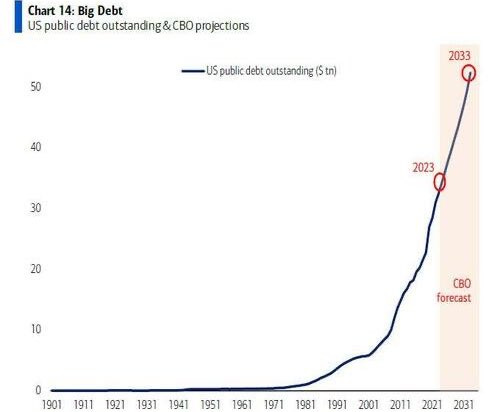
👉 and there you go also with the annualised debt payments per se

👉 If there was no big US fiscal spending, I believe many jobs would have been lost and we would not have record low unemployment levels currently

👉 Jep, not good for any debt rating in general, but in US case, not a biggie either:
-
USD world reserve currency status – if that’s not powerful, nothing is
-
Trusted by the world, can keep borrowing in its own currency
-
US economy the biggest one out there
‘Could the US default on its bonds ?’ Warren Buffett’s 2020 answer
👉 ‘Are US treasury bonds safe to invest in ?’ Greenspan’s answer valid also today (0:46):
12 & 13. With rising interest rates, what about debt and related interest payments for Corporations & the Consumer? This might surprise many, so let these sink in:
-
corporations have the LOWEST net interest expense since the 1970s … ‘but, how comes bro? Higher interest rates should mean higher debt servicing costs!’. Well, there is a reason why corporations have treasury departments: many companies had enough time in 2020 & 2021 to negotiate very low fixed rates, and they did it!
-
consumer, similar story: financial obligations as share of income is quite low …
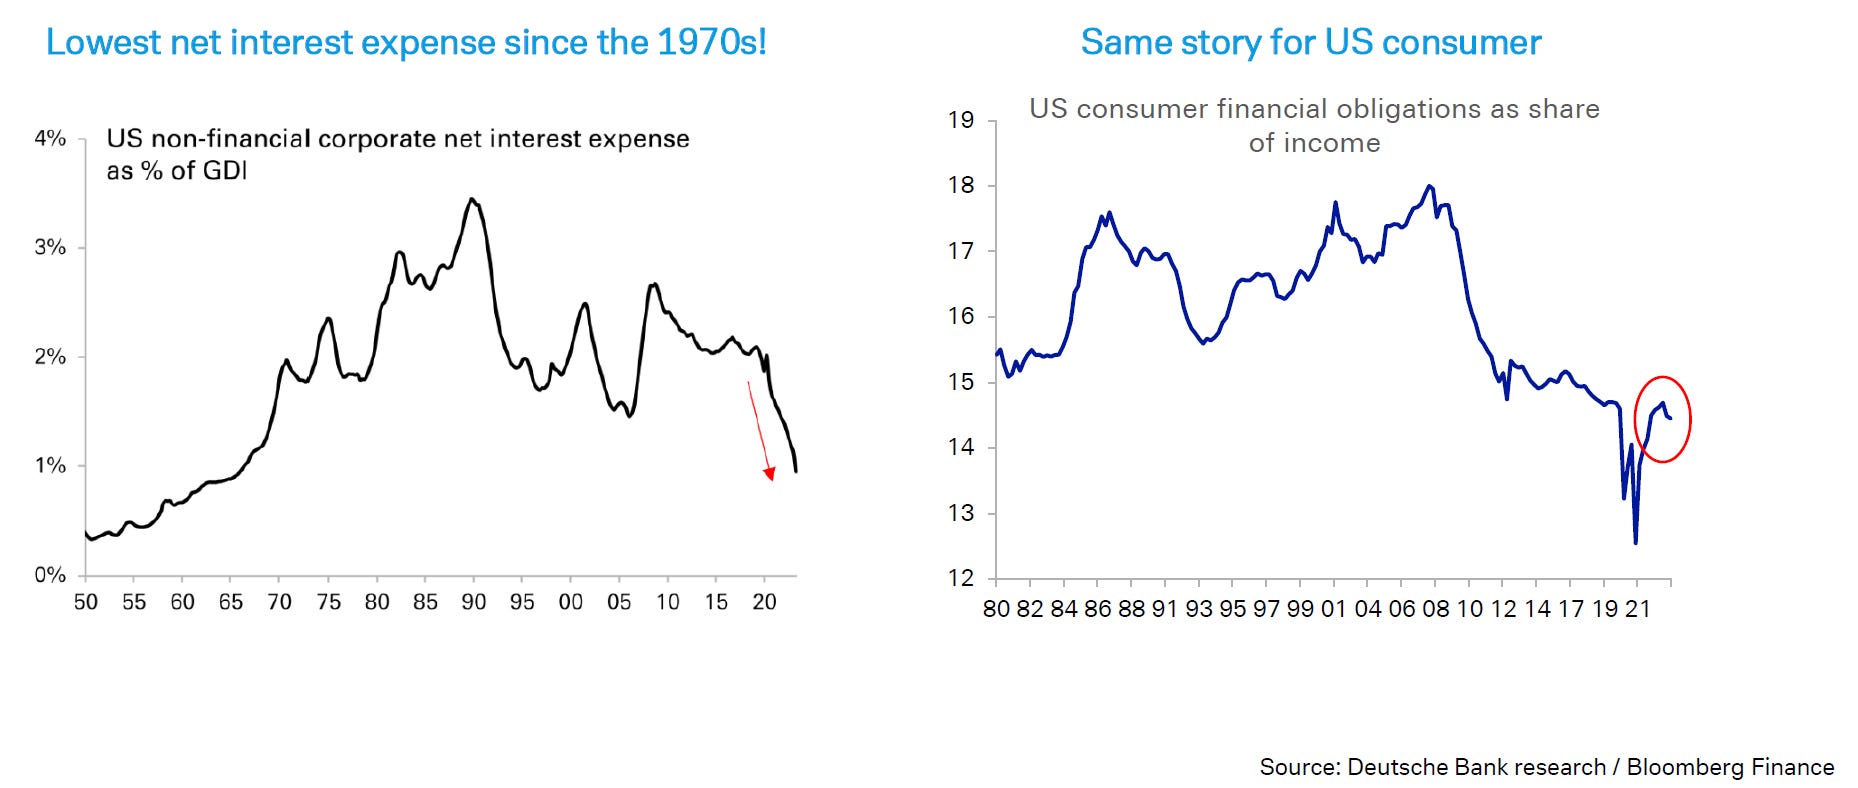
Key note: US is a special case given that other countries took rates differently

-
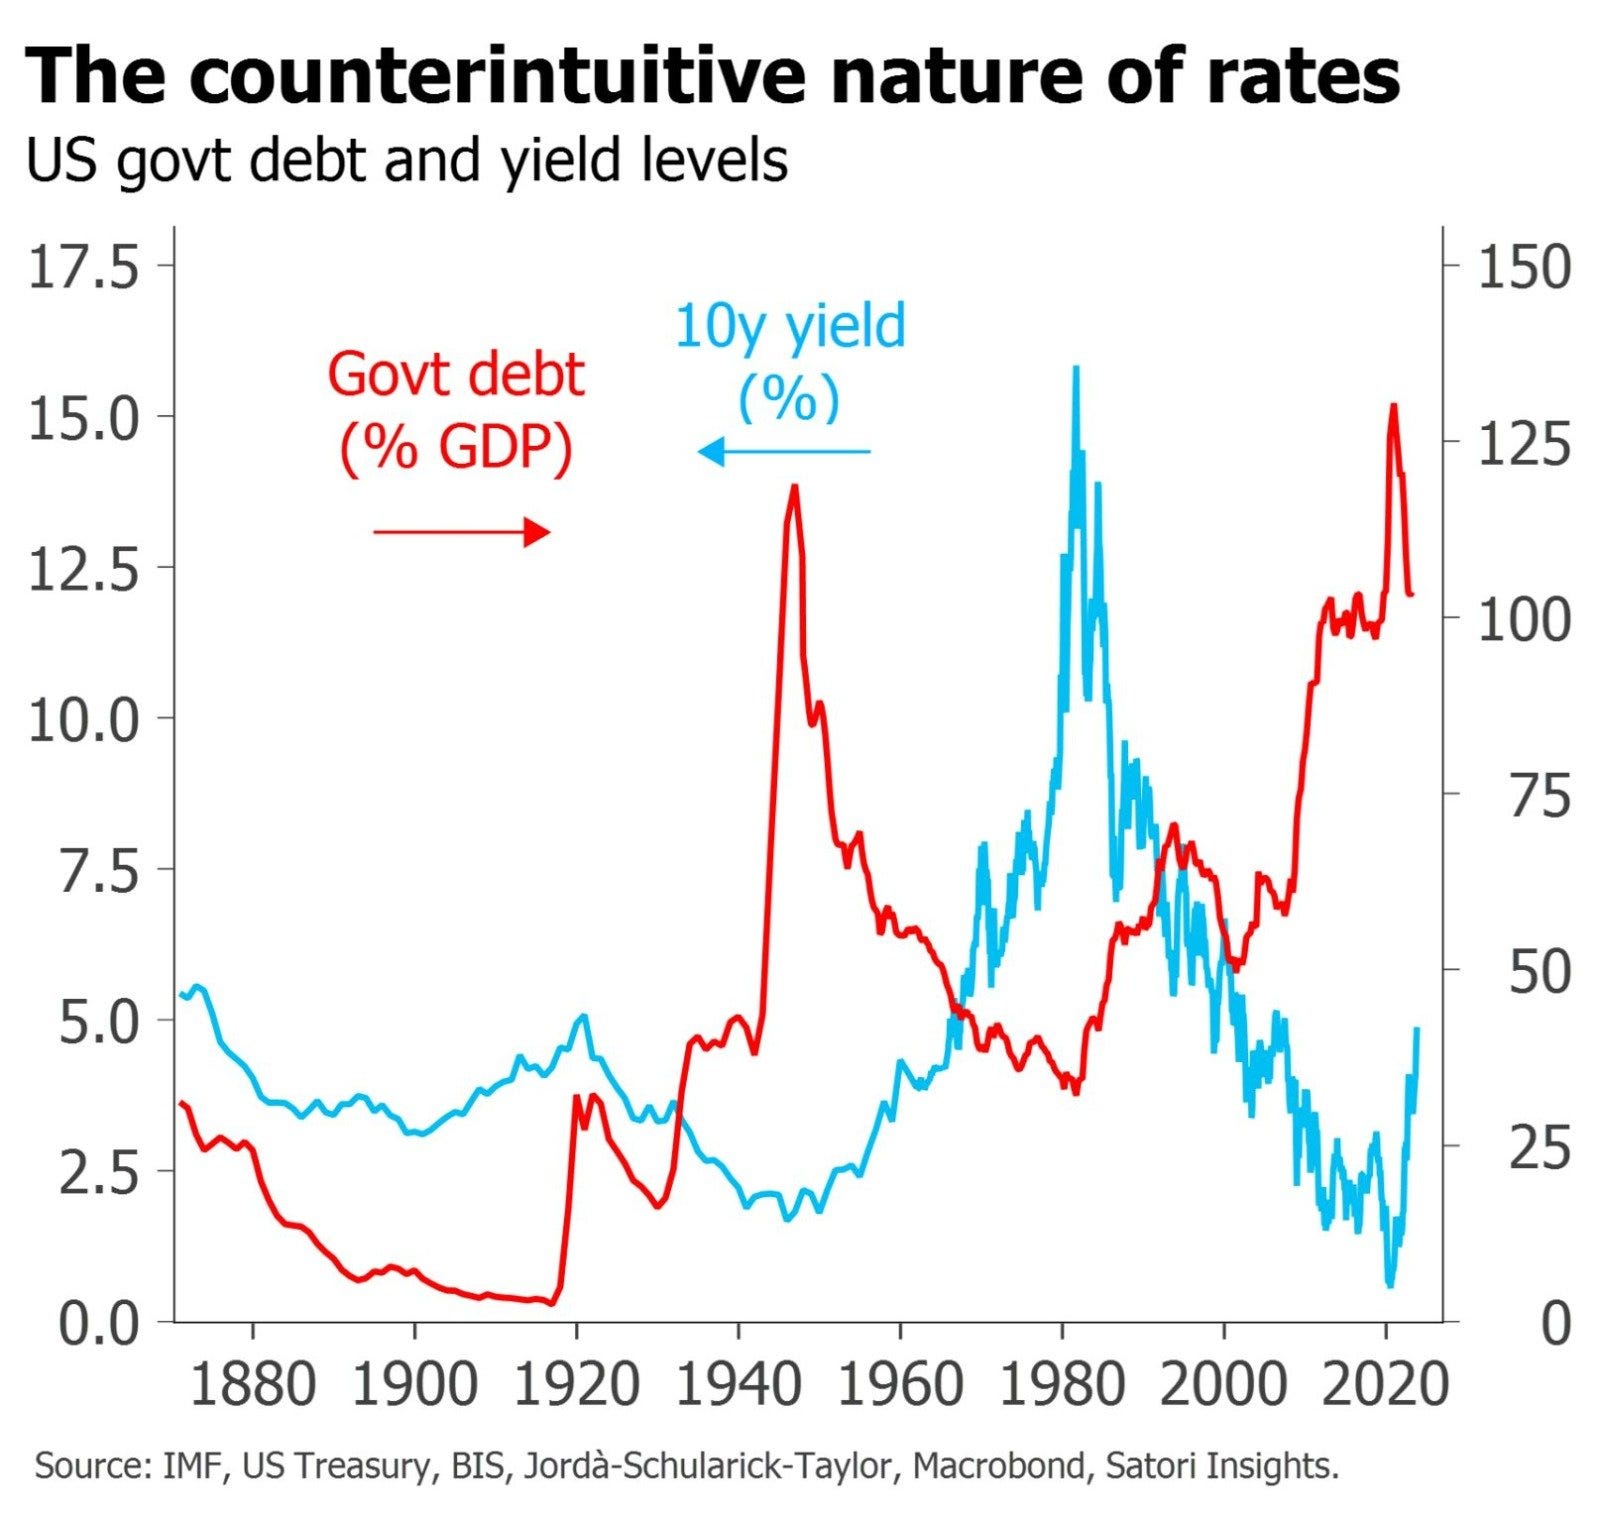
A very interesting chart, US Government debt and 10y yield levels since 1870:
-
we do not want both lines up together in the same time … but more like Maverick in Top Gun, meaning inverted & showing the bird aka the finger to the enemy 😉
-
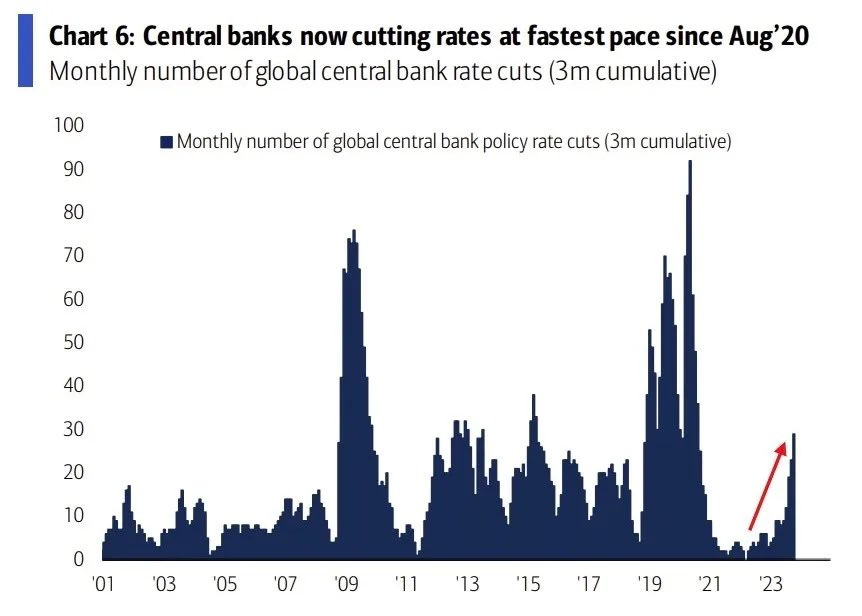
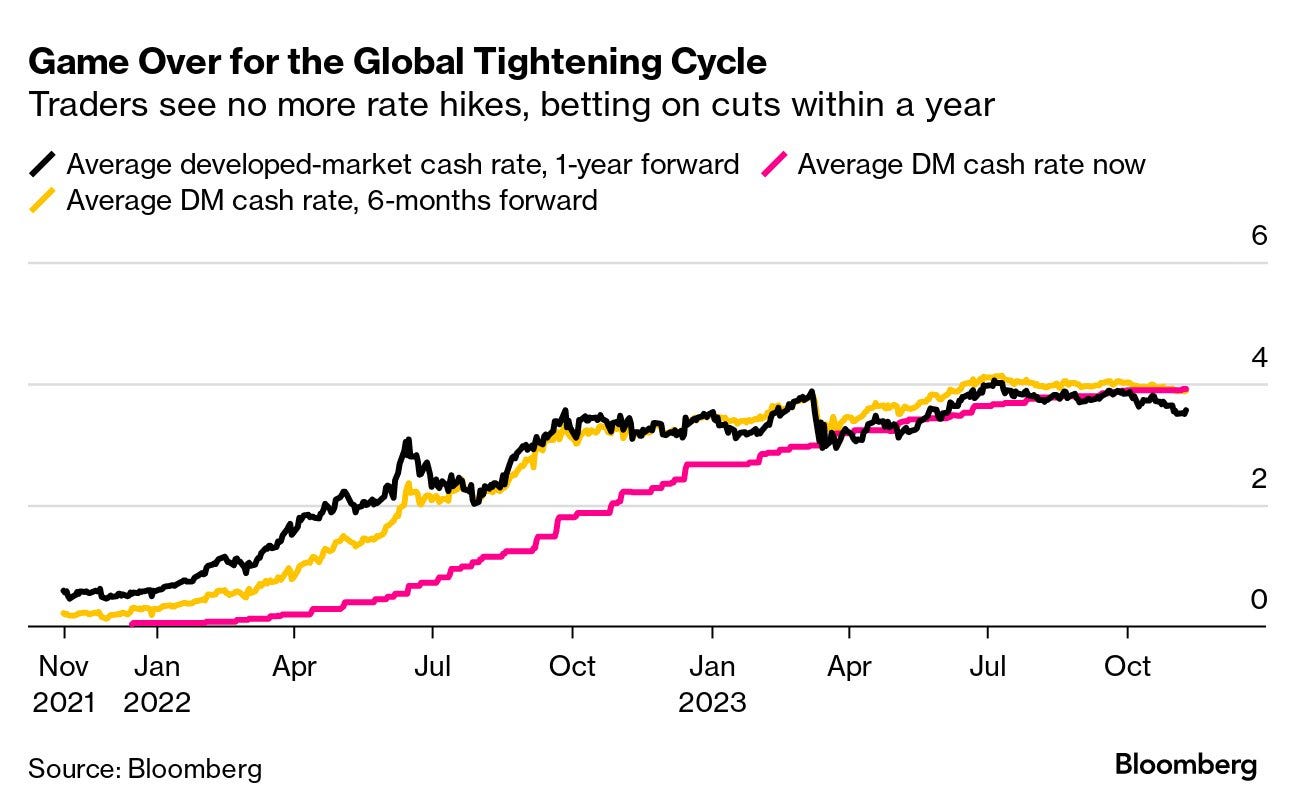
Are global central banks hiking or cutting rates? Let this one sink in:
👉 now cutting rates at the fastest pace since the 2020 pandemic
-
This is also seen via traders seeing no more rate hikes & betting on cuts in DMs
-
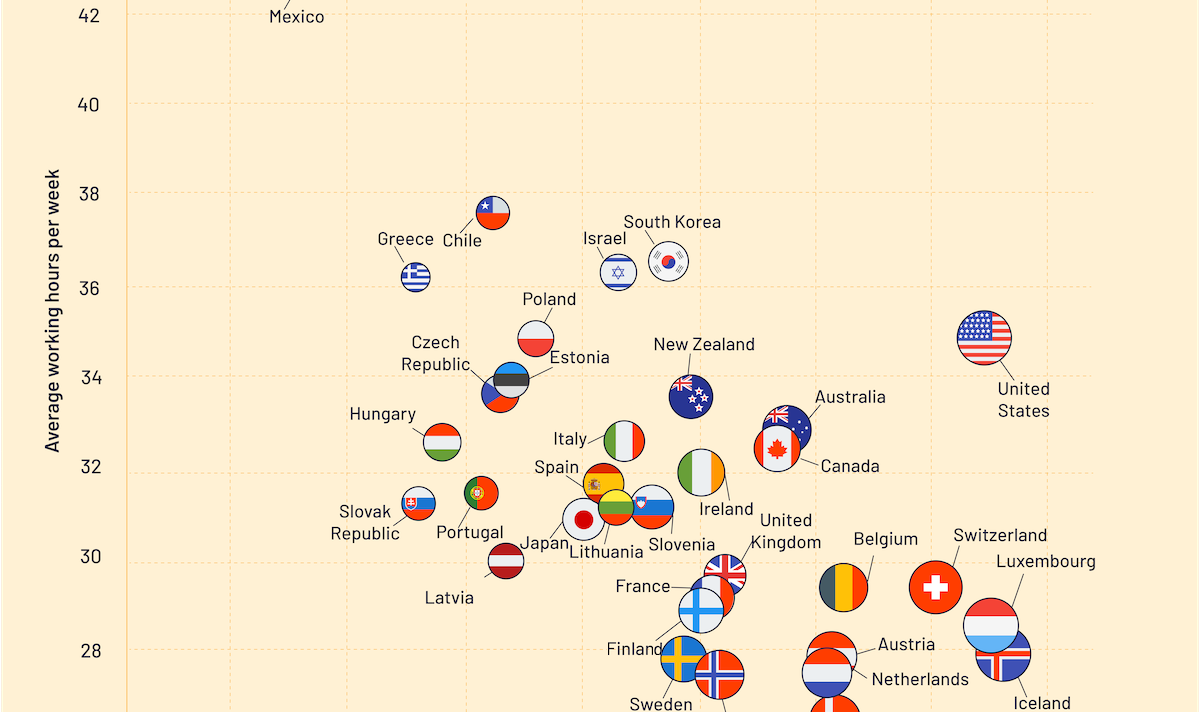
Hours Worked vs. Salaries in OECD Countries
-
your thoughts? your flag and that of neighboring countries very likely there
-
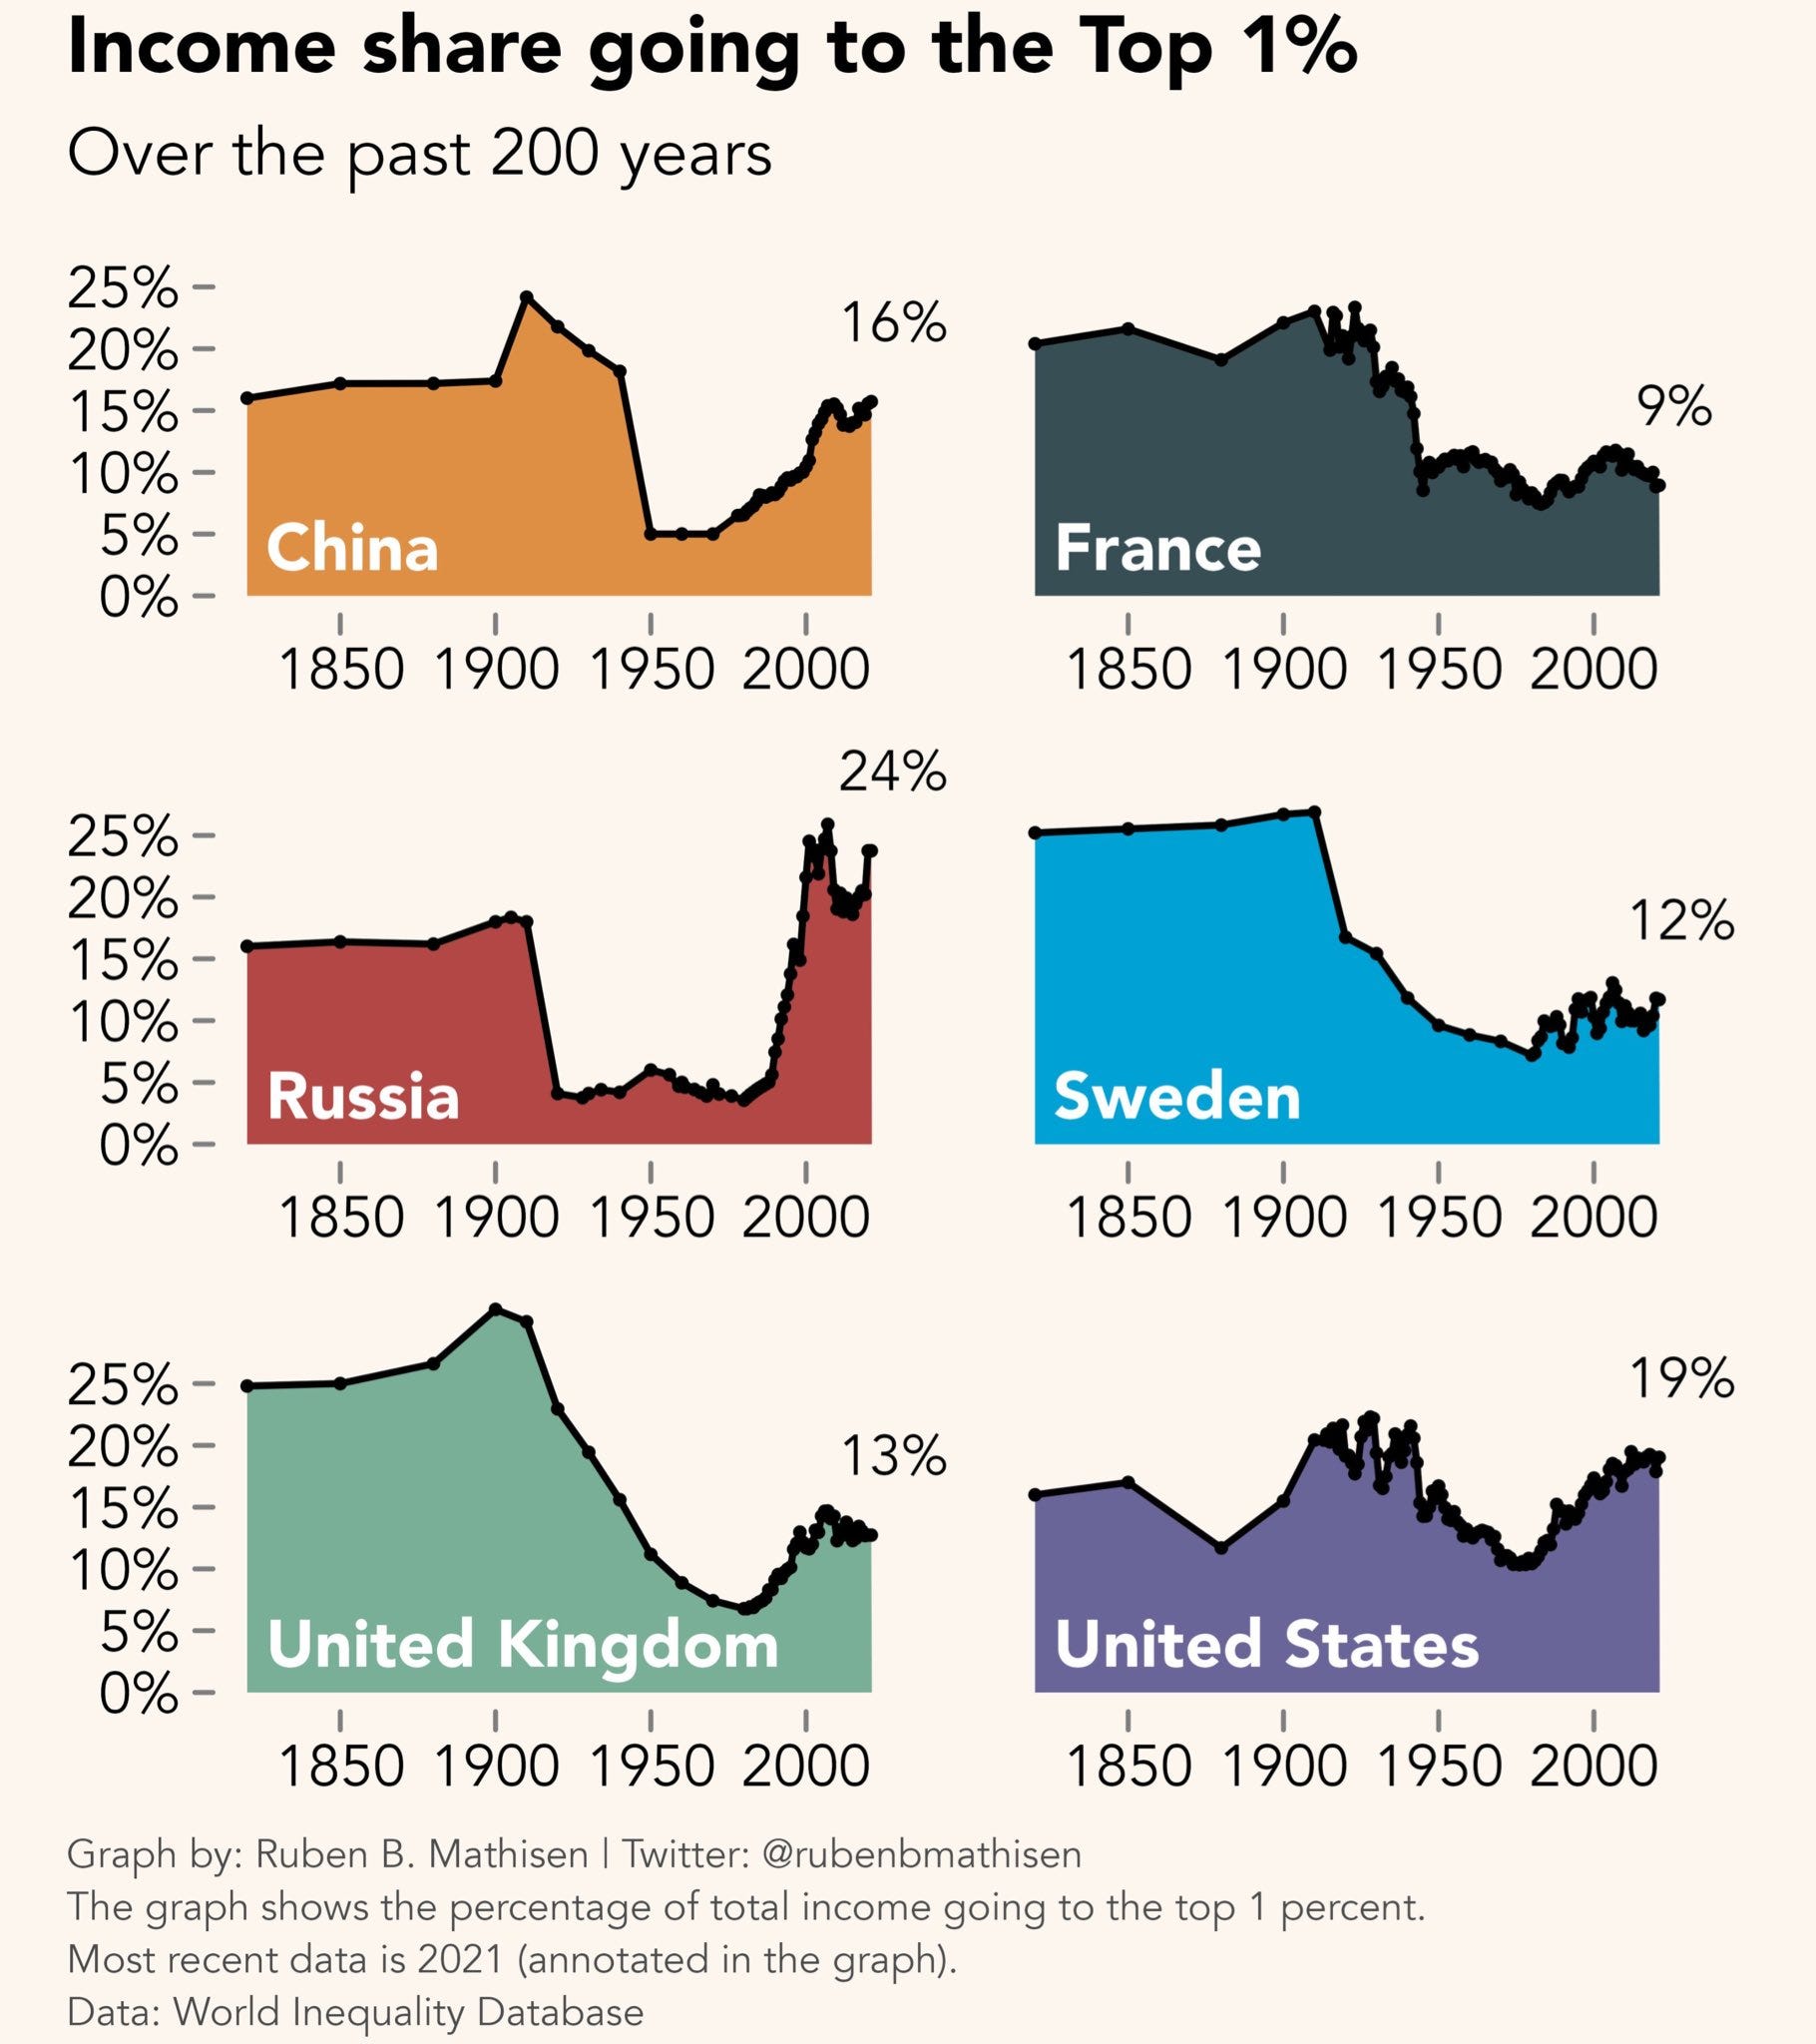
Income share to the top 1% over the past 200 years, a rare & great research:
-
since 1950s, mainly one direction: up and up, let that sink in!
-
Reasons? Many, I will just highlight 1 counterintuitive & 2 obvious ones:
👉 obvious one: tax on labor >>> tax on capital
👉 counterintuitive one: compound interest as many folks do now own assets
👉 the massive innovation after WW2, Industrial Revolution … winner takes it all …
Would be great to hear your thoughts as inequality is quite a topic no matter what …
19. US 10-year average inflation rates and US birth rate:
-
long-term demographic trends may keep inflation low
-
more correlation more causation here? Inflation is like the world: complex, multi-faceted and nuanced … we can’t be put into 1 single chart, but interesting chart nonetheless … food for thought …

-
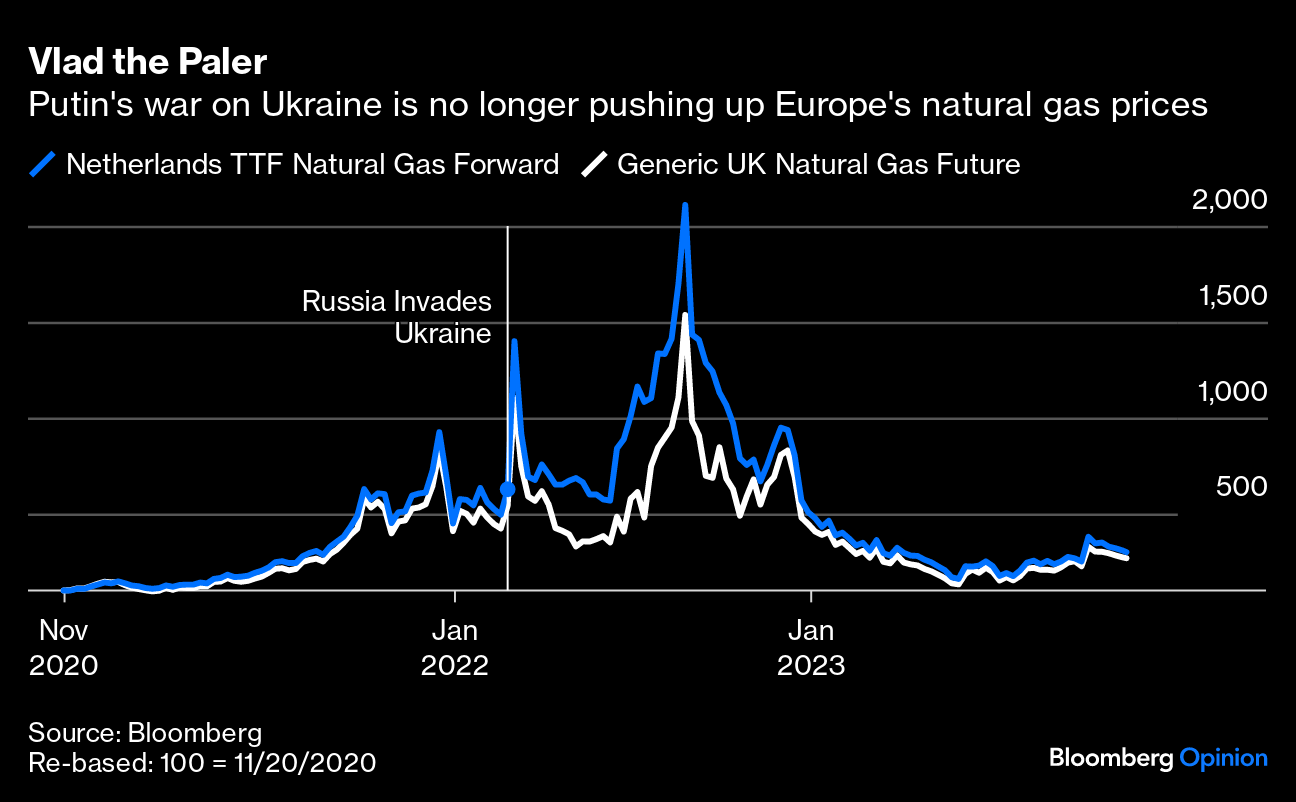
Europe’s natural gas prices chilling after 2 parabolic spikes since the invasion
5 Bonus charts:
-
The Most Innovative Countries in 2023 – Ranked!
👉 Top 10: Switzerland, Sweden, U.S., UK, Singapore, Finland, Netherlands, Germany, Denmark and South Korea.

-
Ranked: Share of Global Arms Exports in 2022
👉 2022 global military budgets hit $2.2 trillion, an 8th consecutive year of increase
👉 US, Russia, France, China, Germany, Italy, UK, Spain, South Korea & Israel top 10

-
Best & Worst Companies for Employee Retention – some you’ll find surprising
-
energy with the longest tenures while tech giants with the shortest

")
-
Visualizing All the World’s Carbon Emissions by Country

-
The World as 1,000 People
👉 The world’s population has doubled in size over the last 50 years
👉 In 2022, we reached the mark of 8 billion living on Earth. According to UN estimates, by July 2023, all the people in the world numbered 8,045,311,447
👉 Imagining Earth with only 1,000 people helps illustrate population concentration and dispersion: for example Asia is by far the world’s most populous region with over 4.7 billion people. Led by India and China, it represents 59% of the total population.

Research is NOT behind a paywall & NO pesky ads. What would be appreciated? Just sharing it around with like-minded people & hitting the ❤️ button. This will boost bringing in more and more independent investment research … . Thank you!
That’s all for ‘Maverick Charts – Macro & More -’ November 2023 edition.
Have a great week!
Mav 👋 🤝