✍️ Maverick Charts – Macro & More – October 2023 Edition #12
Dear all,
with October ‘closing the books’ soon, your monthly Top 20 Macro & More charts from around the world + 5 Bonus! Before that, from the legend Charlie Munger:
“You don’t have to be brilliant, only a little bit wiser than the other guys, on average, for a long, long time.” = persistence and consistency wins over > occasional brilliance
-
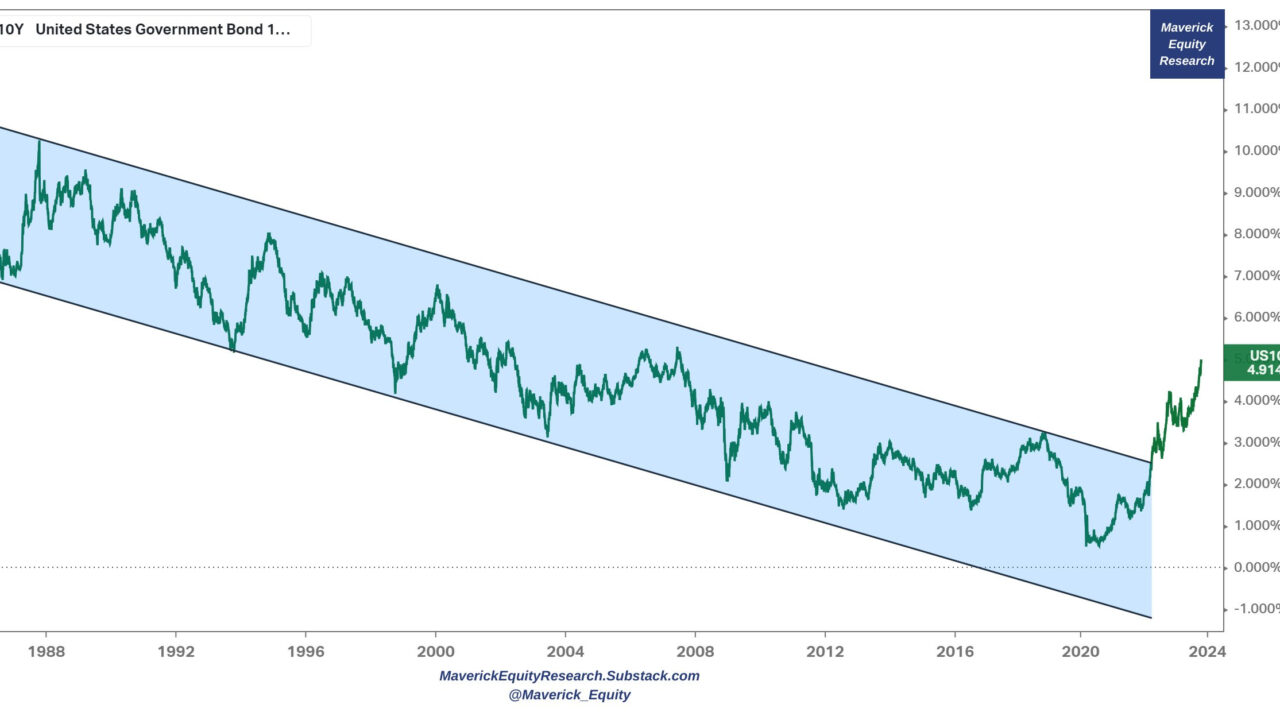
Can the 10-year US yield go to 6% or higher?
👉 5.5% is quite likely, how? See how the 10-year (green) often meets, kisses and even surpasses the FED funds rate (dashed blue)
👉 6%, less likely but possible? yes … If it goes to 6-7%, would be a great opportunity to lock-in some risk free yield … especially hunting for a good Yield to Maturity (YTM) across the treasuries curve … even at this levels goodies are to be found …
N.B. working now on a comprehensive piece about ‘Investing in Bonds’, stay tuned…

-
After trending down for decades, channel is broken big since the mid of 2022
-
Who owns the US treasuries market by the way? Some key notes:
👉 the big share of foreign investors since the 2010s
👉 households owning more and more though note a fact quite unknown: in this bucket also hedge funds are included … which is strange if you ask me, can’t find a rationale for that yet … if you do, please let me know
👉 the FED and active mutual funds lowering their holdings lately

-
Foreign investors holdings side note that:
👉 China has been lowering their holdings since the mid 2010s
👉 which is the lowest level since 2009

-
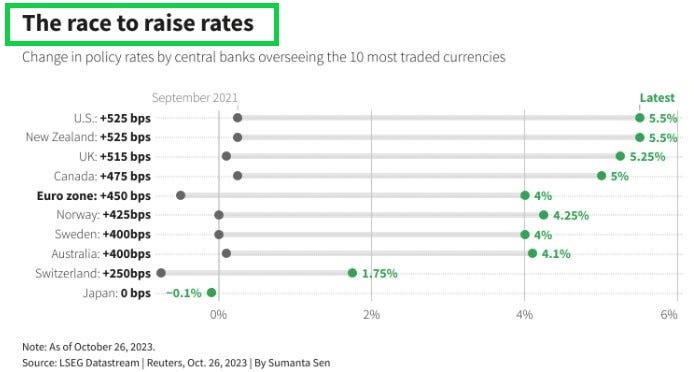
The Race to Raise Interest Rates since 2021 across the world in 1 chart:
👉 one of the fastest hiking cycle in decades – ‘ no wonder bro’ ‘, just check inflation
👉 ‘any good thing with this bro’?’ Yes, cash/bonds pay nowadays, even in real terms
-
Tight conditions indeed financing wise:
👉 Financial Conditions are in ‘restrictive conditions’ territory as GS model shows

-
US Yield Curve: % Share of the Yield Curve Inverted
👉 70% now, previously 74%
👉 Key bond yield spreads: 30y/10y, 10y/2y, 10y/3m

-
Note how yield curve inversions did precede recessions, yet let this one sink in:
👉 they were caused by a higher real cost of money (FED funds – Core CPI)
👉 which ain’t high these days, right?

-
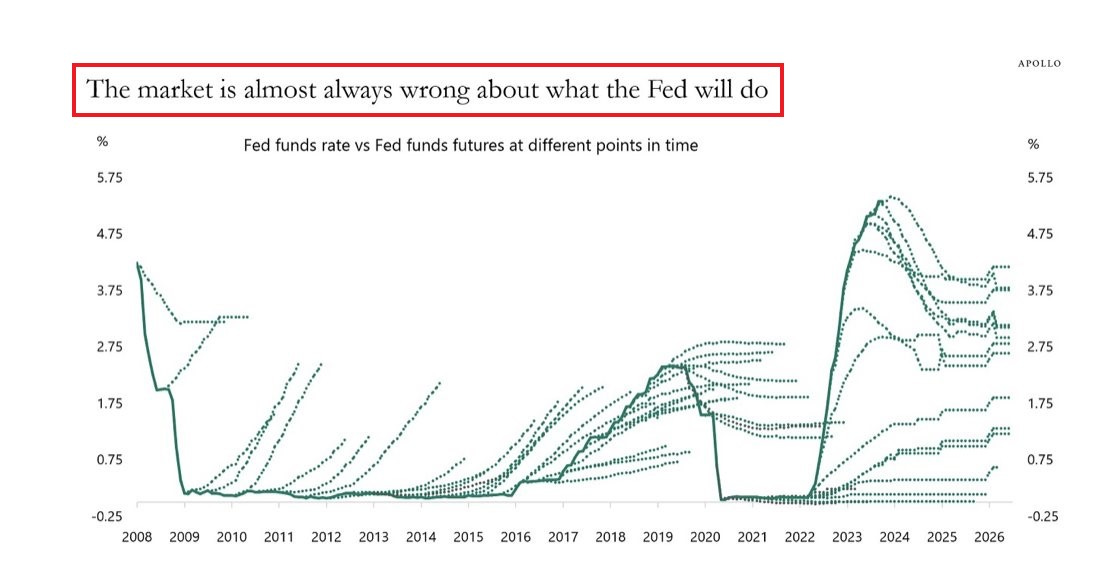
The FED vs The Market on interest rates direction:
👉 across time and especially nowadays, I saw a lot of people (no name calling here) be it more or less qualified to bash the FED, but what what the market as a whole thinking they are ahead of the curve and know what FED will do going forward?
👉 well, guess what, the market overall is almost always wrong about the direction …
👉 take-away: we need to think in terms of probabilistic outcomes, and not in terms of deterministic ones … various scenarios and reaction to it …
-
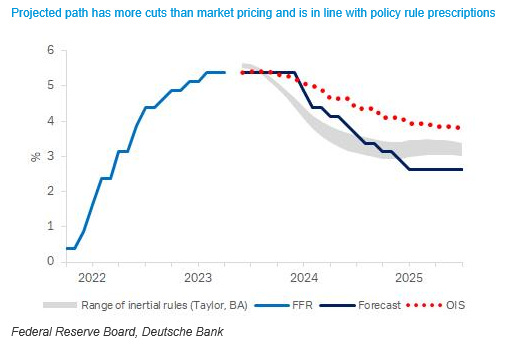
Which begs the question, what is the market thinking currently?
👉 via various Taylor rules done by DB, we get a current interest rate path that is LOWER than what is implied currently by the market
-
Real Rates matter way more as nominal rates are just / ‘just’ nominal:
👉 here we see the 10-year real rate at 2.4% and how historically it hurts parts of the economy and/or investment themes
👉 I would see it as opportunity to get paid in real terms for low risk bond allocations and also a way to clean-up excesses in the economy (bad business models & frauds holding hostage both financial resources and human capital)

-
Not all real estate/mortgage markets are created & are equal at any point in time:
👉 Given high interest rates, a natural focus is on the mortgage market and below the distribution of the types of mortgages in the system in various DM countries
👉 US has a big chunk of mortgages with fixed interest rates on the short term which should cool-off a bit the constant doom & gloom headlines with ‘mortgage rates at record levels’ etc …
👉 on cutting rates across the world, one can also say that by looking at this the FED is likely not the first one to blink and cut rates

-
Sure, high mortgage rates are not good for people planning to take a mortgage for a home, but you know, when rates were low, we had the issue of ‘punishing the savers’ … I guess, one cannot make everybody happy and nor the economy 😉

P.S. on mortgages with distribution by interest rates and more, check my earlier take ✍️ The State of the US Economy in 35 Charts in case you missed it
-
113 Million People Will Join the Global Middle Class in 2024
👉 defined by the World Data Lab as someone who spends at least $12 per day (measured in 2017 purchasing power parity), these individuals are typically rising up in developing regions like Asia and Africa.

-
Visualizing the Top Countries by Wealth per Person
👉 check both the mean/average & median values … tells quite something …

-
Comparing the GDP of BRICS and the G7 Countries

-
Which Countries Have the Highest Investment Risk in 2023?
👉 Investment risk is defined here via the big 3:
Political risk: Type of regime, corruption, level of conflict
Legal risk: Property rights protections, contract rights
Economic risk: Diversification of economy
👉 higher returns ‘require’ higher risk in general … with the exception of deep research via spotting asymmetries: human behavior can be emotional and create chaos but in investing also big opportunities …

-
The Cities With the Most Bubble Risk in Their Property Markets
👉 Zurich, Tokyo, Miami, Munich and Frankfurt top 5

-
200 years of Global Gold Production (supply) in one chart:
👉 2022 estimates are for 3,100 tones
👉 China the biggest producer as it overtook South Africa in 2007; Russia, Australia, Canada and US follow in the top 5
👉 Gold mining has been around for thousands of years, but note that 86% of all above-ground gold has been mined in just the last 200 years – Let that sink in!

-
The Lithium Rush: Can We Meet Tomorrow’s Lithium Demand?
👉 Without action, by 2030, there won’t be enough lithium to meet the combined demands of the clean energy transition and the UN’s sustainable development goals.
👉 However, advances in DLE by pioneering companies like EnergyX could help meet the demand and ensure the transition to a more sustainable future

5 Bonus charts:
-
The Number and the evolution of Democracies Globally
👉 since the end of WW2, the number of democracies overtook the non-democracies
👉 after 2 decades with e clear democracies majority, the world is not evenly split
👉 note the countries where elections got LESS free and MORE free

-
The Most Carbon-Intensive Sectors in the World
👉 utilities, materials, energy, industrials and consumer staples with the biggest carbon footprint
👉 I guess we can’t have our cake and eat it … but for sure a lot can be done by each of us regular folks (food, energy waste etc) and big corporates & governments

-
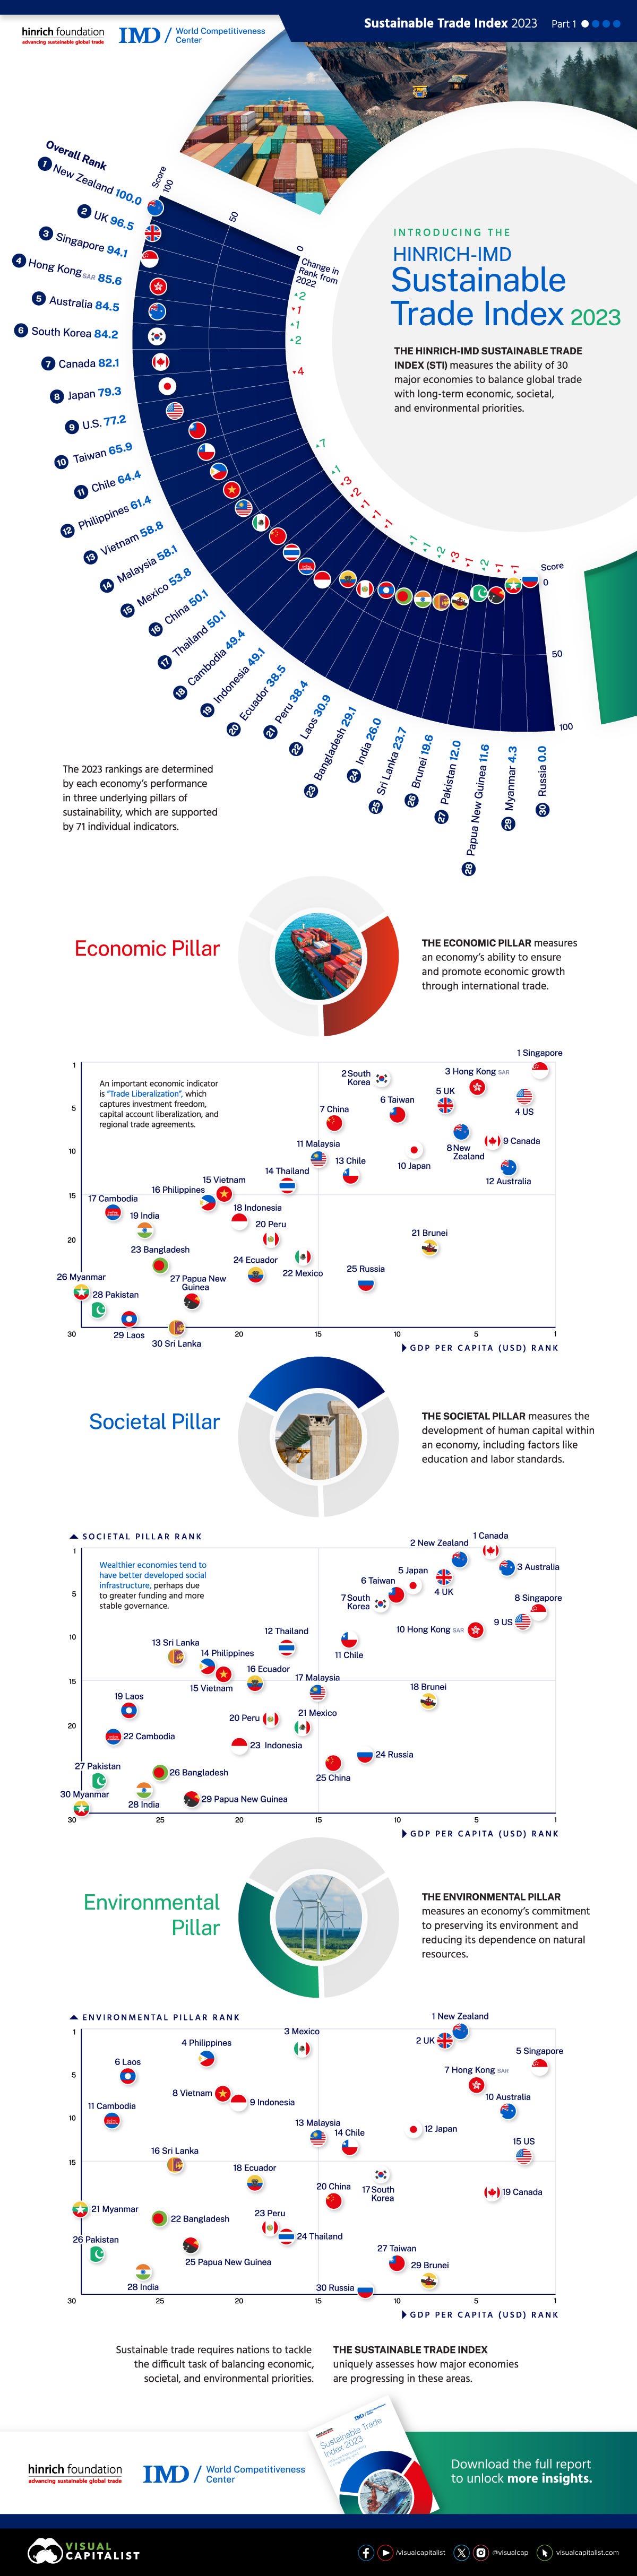
Ranked: The World’s Most Sustainable Economies in 2023
👉 New Zealand, UK, Singapore, Hong Kong and Australia leading the pack
-
All of the World’s Exports by Country in One Chart
👉 China, US, Germany, Netherlands and Japan the top 5

-
And now top 10 Automotive exporters which account for 95.4% of the global pie

Research is NOT behind a paywall & NO pesky ads. What would be appreciated? Just sharing it around with like-minded people & hitting the ❤️ button. Thank you!
That’s all for October. Have a great next week & next month!
Mav 👋 🤝

