✍️ Maverick Charts & Markets – February 2024 Edition #15
Dear all,
first of all, welcome to the 507 new readers for a total of 5,507! The independent investment research here is now read across 132 countries & 50 US states!
Despite working in various headquarters in European banks, my work likely did not reach directly more than 500 people at any time (confidential/secretive/sensitive etc), hence a 10x bigger reach now is quite a number … !
There you go with February’s 25 charts storm covering Macro, Stocks, Bonds & More which also naturally connects the dots with many aspects of Geopolitics.
Research is NOT behind a paywall and NO pesky ads here unlike most other places!
What would be appreciated? Sharing, restacking it around with like-minded people and hitting the ❤️ button. This will help bringing in more & more independent investment research!
Let’s begin with 2 charts on US monetary policy and inflation that I was humbled to have them liked and retweeted on Twitter by the great Danielle DiMartino Booth (CEO & Chief Strategist, QI Research LLC, Fmr Federal Reserve insider, Economist):
-
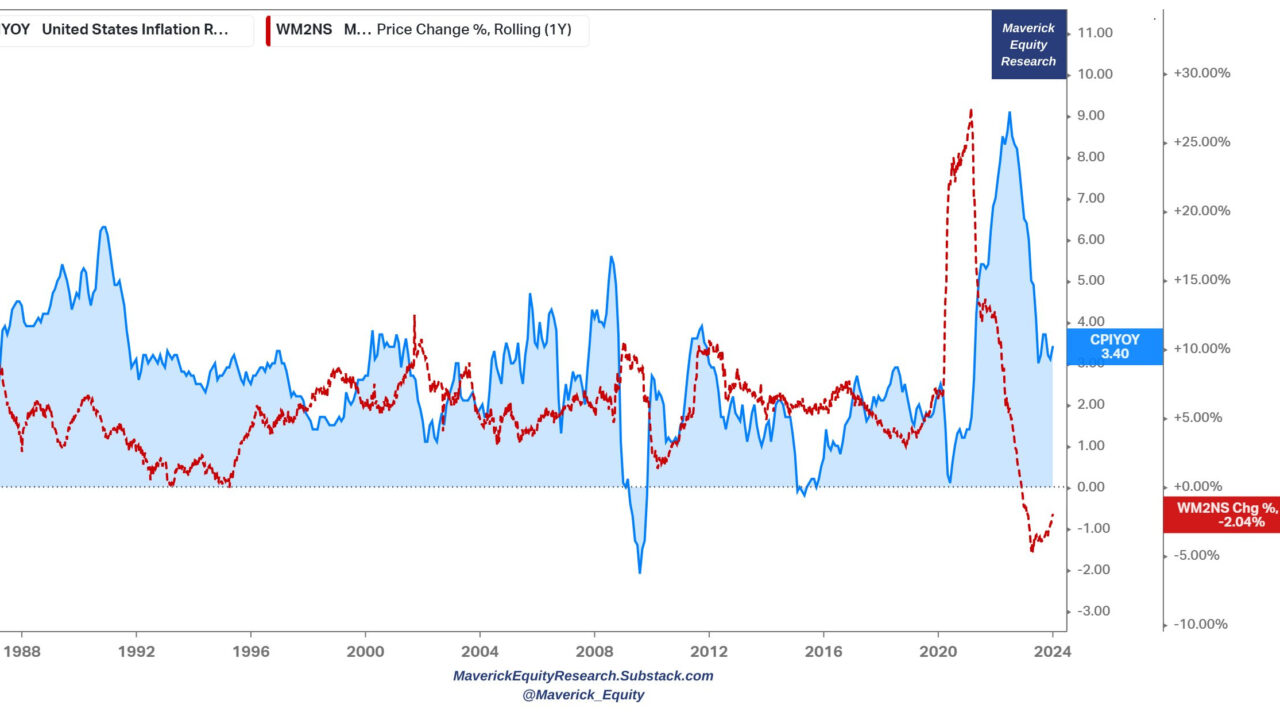
M2 money supply growth (red) and inflation (blue):
👉 M2 with a negative growth of -2.04% working to make inflation low / back to target
👉 note how the -4.63% growth last year was a rate that meant it was the fastest pace of money supply compression since Jan 1933 … let that sink in!
👉 note also how once the 2020 pandemic broke, M2 went parabolic growing even at +25% … and quite safe to say it played a big role in the inflation spike that came after …
👉 FED bazooka deployed once Covid, bazooka being removed once inflation showed it’s teeth … and now feeding through the system in order to normalise inflation
-
M2 growth (yellow, 16 months lead) with US CPI (blue) from Q1 2023 as well
👉 making the case how M2 growth plays quite a leading role driving inflation
👉 key note: chart is from Q1 2023 & looking at the M2 growth as a leading indicator, it points to a lowering inflation trend which is what happened in the last year …
👉 I’ll update this chart as of nowadays in my special report on Inflation that’s now work in progress … while the key point is the following: M2 money supply growth mattered on the inflation’s way up, and it matters also now on the way down, hence if inflation is a lot a monetary phenomenon (which I think it is), I would look at it …
Complementary note for now and going forward: AI breakthroughs are deflationary and a material factor, hence the latest sustained drop in inflation …

The 2 original tweets with more than 27,000 views if you want to engage in the inflation discussion https://twitter.com/Maverick_Equity/status/1756793087106437163:
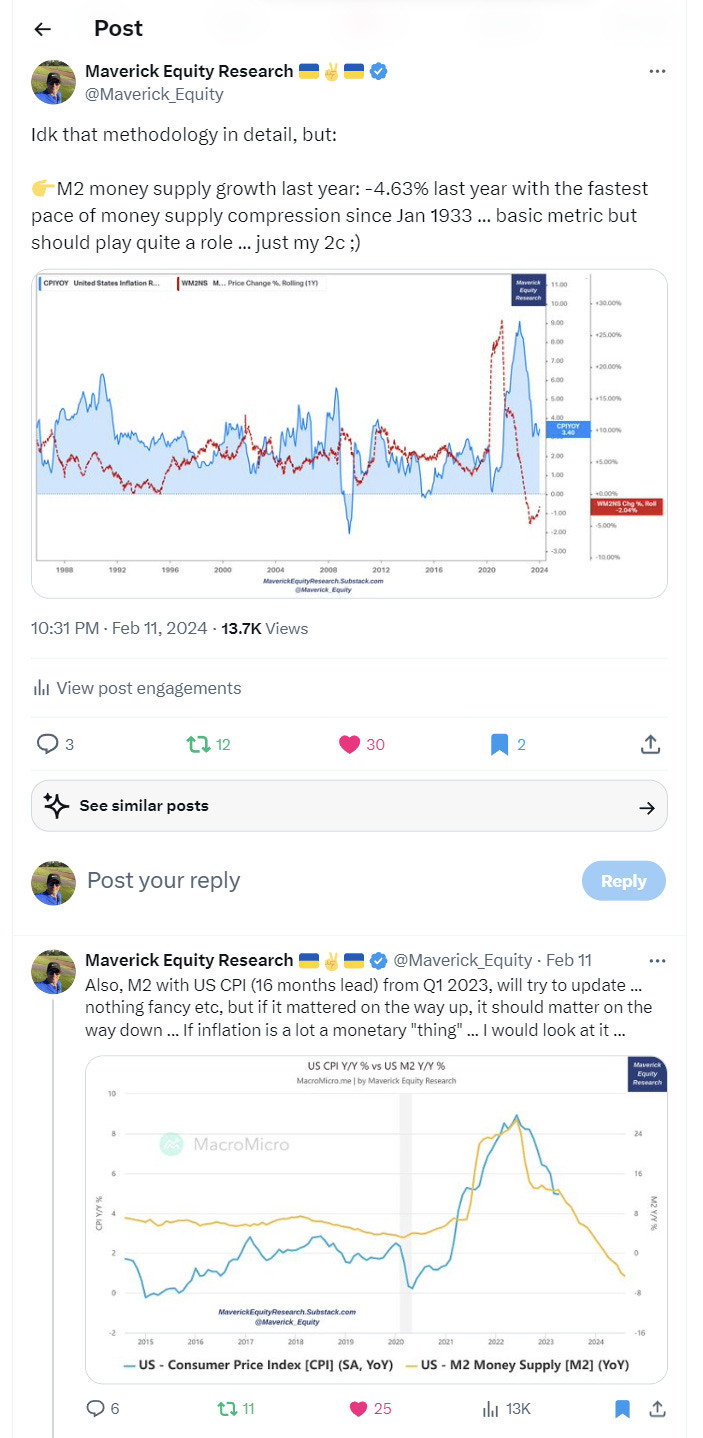
and Danielle’s retweets … thank you Danielle!

-
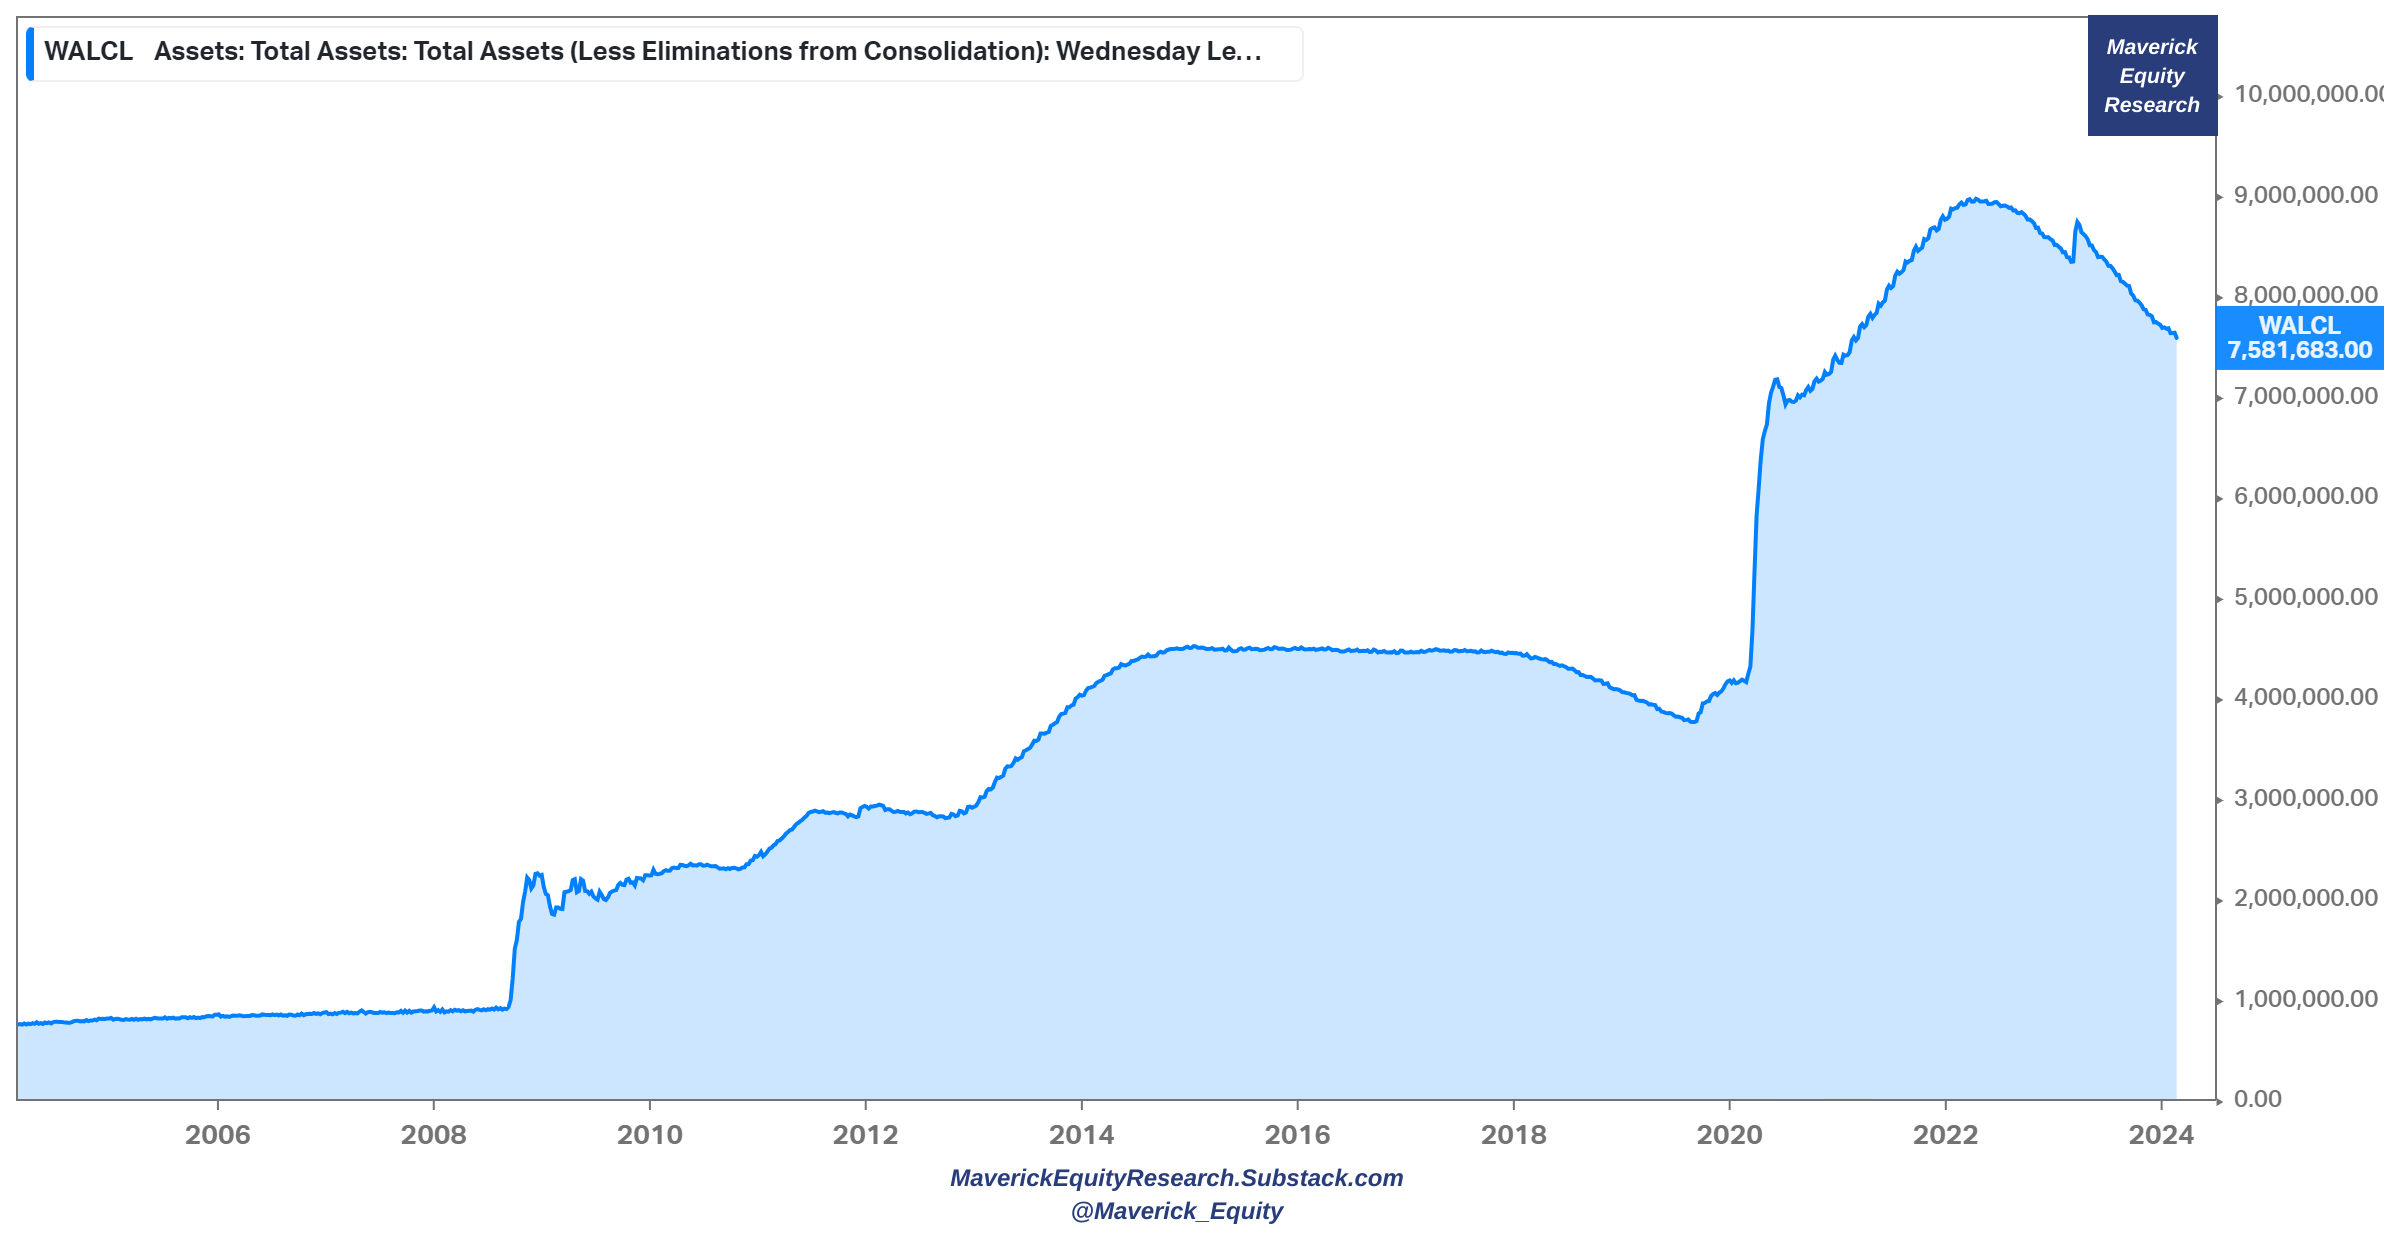
And now FED’s balance sheet: total assets, Quantitative Tightening (QT) is on:
👉 FED’s balance sheet is down $1.4 trillion from its peak in April 2022 which means it currently sits at its lowest level since March 2021
👉 How much further tightening is needed to cancel off the big Quantitative Easing (QE) pandemic stimulus from March 2020 to April 2022? About $3.5 trillion …
-
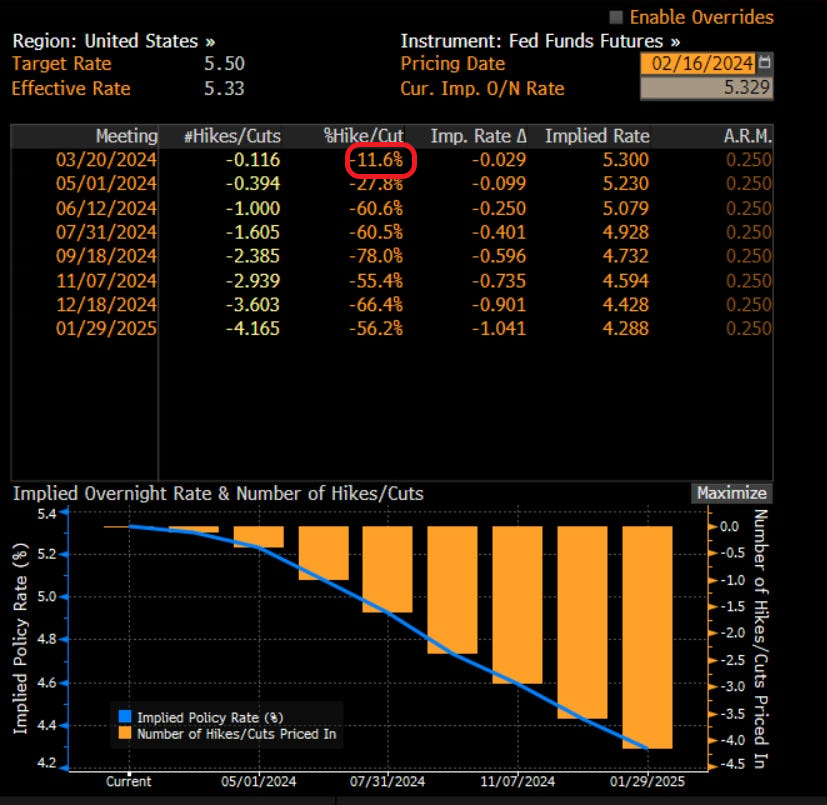
Interest rates pricing via FED funds futures (Source: Bloomberg):
👉we moved from a 81.5% probability 1st cut in March … to 11.6% for March … and now 1st likely cut in June at 60.6%
Switching from monetary policy, inflation and interest rates to … stocks:
-
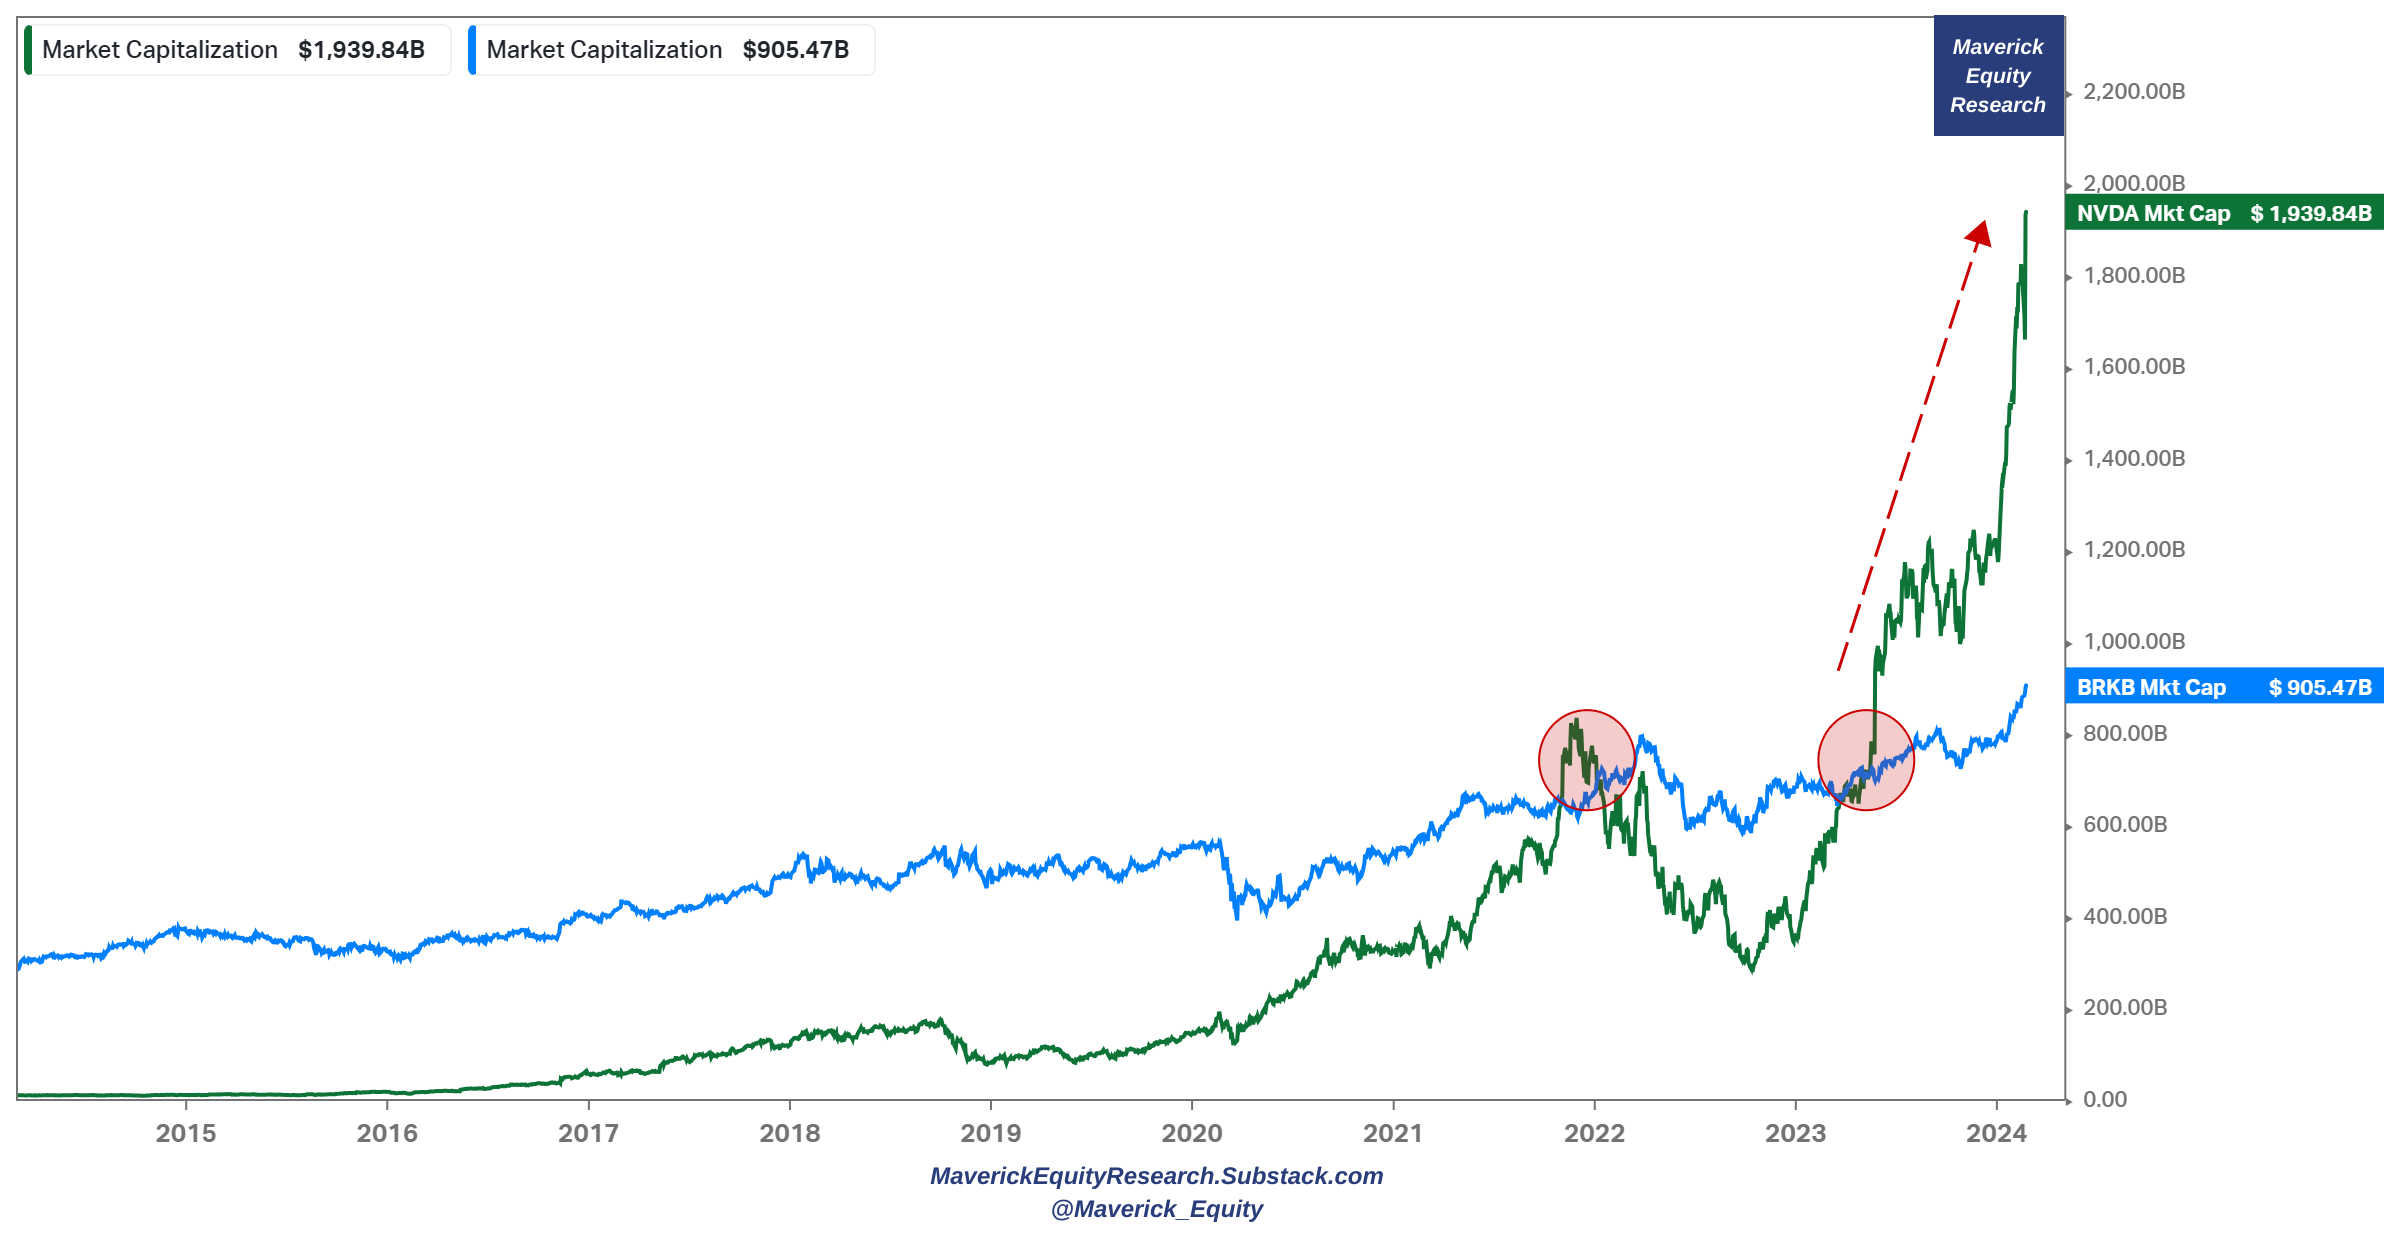
Nvidia going parabolic is nothing new, but check the extent via Nvidia (green) & Berkshire’s (blue) market capitalisation:
👉 NVDA $1,900 billions vs BRK $900 billion and it the 2nd time when Nvidia surpasses Berkshire after the 2021 episode … but this one is bonkers and the truly bonkers stats is this one:
👉 Just Nvidia’s $1.200 billion gain in the last twelve months is 130% more than the entire value of the Berkshire compounding machine that has been ever created for 6 decades by legendary investors Buffett & Munger … + note that Berkshire market value is at all-time highs now … let that sink in and bring the sink!
👉 Not an apples-apples comparison, but a question of market pricing & value creation … food for thought … what do you think?
-
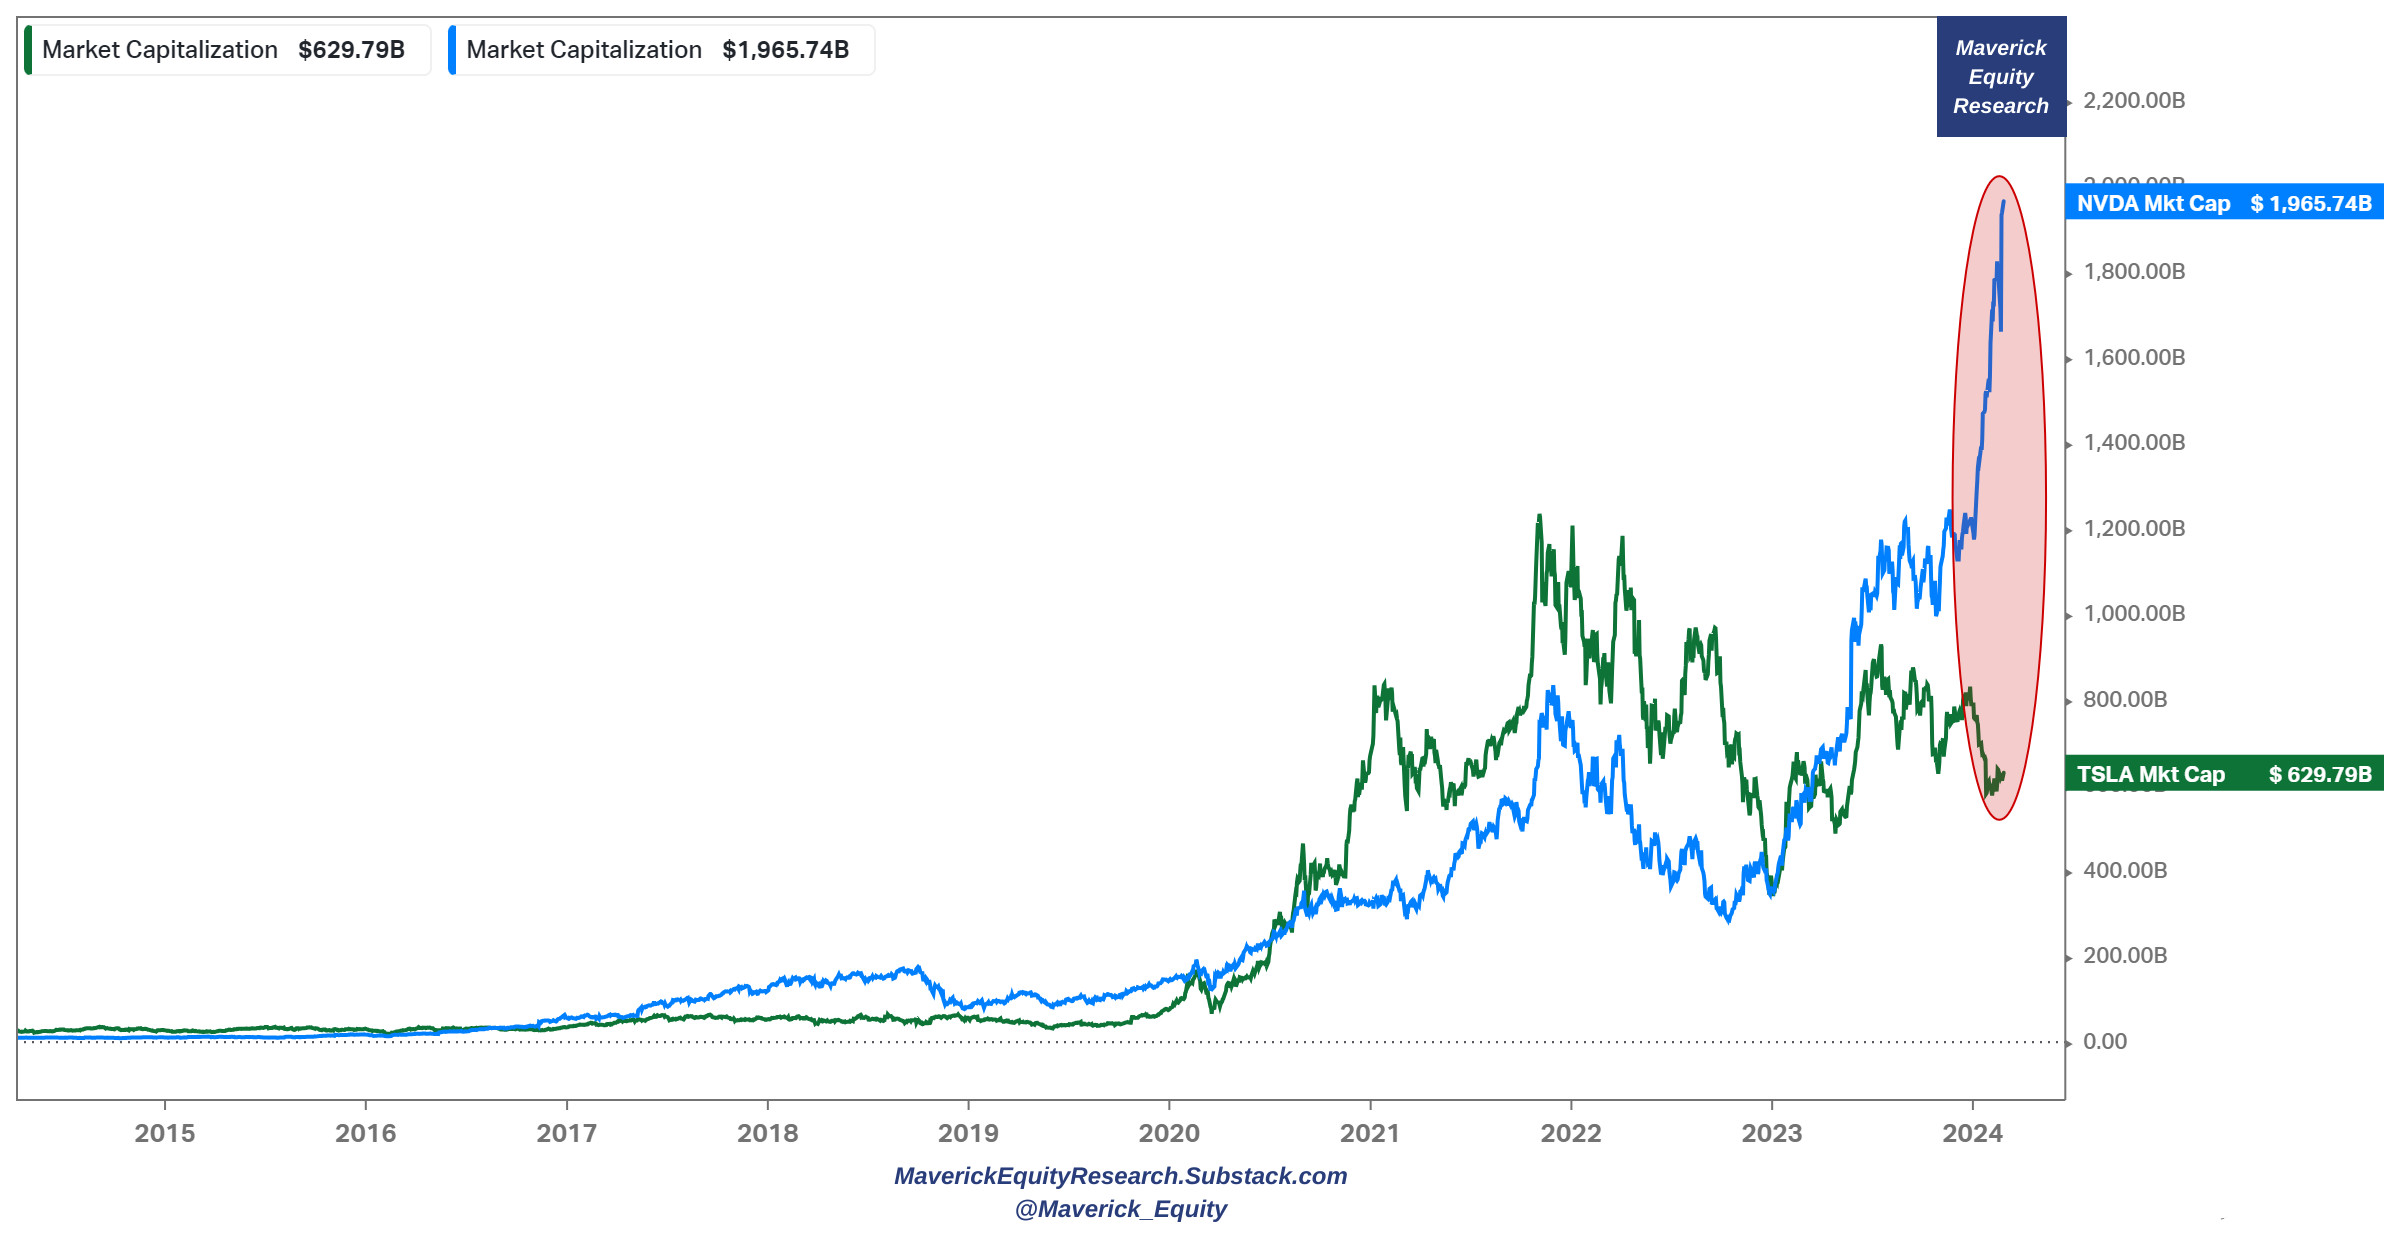
Nvidia (blue) vs Tesla (green) edition:
👉 Nvidia is 3x more valuable than Tesla currently with the bonkers stats being:
👉 Just Nvidia’s $1.200 billion gain in the last twelve months is more than 2x than the entire value ever created by Tesla
-
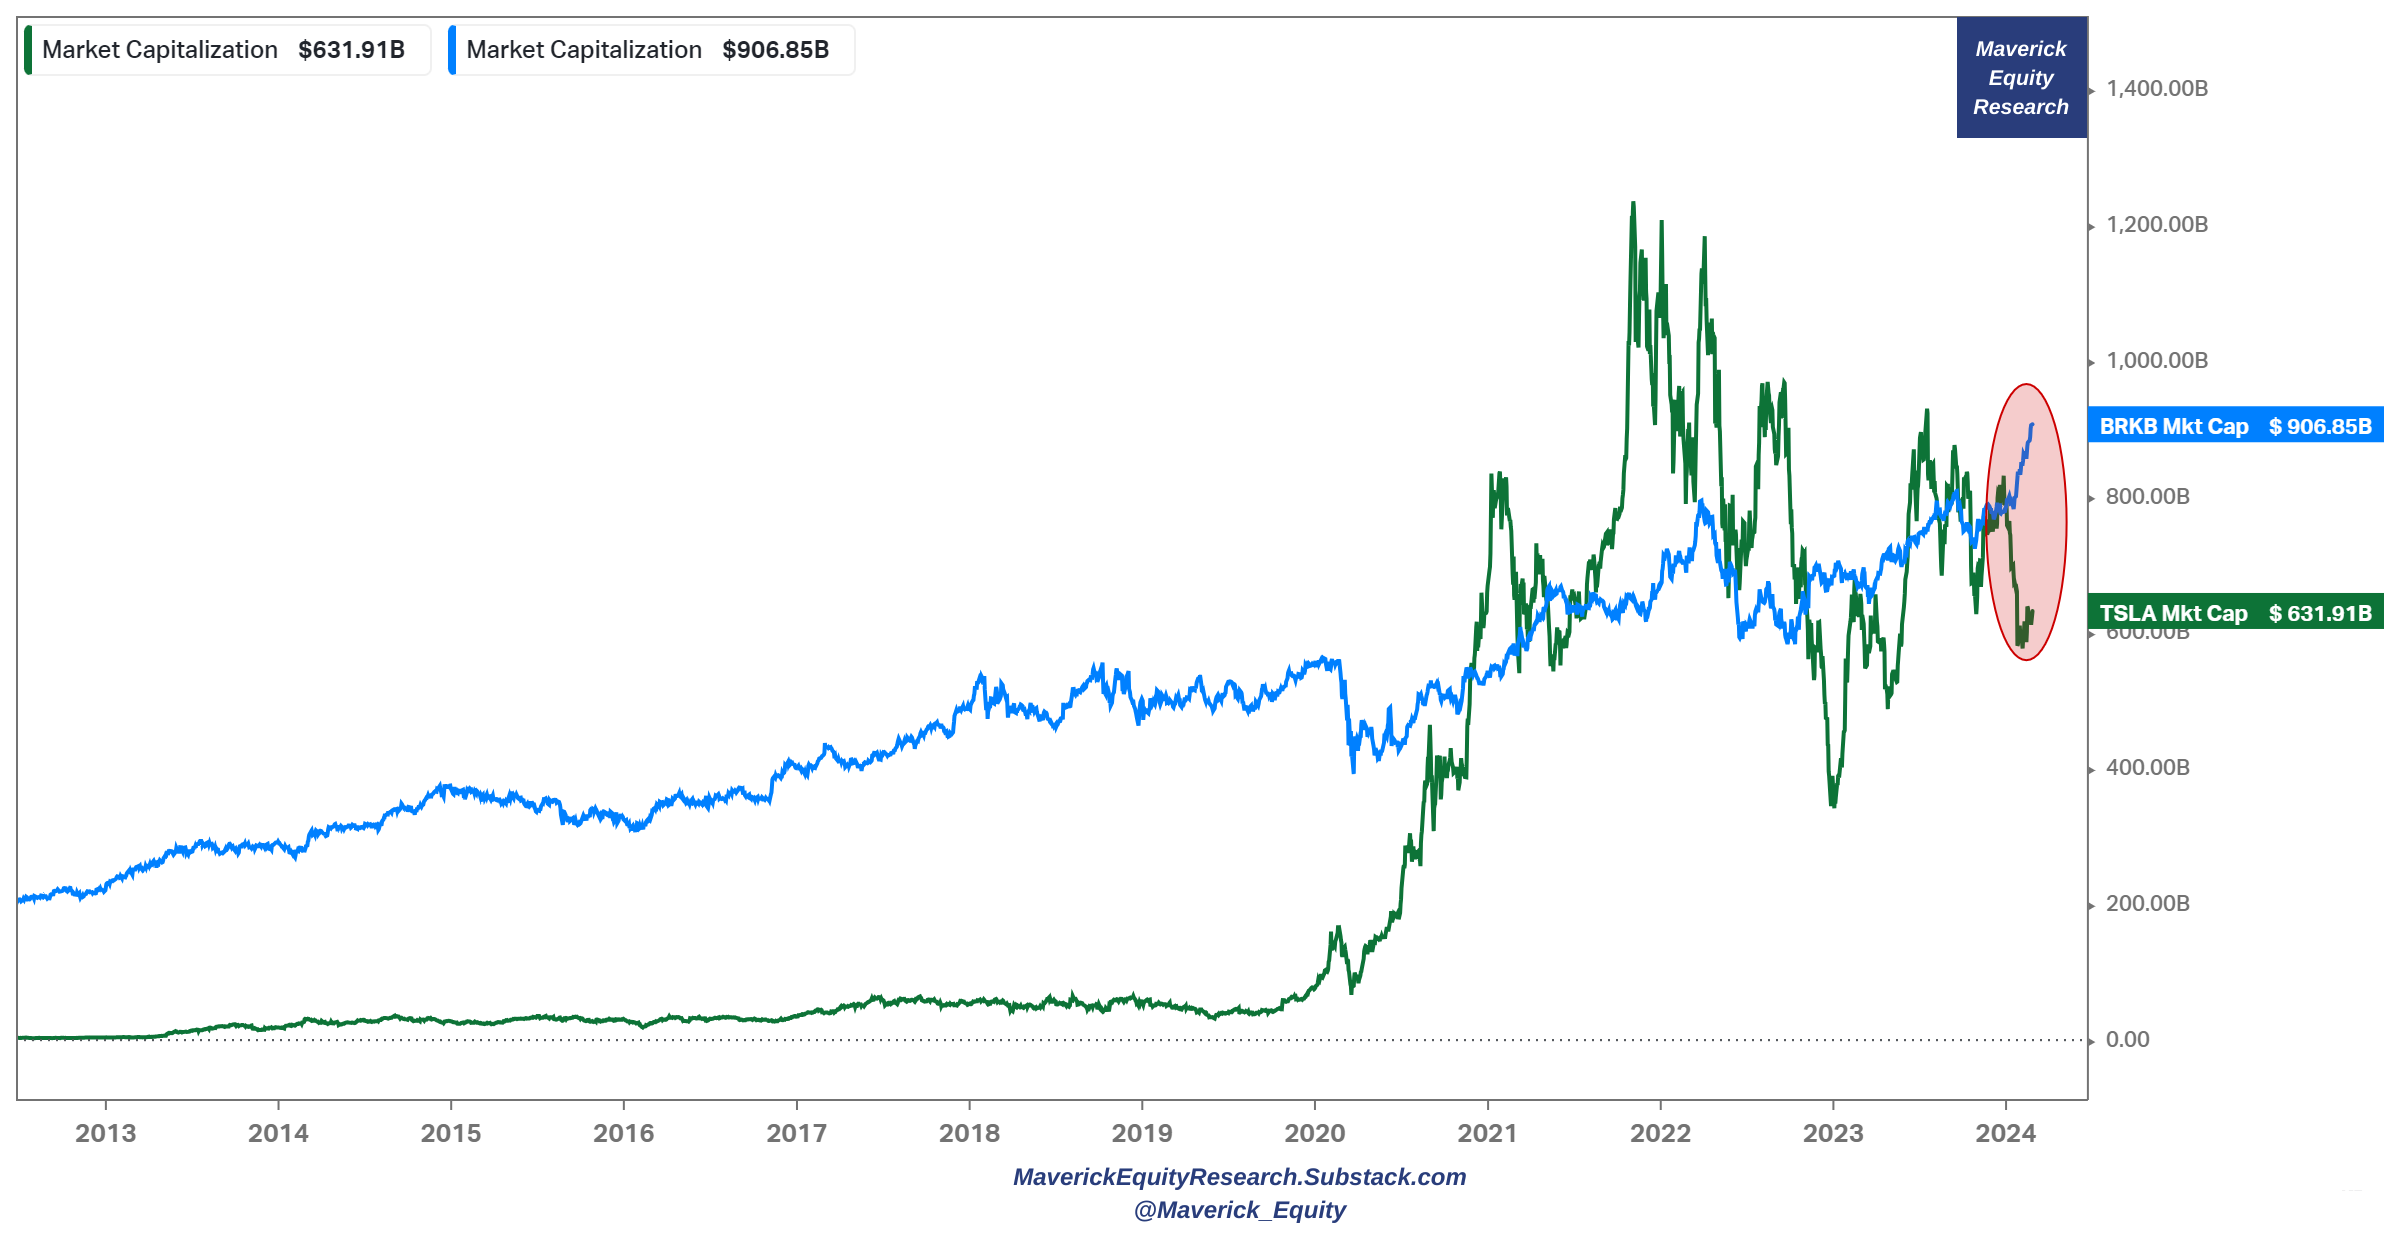
Tesla (green) vs Berkshire (blue) edition:
👉in 2021 Tesla was 2x the value of Berkshire which compounded like nobody else for 6 decades via legendary investors Buffett and Munger …
👉 Berkshire is back and 50% more valuable than Tesla … which is rather fair via my subjective eyes … I always said when Tesla was twice the value that something is off there …
-
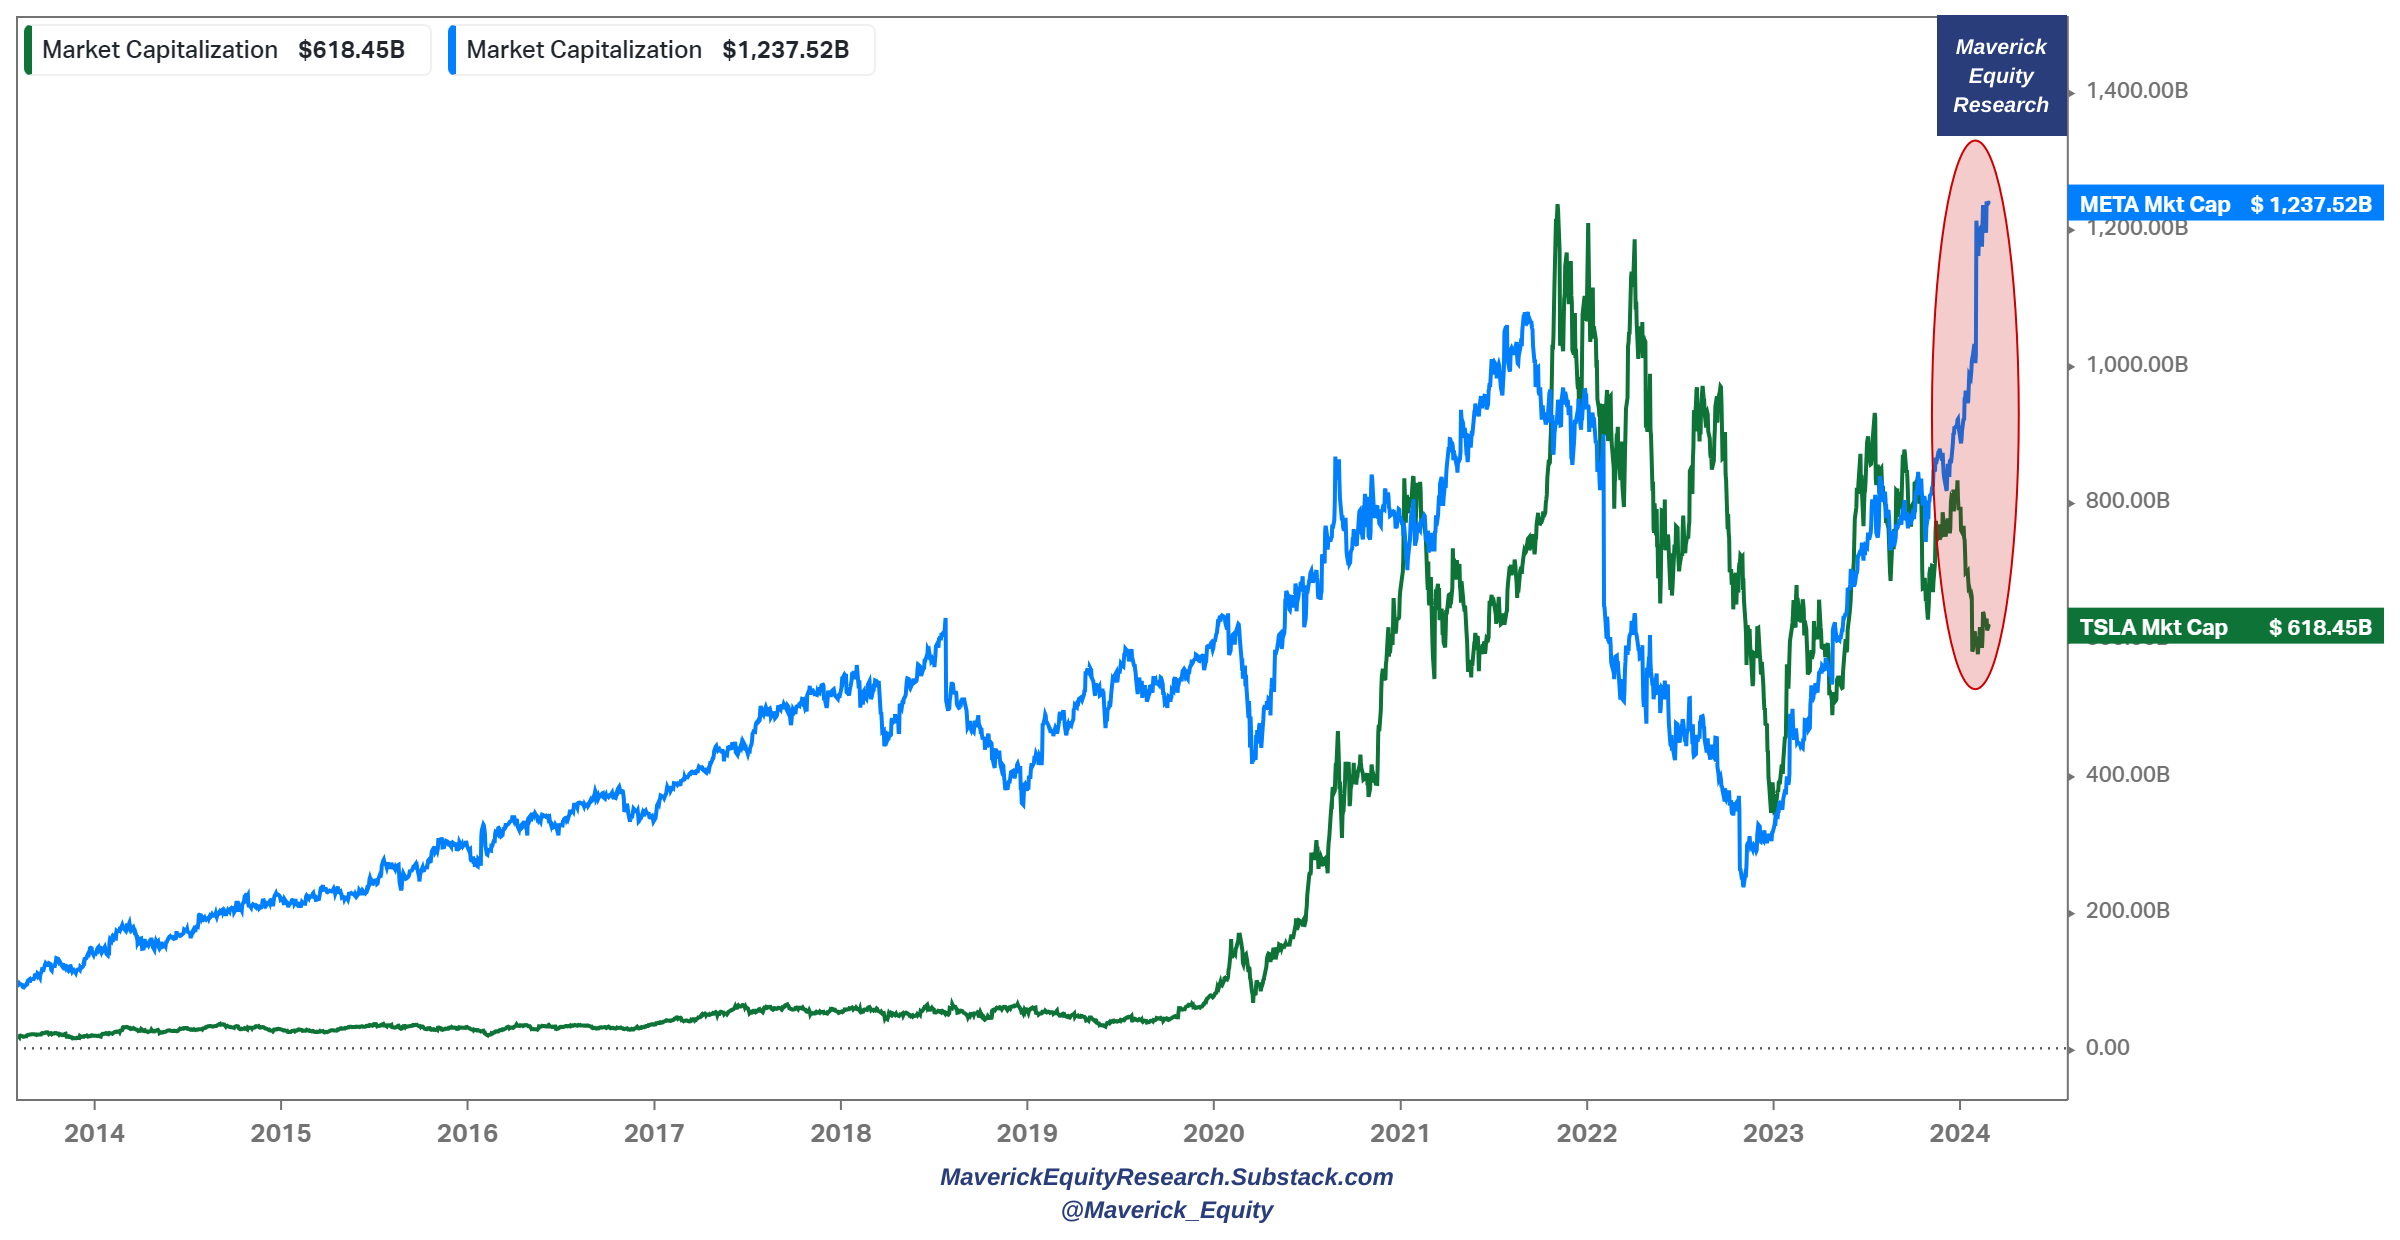
Meta (blue) & Tesla (green) market cap:
👉 Meta in the metaverse currently as twice the value of Tesla …
👉 after just a few months ago they were equal … and quite correlated since 2021
-
Nvidia and Valentine’s day in 2024:
👉 Nvidia got the flowers and just passed Amazon in terms of market value … after climbing 50% in 5 weeks
👉 last time Nvidia was above Amazon was in 2001

-
Nvidia 10 year total return … just following free cash flow per share and EPS (earnings per share, diluted)

-
Nvidia P/Es compressing faster than … Ozempic effects
👉 last twelve months (green) at a P/E of 65.8x … after a bonkers 240x
👉 next twelve months (blue) at a P/E of 32x … after being above 70x 2 times since 2021

-
Top 10 biggest single-day market cap gain via Bloomberg!
👉 Nvidia $247 billions taking the lead from Meta and Apple … and with almost an entire AMD market cap gain in one day (AMD market cap = 285bn)
Let that sink in & bring the sink ….

-
US market breadth is narrow (tech/Mag 7 leadership), though globally via global equities breadth it looks solid …

-
100-years chart on market concentration:
👉 top 10% of stocks by size versus the entire US stock market with median values as well … we are back at 1930s levels and above 2001 … & way above the median … but hey, note that the top 10% of those stocks bring loads of profits now unlike 2001

-
US market leadership/concentration via GMO:
“Since 1957, the 10 largest stocks in the S&P 500 have underperformed an equal-weighted index of the remaining 490 stocks by 2.4% per year. But the last decade has been a very notable departure from that trend, with the largest 10 outperforming by a massive 4.9% per year on average.”

-
Note also why the top 5 stocks continue to drive the S&P 500 performance:
👉 for a good reason? Yes, a very right reason: earnings …

-
Stocks Valuation, S&P 500, S&P 493 and the Magnificent 7 via forward P/E:
👉 S&P 500 at 19x, S&P 493 at 17x and the Magnificent 7 at … 27x … and recall it used to be also 37 in 2020-2022
P.S. after the Q4 earnings season is done, I will release my 2 S&P 500 reports covering performance & valuation – previous editions can be read in the S&P 500 report section
✍️ The S&P 500 Report: Performance, Profitability & Special Metrics – Edition 5
✍️ Maverick Valuations: The Mighty S&P 500 – Edition 3

-
Everybody focused on the Mag 7 while my European GRANOLAS are unnoticed:
👉 GRANOLAS keeping up the pace with the US Mag 7 and via way lower volatility
👉 not many heard given not much covered, but they are Europe’s large-cap/blue chips Compounders: GlaxoSmithKline, Roche, ASML, Nestle, Novartis, Novo Nordisk, L’Oreal, Louis Vuitton, AstraZeneca, SAP & Sanofi
N.B. I wrote about the GRANOLAS in March 2023, you can check it out:
✍️ Maverick Valuations #1 – Europe: 50 stocks + GRANOLAS

-
I like REITs going forward given good downside/upside profile:
👉 punished quite some given the natural interest rate sensitivity … and historically after FED tightening cycles REITs outperform
👉 as always, need to be careful and choose wisely … I will cover a REIT I like in detail in the Full Equity Research section … stay tuned!


-
US GDP Q1 2024:
👉 GDPNow estimate for real GDP growth for Q1 2024 = +2.9% which eased lately = got revised lower (Atlanta FED)
👉 Blue Chip consensus +1.8%, Bloomberg consensus = +1.1% that got revised higher
👉 my take: how about they meet in the middle for a kiss at 2%?
P.S. ✍️ The State of the US Economy in 45 Charts, Edition #3 coming in March … previous 2 editions can be read here in the Macro section

👍 Bonus charts
-
Geopolitics Chart of the Week!
👉 Breaking Down the $1.3T in NATO 2023 Defense Spending (USD, Millions):
United States $860,000, Germany $68,080, UK $65,763, France $56,649, Italy $31,585, Poland $29,105, Canada $28,950, Spain $19,179, Netherlands $16,741, Türkiye $15,842

-
Charted: How Much Do Countries Trust the United Nations?

-
US M&A activity via FactSet: ‘U.S. M&A deal activity increased in January, going up 16.1% with 1,209 announcements compared to 1,041 in December. Aggregate M&A spending increased as well. In January, 10.8% more was spent on deals compared to December.’
👉 my take: normally when we have high interest rates, M&A activity is quite down (how do we finance the deal bro’?) … but nowadays it’s picking up … signs of confidence coming also from the M&A side …

-
Where’s my chocolate?
👉 cocoa prices surged past their previous all-time high, in place for 46 years …

-
European gas price: after the crazy parabolic run, back to basics …

Research is NOT behind a paywall and NO pesky ads here unlike most other places!
Did you enjoy this extensive research by finding it interesting, saving you time & getting valuable insights? What would be appreciated? Sharing it around with like-minded people and hitting the ❤️ button. This will help me bringing in more & more independent investment research: from a single individual, not a fund, bank or so … !
Have a great week!
Mav 👋 🤝
