✍️ Maverick Charts – Stocks & Bonds – August 2023 Edition #10
Dear all,
your monthly Top 15 Stocks & Bonds charts from around the world + 5 Bonus!
-
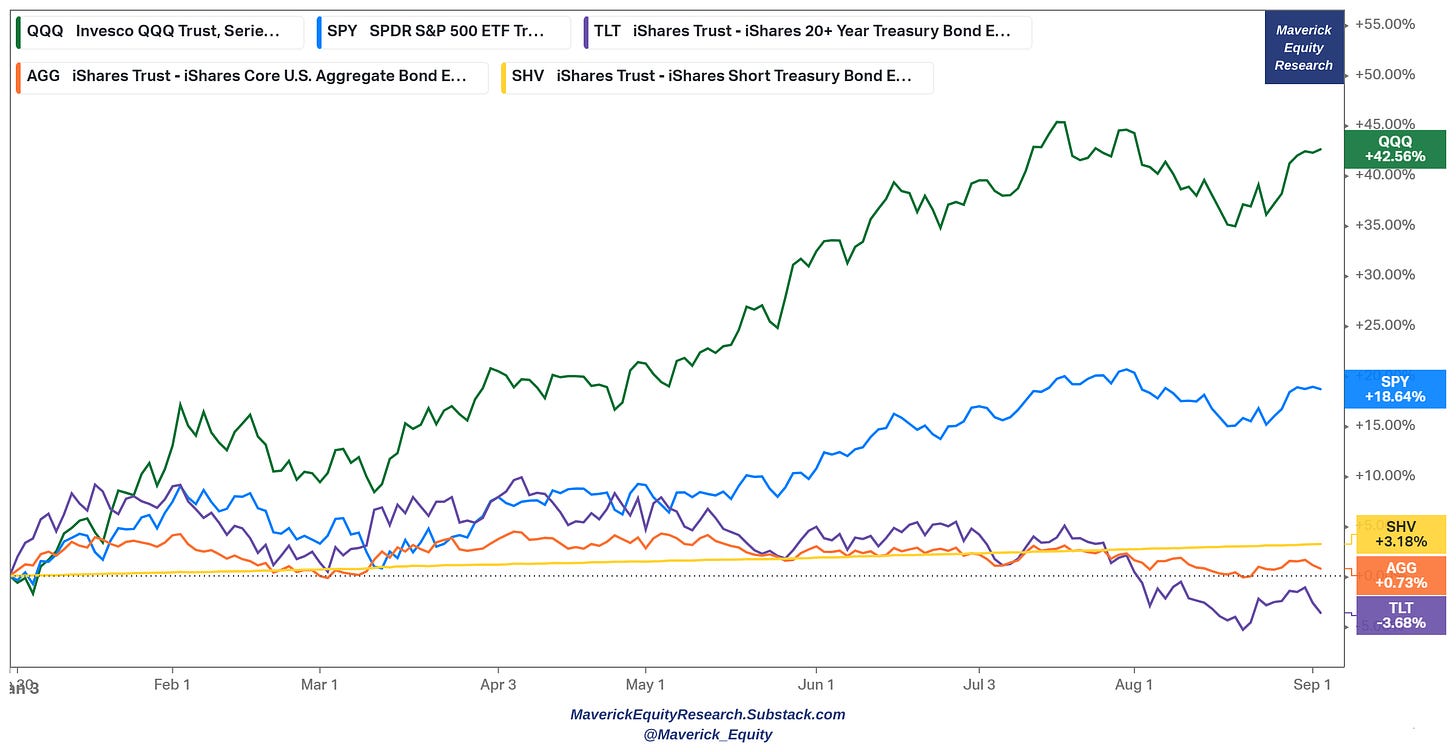
US Stocks & Bonds 2023 performance:
👉 Nasdaq 100 (QQQ) with a new bull market, +42.5% in 2023 alone
👉 S&P 500 (SPY) with a new bull market, +18.6% in 2023 alone
👉 TLT (long term government bonds 20-year+ maturities) -3.6%
👉 SHV (short-term government bonds 1-year or less, cash proxy) +3.1%
👉 AGG (investment grade: treasuries, corporate, MBS, ABS, munis) +0.7%
-
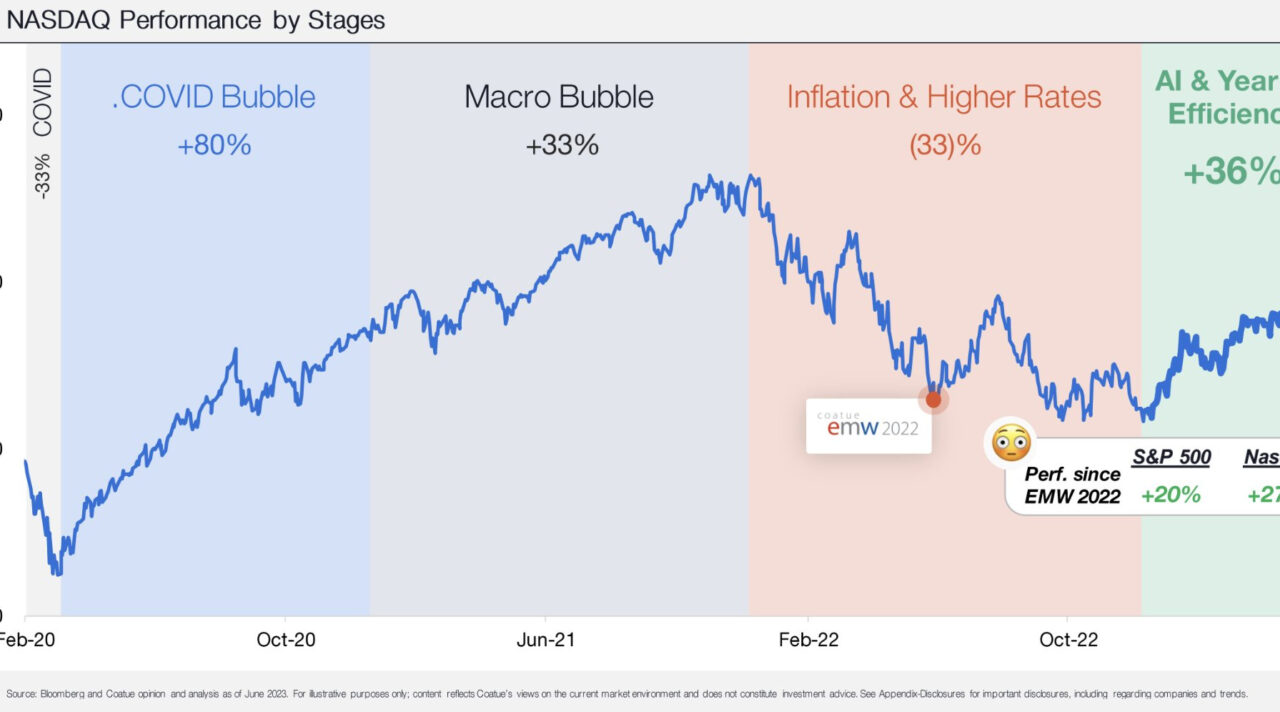
NASDAQ timeline story via returns by stages since 2020
👉 Covid Bubble +80%
👉 Macro Bubble +33%
👉 Inflation & Higher Rates -33%
👉 AI & 2023 Year of Efficiency: +36% as of June, +42 as of September, 2023 run is the best YTD run rate in its history
-
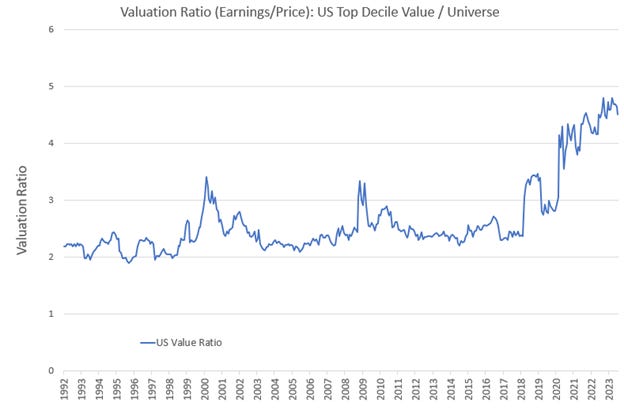
Where are good U.S. investing opportunities to be found in the next years be it we have an overvalued overall stock market or not?
👉 Meet the value trade: the spread between value stocks and the rest of the stock market universe is at historically wide levels
👉 The Full Equity Research section from Maverick Equity Research is where I will cover bargain hunting and margin of safety in the Value investing space. How? Via fundamental analysis, namely comprehensive data driven research …
-
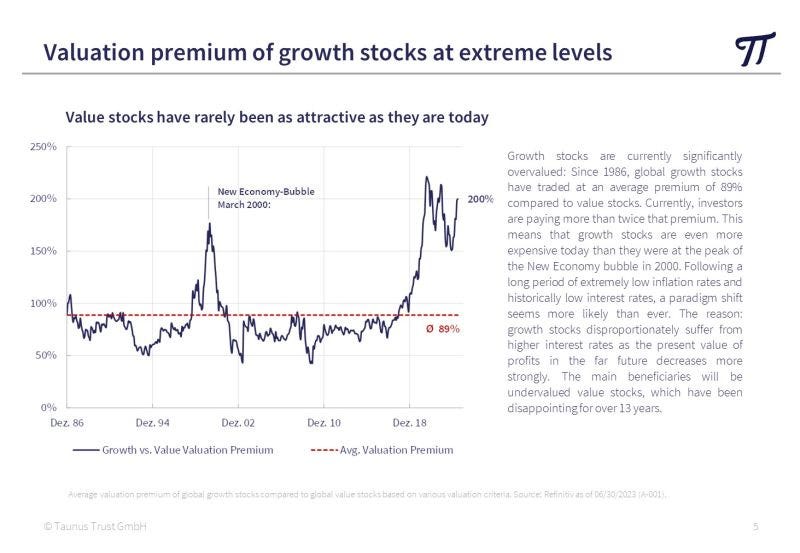
Value for/vs Growth, complementary view:
👉 average premium of growth stocks to value is 89% since 1986
👉 nowadays, investors keep paying a premium that is more than 2x the already average premium & more than 3x on a growth/value 1:1 basis … let that sink in!
👉 growth stocks are even more expensive today than they were at the peak of the New Economy bubble in 2000
-
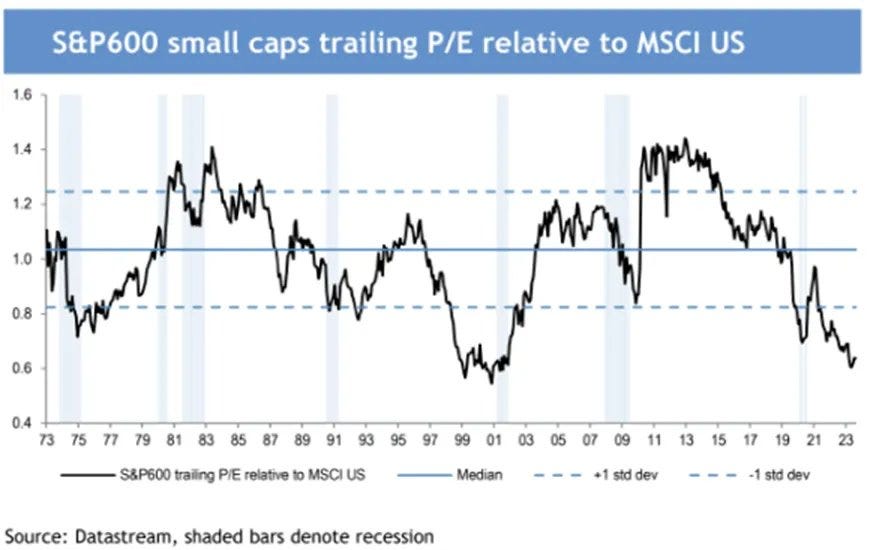
Value the place for opportunities, anything even more to add? Yes, small caps!
👉 the last time small-cap stocks were this cheap on a relative basis was coming out of the 2000s tech bubble
👉 that led to a years-long run of outperformance
-
As this newsletter sub-section covers ‘Stocks & Bonds’, one very frequent question I get is: ‘how do stocks and bonds perform throughout the business cycle?’ There you go:
👉 early & mid expansions is where stocks shine
👉 late expansions is where both do still pretty good and pretty close
👉 treasuries do their best during recessions while stocks the least
-
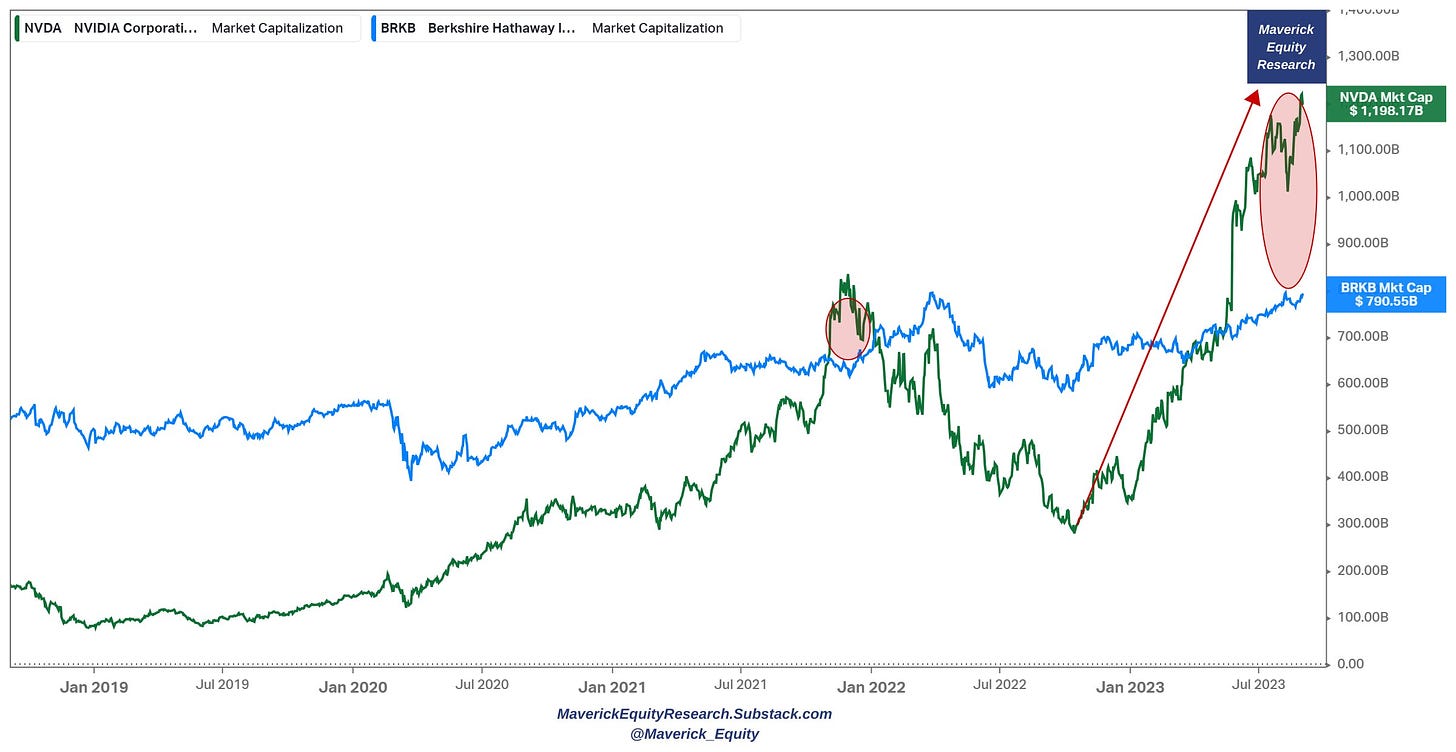
Nvidia (NVDA) and Berkshire (BRK) market capitalisation
👉 NVDA $1,200 billion vs $BRK $790 billion and the truly bonkers stats is this one:
👉 $920 billion market gain since just October 2022 equates to 116% of the entire Berkshire value that has been ever created for 6 decades by legendary investors
Only 10-11 months for a new & surpassed Berkshire empire? Not an apples-apples comparison, but a question of market pricing & value creation … food for thought …
-
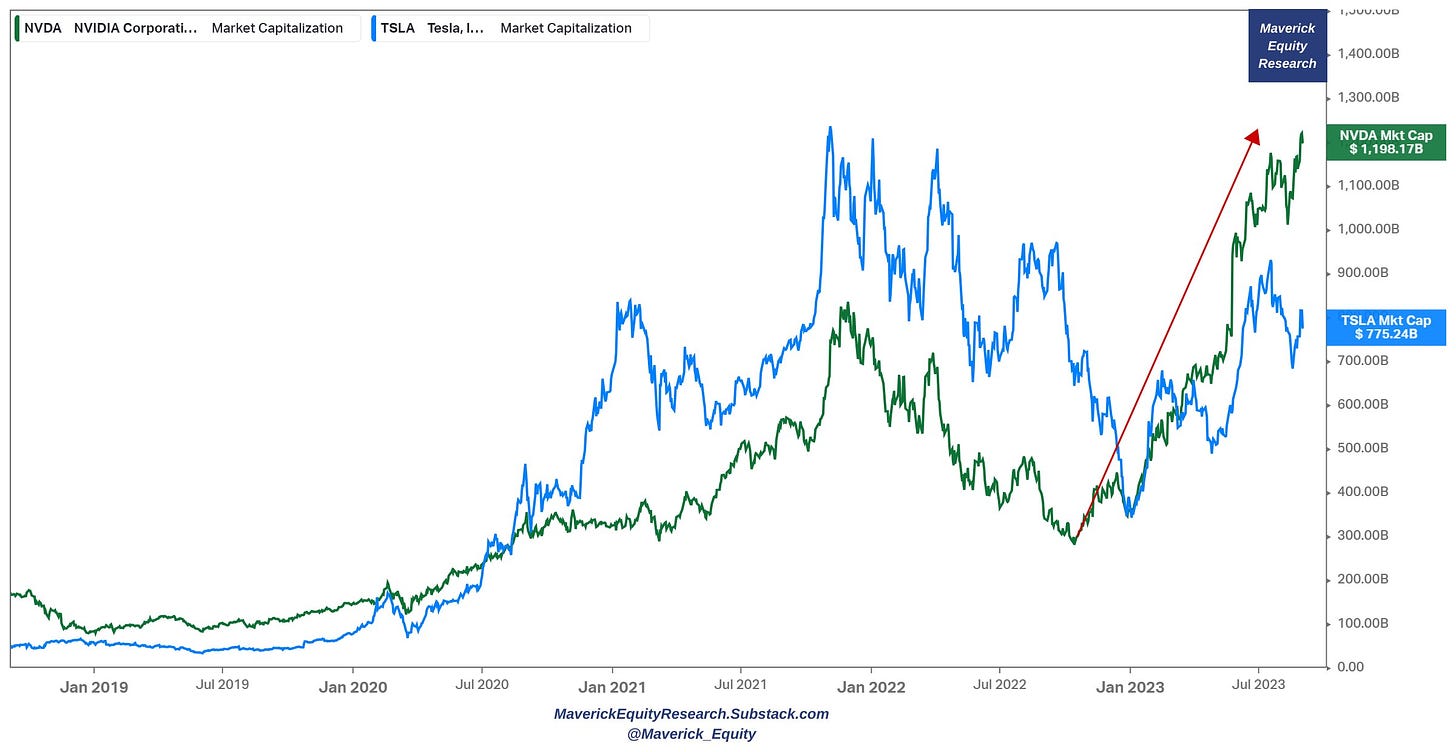
Nvidia (NVDA) and Tesla (TSLA) market capitalisation
👉 $NVDA $1,200 billion vs $TSLA $775 billion and the truly bonkers stats is this:
👉 $920 billion market gain since just October 2022 equates to 119% of the entire Tesla value that has been ever created…
Only 10-11 months & can make a new entire Tesla & surpass it? Not an apples-apples comparison, but a question of market pricing & value creation … food for thought …
-
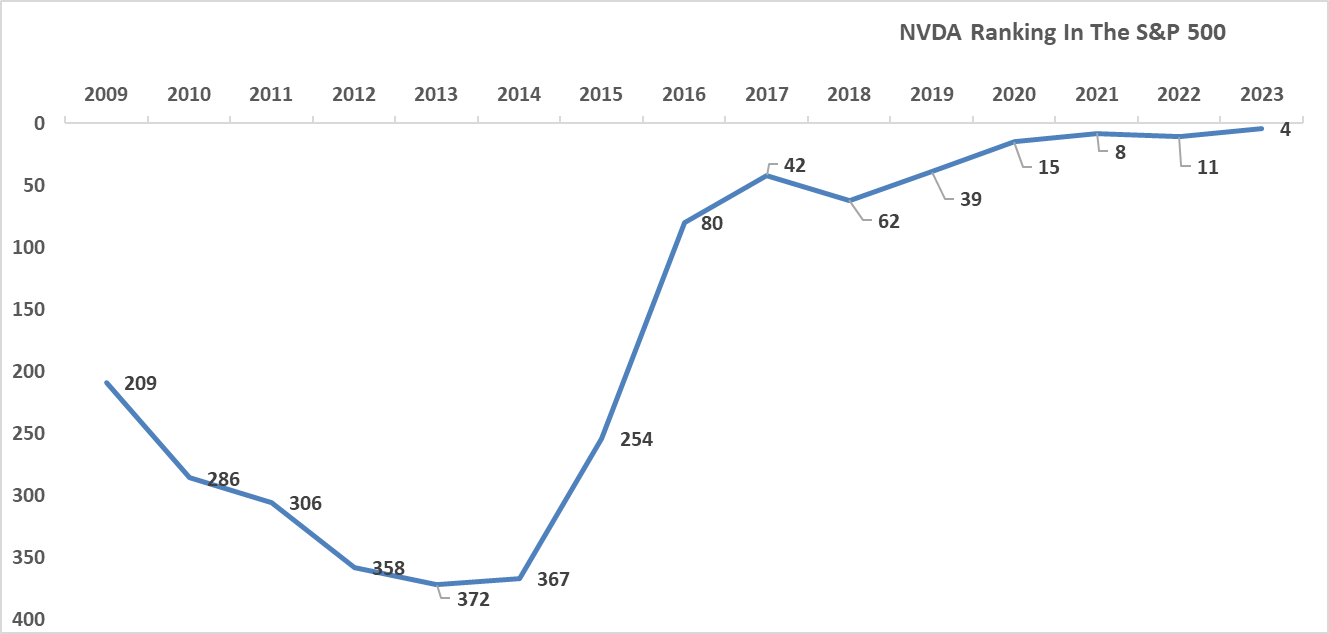
Nvidia (NVDA) weight in the S&P 500: in 2023 #4, in 2009? Give it a guess: 209th!
-
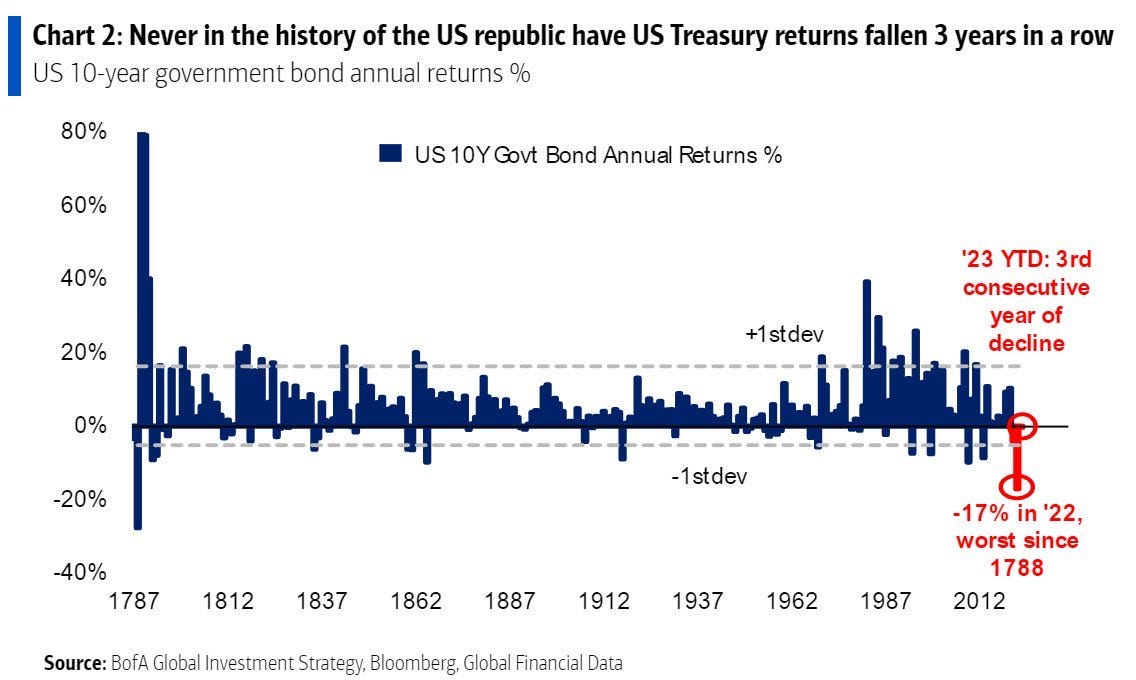
US 10-year government bonds: never in the history of the US republic have US treasury returns fallen 3 years in a row!
👉 2023 is the third consecutive negative year – my view is that it will end positive
👉 if 2023 by chance is negative also, likelihood of 4 years in a row? very close to 0!
-
BofA institutional investors survey on bonds
👉 they are overweight in bonds for the first time since the Global Financial Crisis which climaxed in 2009, at which point fixed income was outperforming …
👉 now, they are following the logic of mean reversion and loading up with bonds after 18 months of historically terrible performance
-
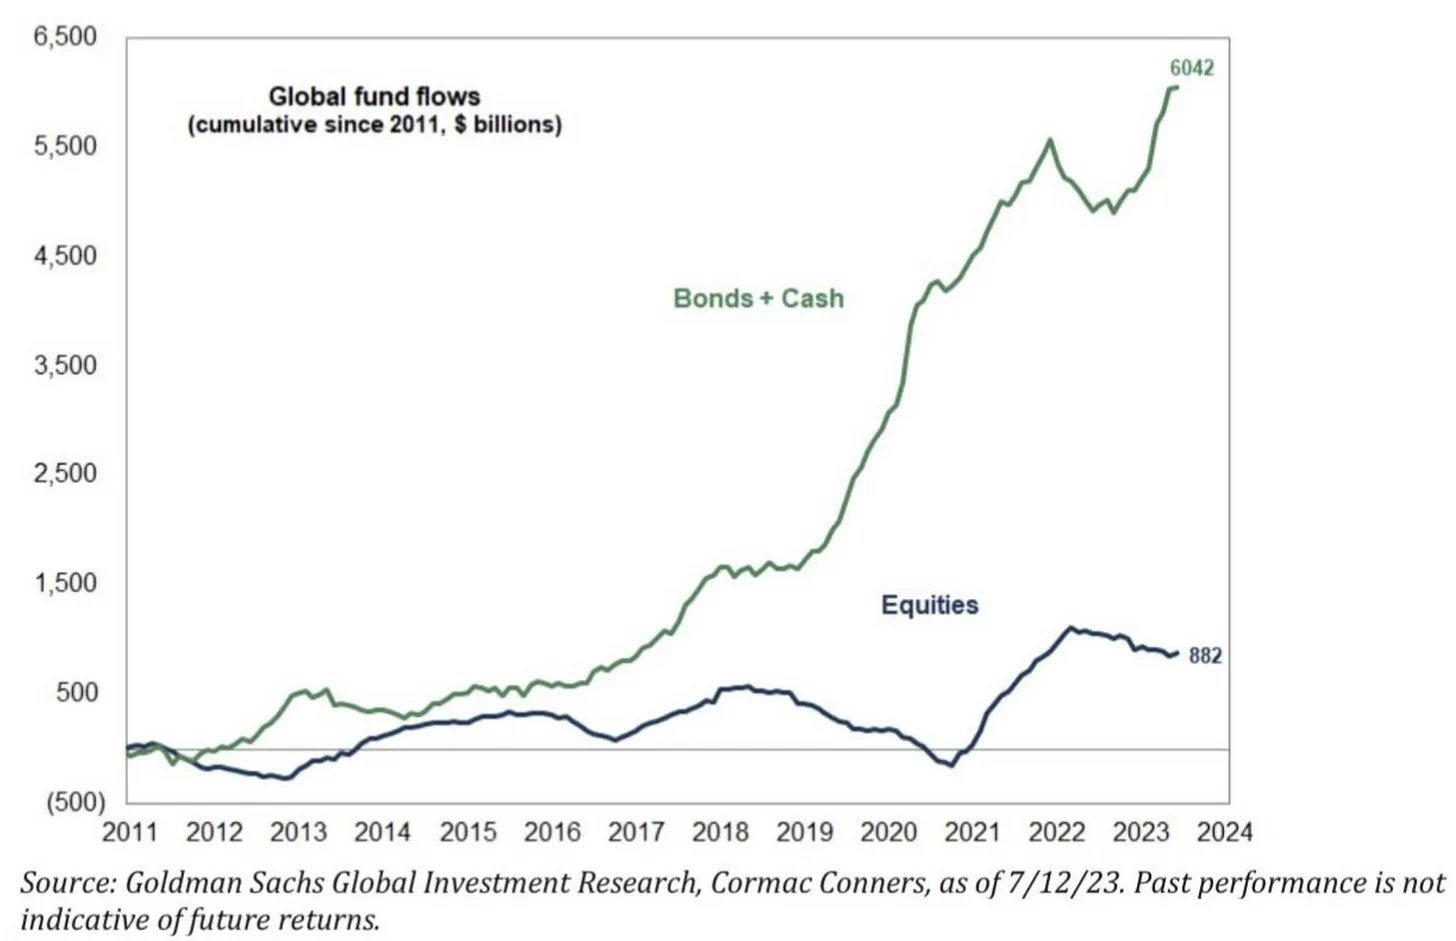
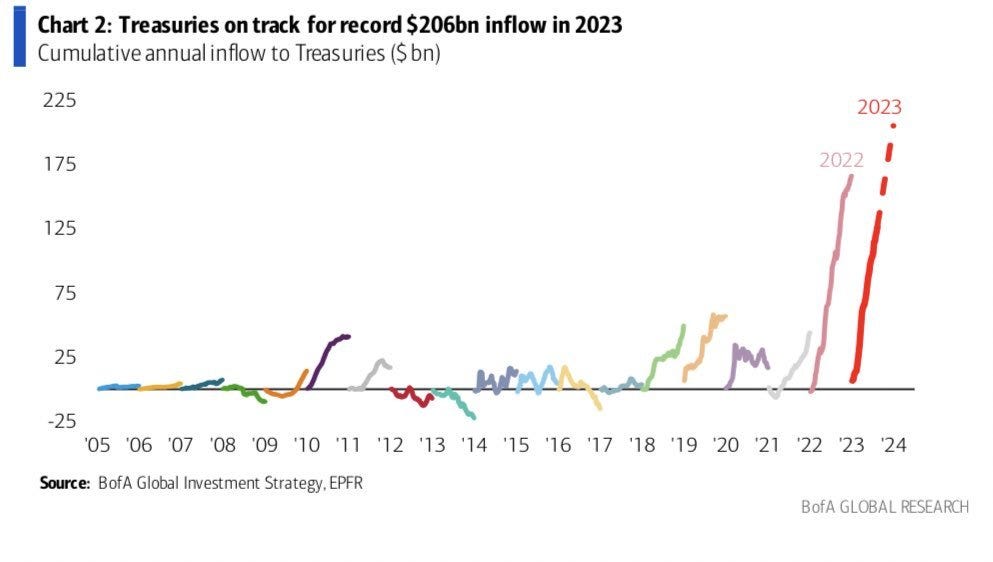
Flows Baby Flows: bonds & cash keep attracting loads of capital given high rates
👉 once the FED eases, that = dry powder for equities given that bonds/MM funds will pay less and less …
👉 while for now bonds good risk/return? right? …
-
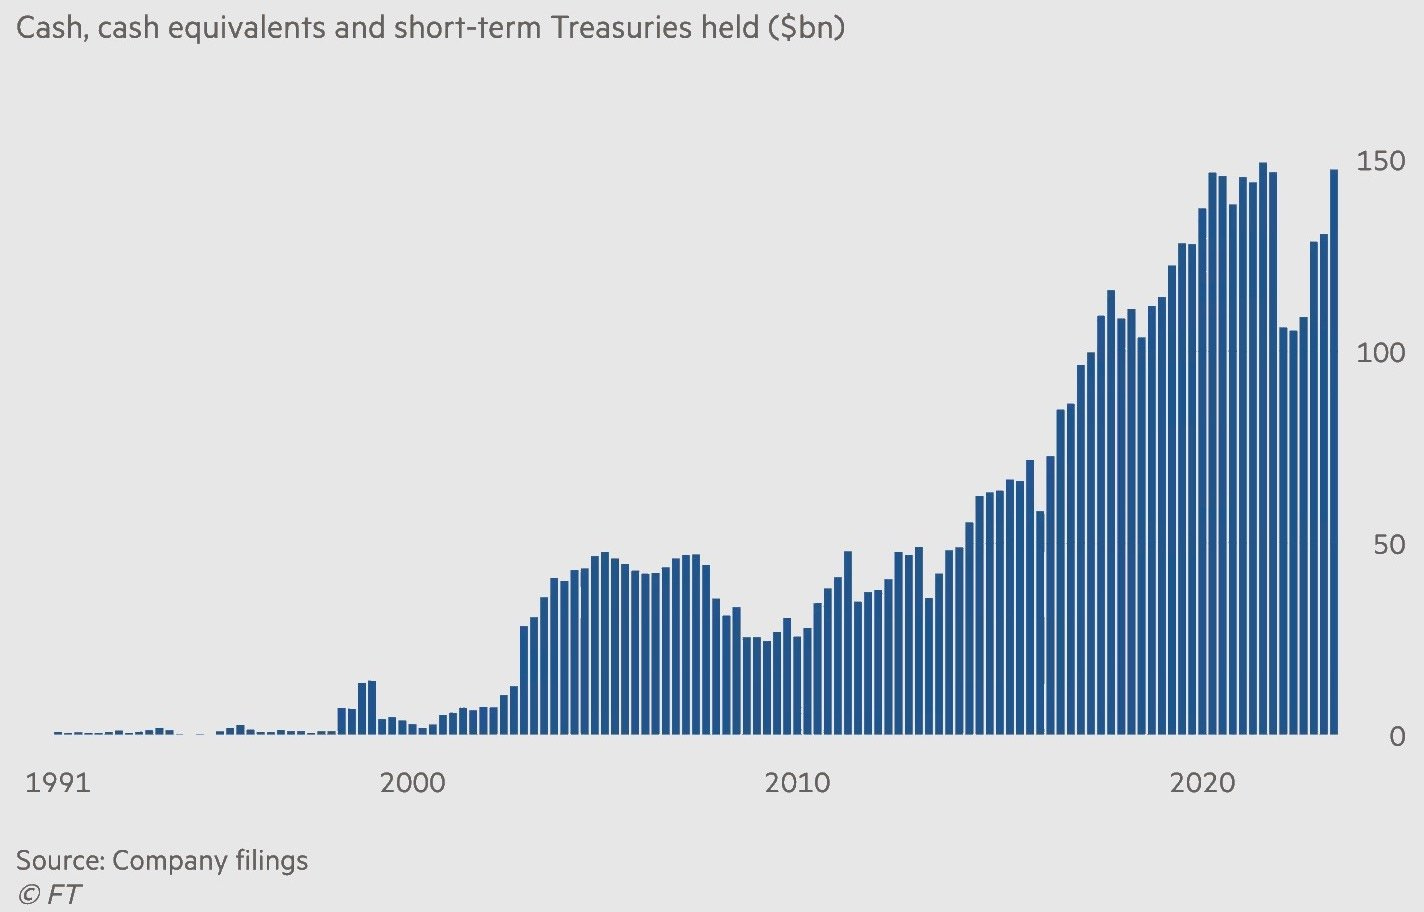
Buffett / Berkshire also cash piling – not really new, but note as close to ATH
👉 recently said they are buying as many short term 3/6-month Treasuries as possible each Monday …
👉 also said some quarters ago that he would have bought more Apple, but price went too high too fast … he does not mind the price recent price drop I am quite sure …
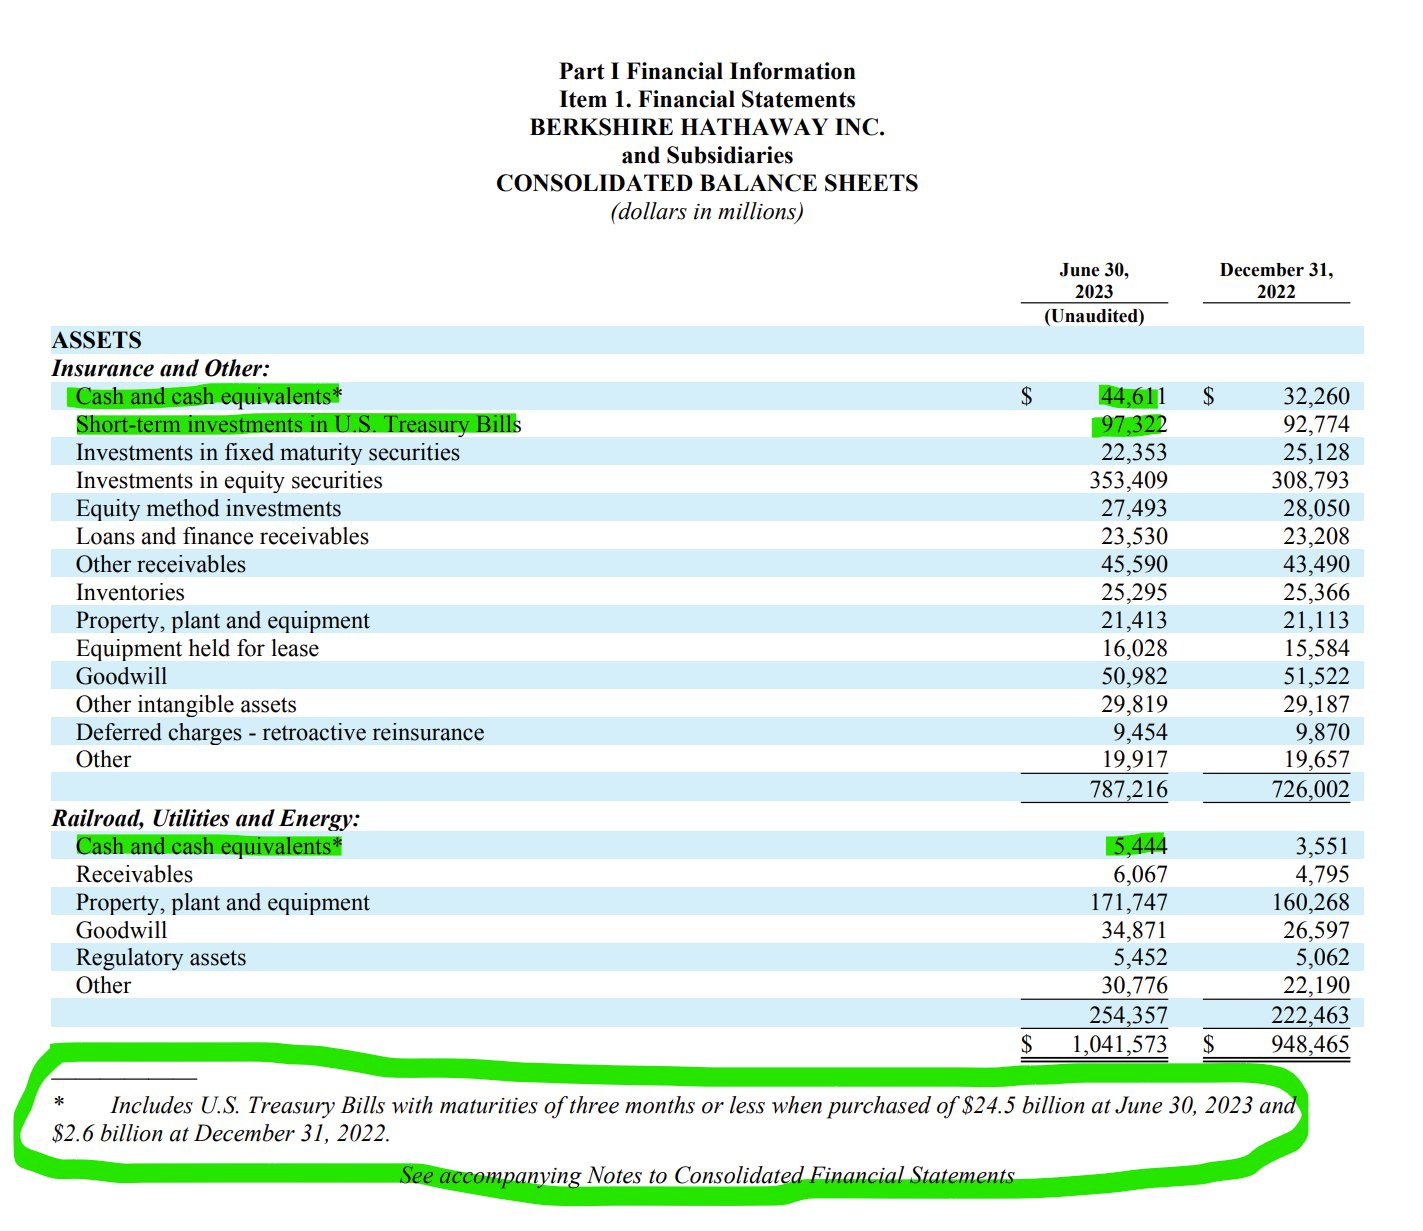
Q2 2023 cash pile:
👉 Q2 cash pile increased to $147.38 billion close to the record and
👉 materially higher than the $130.62 billion from Q1
87% (127/147 billion) of the total $147 billion cash pile = TREASURIES
-
Flows into Treasuries
-
reached $127 billion this year and are
-
set for an annualized record of $206 billion
-
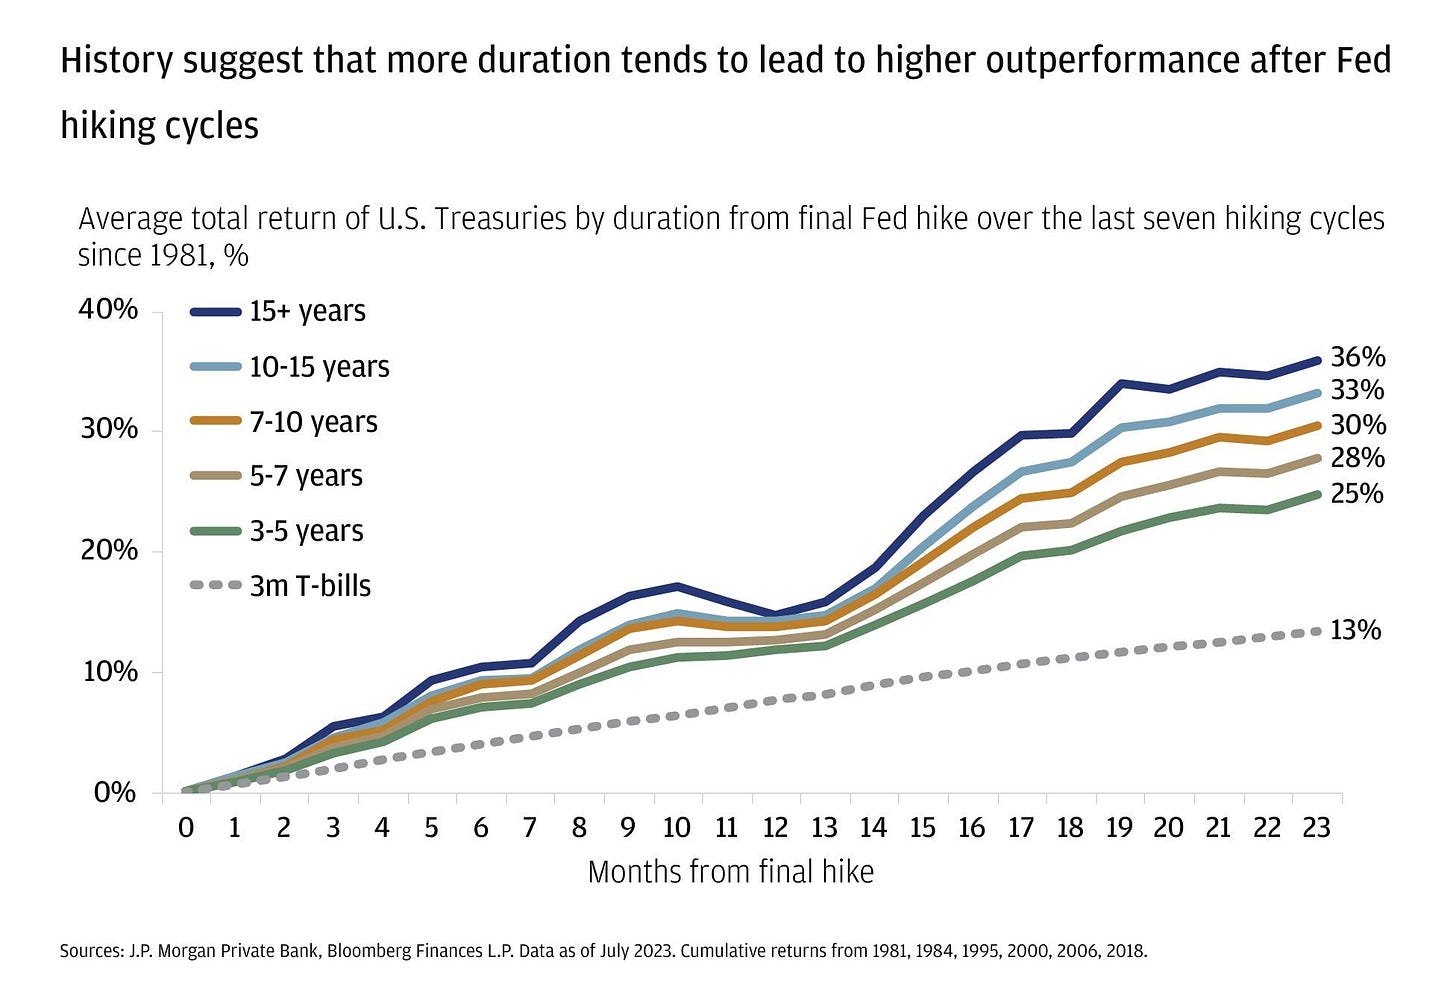
And now a key question: ‘how do treasuries perform after he final FED hike?’
👉 longer term treasuries (aka long duration) leads to higher outperformance after the FED’s final interest rate hike … not bad, not bad at all, right?
5 Bonus charts:
-
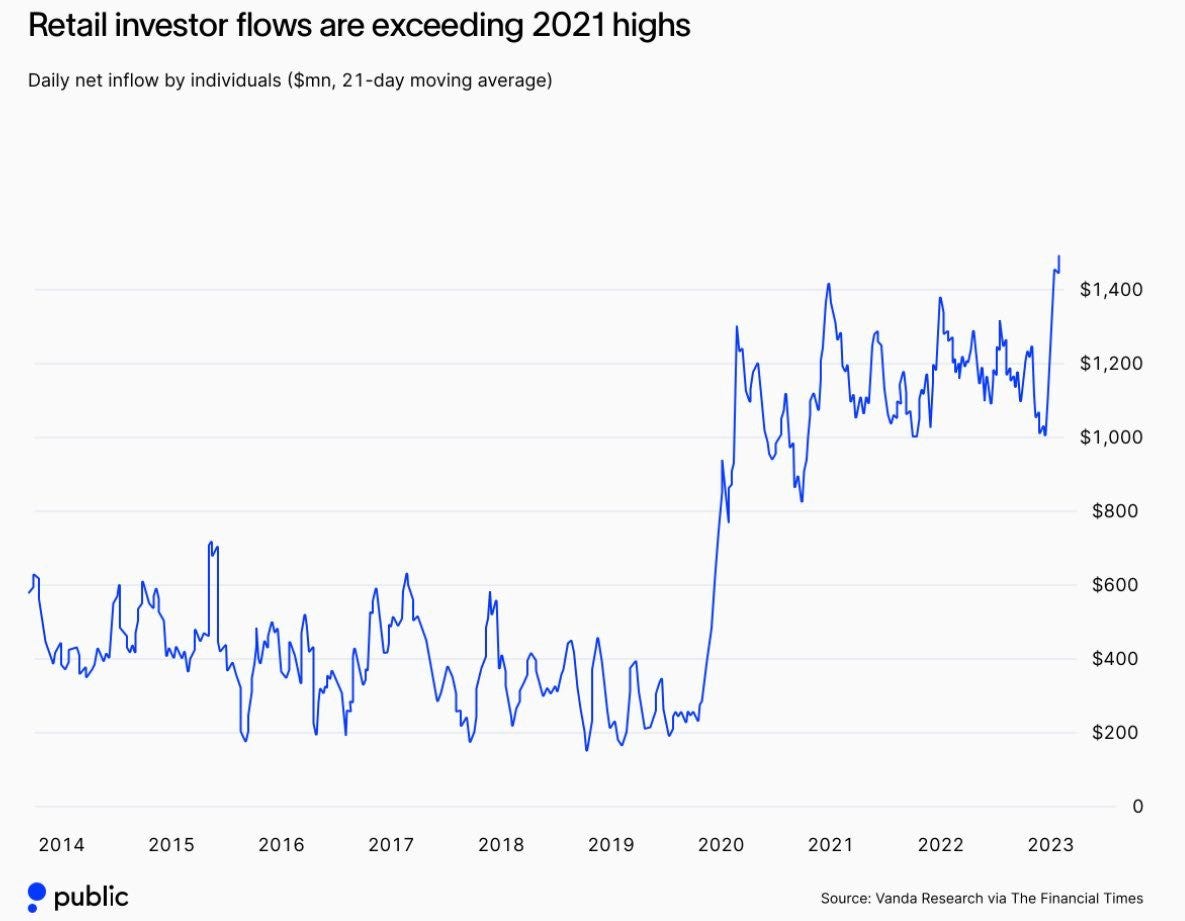
Retail investors with an even bigger buying appetite than the 2021 highs
-
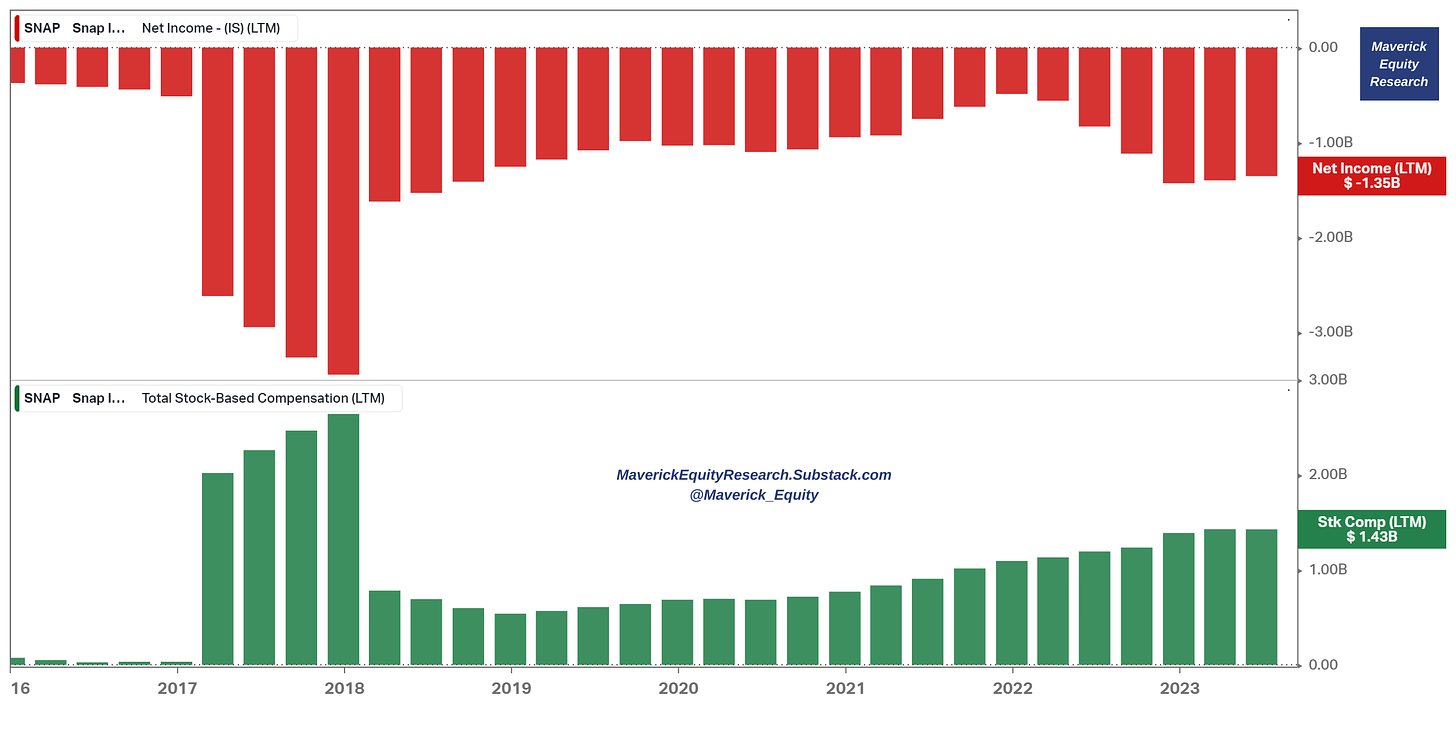
Social media company SNAP managed 2 incredible things since going public
-
skyrocketed the amount of ‘sexting’ and genitals sharing that people do🙃
-
stock -57%, never a profit with a cumulative $9.2bn loss, but insiders got a money printing machine for themselves via issuing stock (SBC) for a cumulative $7.8bn
Net Income (red) and Stock Based Compensation (green) mirroring each other…
-
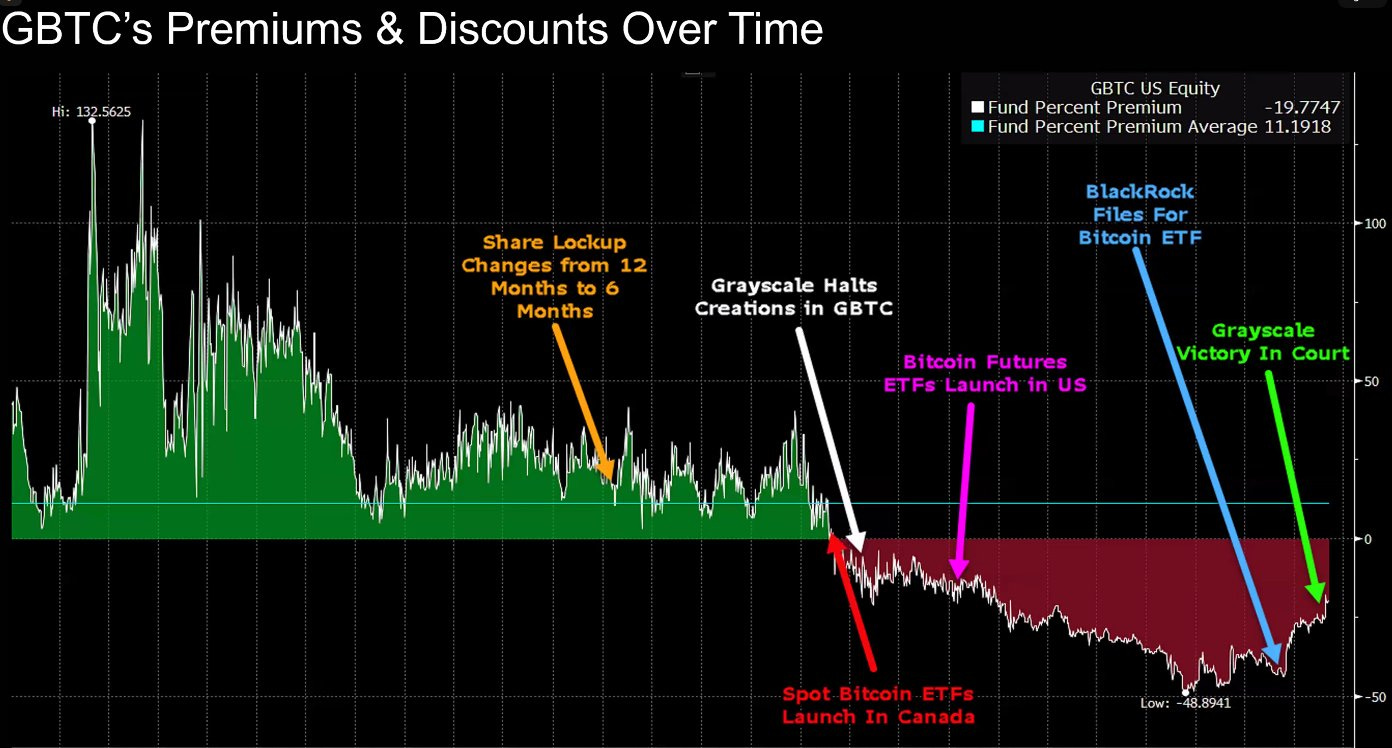
Grayscale Bitcoin Trust (GBTC) timeline
-
catalysts driving up & down its premium/discount trading, currently -19% discount
-
quite a story with another chart that say 10,000 words
-
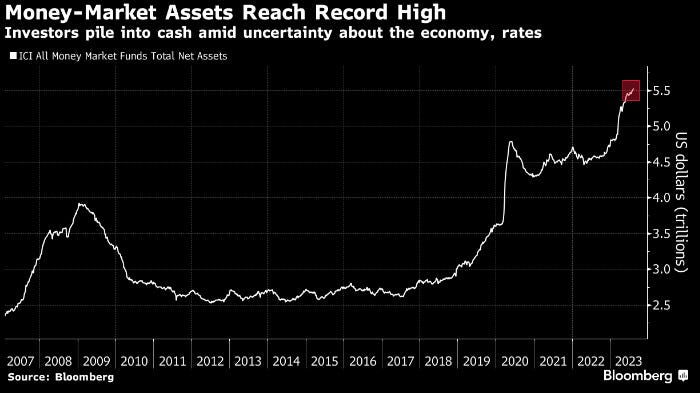
Money Market assets since 2007
👉 record high $5.5 trilliones
👉 with high interest rates, they pay …
-
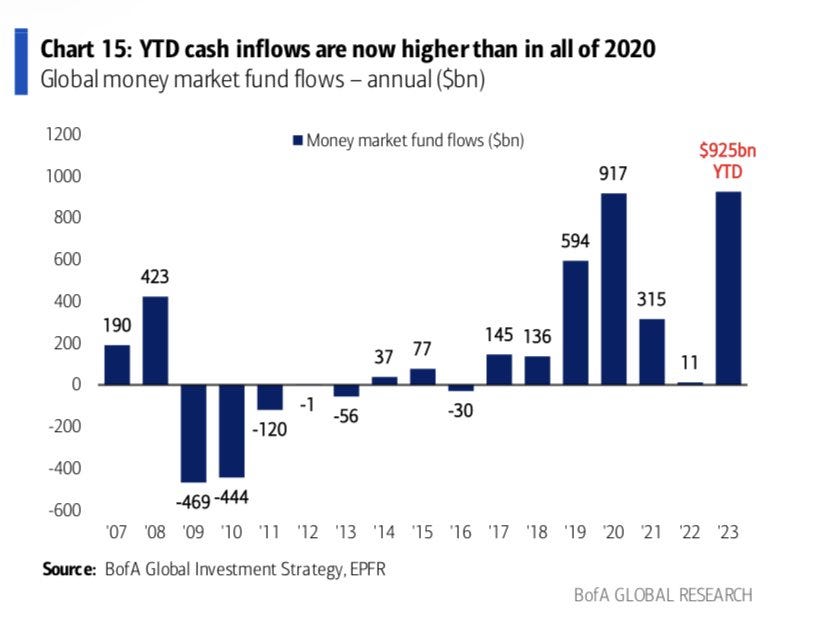
Global Money Market annual inflows
-
2023 inflows already higher than all 2020 covid panic
-
“About $40 billion poured into US money-market funds in the week through Aug. 16.…Total assets reached $5.57 trillion, versus $5.53 trillion the previous week.”
Research is NOT behind a paywall & no pesky ads here. What would be appreciated?Just sharing it around with like-minded people. In case not already, subscribe to get all the future research straight to your inbox. Twitter thread can be read here.
Thank you & have a great day!
Mav
