AI: From 'Mag 7' to 'Batmmaan'. RTZ #591
The Bigger Picture, Sunday, January 5, 2025
We’re now into the New Year, and I’ve put out my year-end 2024 overview, and general expectations for 2025. For investors, it’s helpful to take a snapshot of where we are in the financial markets in the early days of the New Year. Especially as the AI Tech Wave accelerates into 2025. That is the ‘Bigger Picture’ I’d like to discuss this Sunday, since tomorrow the public markets kick off in earnest.
Barron’s lays out the landscape with a useful ‘Batmmann’ framework, updating the big tech ‘Magnificent 7’ basket used for most of last year. In particular, they’re adding Broadcom to the list, as it crossed the trillion dollar market cap threshold late last year (links below mine):
“A new entrant in the Big Tech club of stocks means it’s time for a new name to describe tech’s largest companies. What was once FANG, and then Faang, Famang, and most recently Magnificent Seven, is now best labeled as Batmmaan. The new group consists of Broadcom, Apple, Tesla, Microsoft, Meta, Google (Alphabet), Amazon, and Nvidia. All of them carry market values above $1 trillion.”
“The eight stocks were up by an average of 66% in 2024 versus the S&P 500 index performance of 23%. Excluding the Batmmaan stocks, the index was up just 12% last year.”
And they single out Nvidia for its relative valuation, a name I’ve obviously focused on at length in these pages last year, despite investor concerns on competition from its best customers.
“The new year is a good time to step back and ask investors’ most important question: which of these stocks are overvalued. Surprisingly, the highest flier of 2024 may be the only one that remains undervalued.”
“Nvidia shares were up 171% in 2024, but according to estimates from Wall Street analysts, Nvidia is far from overvalued.”
I’ve covered my view of Nvidia’s long term moat:
They then go onto to outline the relative performance and valuations to date:
“The PEG ratio tells the story. The metric was devised by legendary investor Peter Lynch to compare a company’s price-to-earnings ratio with its projected earnings growth. The classic P/E multiple tells investors how rich a stock price is relative to earnings. But that ratio requires more context. One company with a P/E of 30 and an expected earnings growth rate of 30% looks far different than another 30 P/E company that has an earnings growth of 15%. Lynch used PEG—P/E divided by expected growth—to show the difference.”
“Lynch’s framework is that if the ratio of P/E to earnings growth is above 1, then the stock may be overvalued, while a PEG below 1 shows a potentially undervalued stock.”
Barron’s lays out a useful chart that highlights Nvidia’s PEG ratio at 0.6 vs over 1.3 for Broadcom, 1.4 for Amazon, 1.8 for Alphabet/Google and Apple, 1.9 for Meta, 2.3 for Microsoft, and 3.2 for Tesla:
“According to the analyst consensus for 2025 earnings, Nvidia has a P/E of 31 using 2024’s closing price. But those same analysts are projecting that Nvidia earnings will grow 52% in 2025. With a PEG ratio of 0.6—a Batmmaan low—Nvidia still looks inexpensive. Of the eight stocks, only Nvidia has a PEG ratio below 1.”
“(Since tech companies often use different fiscal years, this analysis uses FactSet’s calendar year estimates to ensure an apples-to-apples comparison.)”
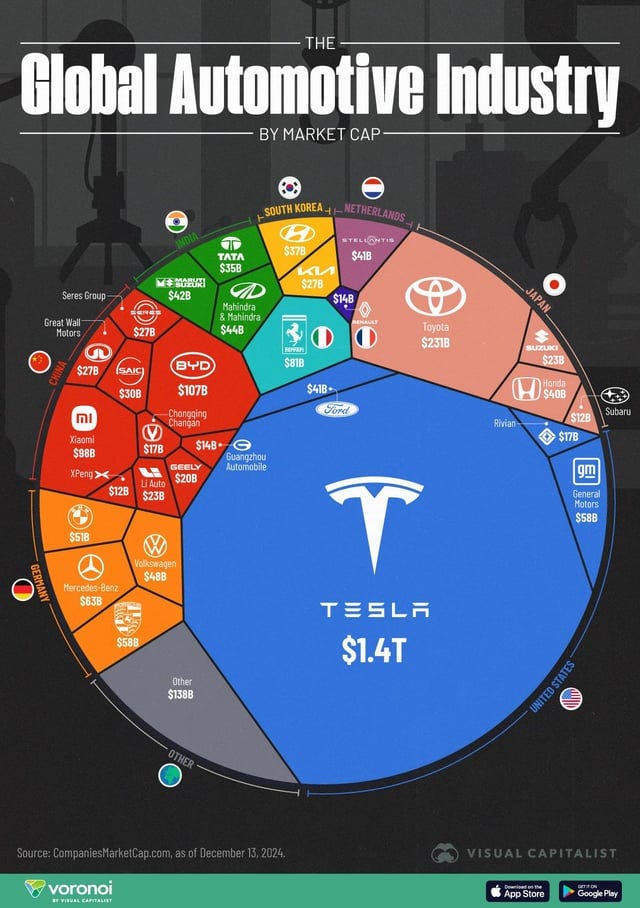
Tesla is the valuation outlier at the top end right now, with a $1.4+ trillion valuation that is greater than ALL the auto companies in the world currently.
A bit of an echo of Japan in the late 1980s, when the real estate around Tokyo’s Imperial Palace was ‘worth’ more than California. But a louder echo in the current ‘meme stock’ environment.
Barron’s outlines it as follows:
“At the other end of the spectrum is Tesla, with a share gain of 63% in 2024. Analysts are projecting a bounce back for Tesla sales after a decline in 2024. Though a 37% earnings growth projection from Wall Street is strong, it’s exceeded by Tesla’s 2025 P/E of 121, leading to a PEG ratio of 3.2, the highest of the group. Tesla has long traded with high valuation metrics, and it could keep going through the year, especially if the company benefits from new Trump administration policies.”
Then goes onto cover the others:
“Broadcom stock was the second highest flier in 2024, after Nvidia, up 108%. The analyst consensus is for 28% earnings growth in 2025, but Broadcom carries a 2025 P/E ratio of 35 times, leading to a PEG ratio of 1.3. That’s over double Nvidia’s, but it’s also the second lowest of the group.”
“The 2024 Batmmaan laggard was Microsoft, with shares up 12% on the year, it was the only member of the group that underperformed the S&P 500. Some investors may now see Microsoft as underpriced, but analyst expectations tell a different story. Wall Street forecasts 2025 earnings growth of 13% for Microsoft. That growth is less than five of the other seven Batmmaan companies, and less than expectations for the S&P 500. Microsoft’s consensus 2025 PEG ratio is 2.3.”
“The other two companies with earnings growth at the low end of the group are Alphabet and Meta. They have PEG ratios of 1.8 and 1.9, respectively. Apple and Amazon are projected to have better growth, giving them PEGs of 1.8 and 1.4, respectively.”
With some other qualitative items for context:
“There are several caveats to this analysis. First, all of these numbers are based on analysts’ projections for 2025, and they may turn out to be wrong, as is frequently the case. Many things will happen this year that can’t be predicted at the beginning of January, and no one can say with accuracy what sentiment will look like at the end of the year. A new administration in the White House increases the uncertainty.”
“Second, PEG is but one metric, even if it takes into account price, earnings and earnings growth. There are many factors that go into a stock’s price beyond valuation metrics, particularly the intangible concept of investor sentiment. For example, there is speculation that Tesla CEO Elon Musk’s close relationship with President-elect Donald Trump will work to the company’s advantage. That’s led to a rally for the stock, pushing valuation metrics up. Before Trump’s election in November, Tesla stock was up only 1.2% on the year. It rallied to end the year, up 61%. In mid December, it was up 91%.”
“Should Musk and Trump have a falling out, or if Musk’s position as a Trump advisor yields no material advantage to Tesla, sentiment may turn. That’s not a factor that gets picked up in any analyst model.”
I’ve provided my context around the political environment going into this new year.
Barron’s ends their piece as follows:
“Finally, there’s no guarantee that a high valuation will translate into poor performance in the near term. As 1998 turned to 1999, many analysts warned that stocks were overvalued, and by many metrics they were. But the S&P was still up 21% in 1999, and the dot-com crash didn’t begin until September 2000. Many so-called value investors missed out on a lot of the rally.”
“The danger in taking too much signal from valuation metrics is lost upside in the near term. Still, in the long-term valuation metrics are investors’ best tool.”
Overall, it’s a timely snapshot of the absolute and relative performance metrics of the top public names, as this AI Tech Wave proceeds into the new year. And a useful ‘Bigger Picture’ ahead of the next four quarters. Stay tuned.
(NOTE: The discussions here are for information purposes only, and not meant as investment advice at any time. Thanks for joining us here)


