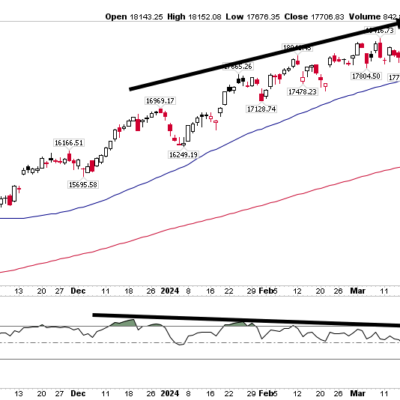
Daily Chart Report 📈 Thursday, March 28, 2024
Powered By:
Today’s Summary
Thursday, March 28, 2024
Indices: Russell 2000 +0.48% | Dow +0.12% | S&P 500 +0.11% | Nasdaq 100 -0.14%
Sectors: 8 of the 11 sectors closed higher. Energy led, gaining +1.08%. Consumer Discretionary lagged, falling -0.31%.
Commodities: Crude Oil futures rose +2.24% to $83.17 per barrel. Gold futures rose +1.16% to an all-time high of $2,238 per oz.
Currencies: The US Dollar Index rose +0.23% to $104.54.
Crypto: Bitcoin rose +1.99% to $70,803. Ethereum gained +1.78% to $3,561.
Volatility: The Volatility Index rose +1.80% to 13.00.
Interest Rates: The US 10-year Treasury yield rose to 4.206%.
Here are the best charts, articles, and ideas shared on the web today!
Chart of the Day
Normally, after we see big stock market crash events and we get back to 80% or more S&P 500 stocks above their 200-day, this trend tends to continue for some time…
Strength begets strength…
Guess what… we just crossed 80%…
Is this time going to be different? pic.twitter.com/p6wTBhNkvy
— Grant Hawkridge (@granthawkridge) March 28, 2024
 Today’s Chart of the Day was shared by Grant Hawkridge (@granthawkridge).
- The S&P 500 closed at a record high today, concluding a positive week, month, and quarter.
- As of today, 86% of S&P 500 stocks are above their 200-day moving averages, marking the first weekly close above 80% since August 2021.
- Grant points out that when breadth returns to healthy levels ( >80%) after a washout, it often stays elevated for several months or even years before deteriorating.
The takeaway: The S&P 500 survived on narrow breadth, but it could thrive now that more stocks are participating.
Quote of the Day
“When you analyze happiness, it turns out that the way you spend your time is extremely important.”
– Daniel Kahneman
Top Links
Here Comes the Usually Bullish Month of April – Carson Group
Ryan Detrick examines how stocks have historically performed in April.
Can the Spring Melt Up Continue – LPL Financial Research
Adam Turnquist looks at what could be next for the S&P 500 after a five-month winning streak.
Materials Break Out – All Star Charts
Alphonso Depablos highlights the Materials sector.
Stock Market Video Analysis for Week Ending March 28, 2024 – Alphatrends
Brian Shannon breaks down this week’s price action and key levels to watch next week.
Fed Rate Pause Reaches 8-Months, What’s Next? – Strategas Asset Management
Todd Sohn shares some key insights about the current market environment.
Top Tweets
Presenting your Q1 2024 heatmap. $SPY
Best first quarter performance for the S&P 500 since 2019
pic.twitter.com/fv6WY0rdYa
— TrendSpider (@TrendSpider) March 28, 2024
For just the 8th time since 1950 the S&P 500 posted back-to-back quarterly gains of 10%+.
Slice and dice the data however you want – the key takeaway is strength begets strength. pic.twitter.com/oY85ofXzaZ
— Willie Delwiche, CMT, CFA (@WillieDelwiche) March 28, 2024
That’s a 5-month winning streak for the S&P 500.
I’ve shared this table a ton of the last decade, but here’s the latest version.
(Fun to share since we can note how the last instances was unlike the others one year out). $spx pic.twitter.com/PO590wvhDe
— Steve Deppe, CMT (@SJD10304) March 28, 2024
Weekly RSI is flirting with 80…
Can it go higher? Yes it did in the smooth 2017 run
Can it stay there longer? It sure did in 1995 the only “soft landing” era that shares a lot with 2024.
The RSI stayed overbought the whole year for a total S&P return of 34%! pic.twitter.com/oLmPtWVNpW— conradseric, CMT, CAIA, CEFA (@conradseric) March 28, 2024
First new ATH in 2 yrs for staples today. This is no rotation to safety; it continues to lag the market (bottom panel) pic.twitter.com/oQpXRgILyZ
— Urban Carmel (@ukarlewitz) March 28, 2024
Materials just registered their 10th consecutive week of gains, the longest streak on record since the launch of sector SPDR $XLB (Dec 1998) pic.twitter.com/T9UWuMaSuB
— Steven Strazza (@sstrazza) March 28, 2024
$XLE best monthly close in almost a decade pic.twitter.com/gtzpYSgU6Y
— Mike Zaccardi, CFA, CMT
(@MikeZaccardi) March 28, 2024
Monthly Rus – for real this time! pic.twitter.com/yAXCqgVBXQ
— Linda Raschke (@LindaRaschke) March 28, 2024
Gold New all-time highs pic.twitter.com/AvwMr4FV7A
— J.C. Parets (@allstarcharts) March 28, 2024
With two days left in March, this will likely be one of the most significant monthly bars in the history of the Gold chart. $GC_F $GLD $PHYS pic.twitter.com/jCpIyqncA5
— Peter Brandt (@PeterLBrandt) March 28, 2024
Can you guess what’s the worst-performing stock in the S&P 500 YTD?
I’ll give you a hint. Yes, it’s what you think. pic.twitter.com/MOeCOtXLVz
— Eddy Elfenbein (@EddyElfenbein) March 28, 2024
You’re all caught up now. Thanks for reading!
The post Daily Chart Report 📈 Thursday, March 28, 2024 appeared first on The Chart Report.


