Daily Chart Report 📈 Friday, April 5, 2024

Powered By:

Today’s Summary
Friday, April 5, 2024
Indices: Nasdaq 100 +1.28% | $SPX +1.11% | Dow +0.80% | Russell 2000 +0.47%
Sectors: All 11 sectors closed higher. Industrials led, gaining +1.39%. Consumer Staples lagged but still ticked up +0.16%.
Commodities: Crude Oil futures rose for the sixth day, gaining +0.37% to a five-month high of $86.91 per barrel. Gold futures rose +1.60% to an all-time high of $2,345 per oz.
Currencies: The US Dollar Index inched higher by +0.07% to $104.29.
Crypto: Bitcoin fell -0.99% to $67,857. Ethereum inched lower by -0.30% to $3,319.
Volatility: The Volatility Index fell -1.96% to 16.02.
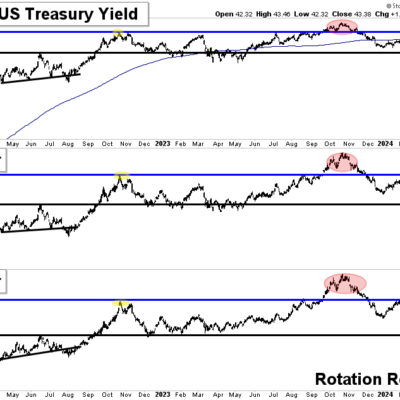
Interest Rates: The US 10-year Treasury yield rose to a four-month high of 4.404%.
Here are the best charts, articles, and ideas shared on the web today!
Chart of the Day
Semis vs. Commodities. $SOX $CRB.
KISS principle. pic.twitter.com/JJYlSFgAjs
— Brian G (@alphacharts) April 5, 2024
 Today’s Chart of the Day was shared by Brian G (@alphacharts)..
- This ratio chart of Semiconductors vs. Commodities represents the battle between two narratives that have dominated the headlines in recent years: “The A.I. Boom” and Inflation.
- AI stole the spotlight from inflation last year as Semis exploded higher, but inflation is rearing its ugly head again as Commodities have perked up recently.
- This is exactly where Semis began to underperform Commodities in 2021. If this ratio continues to be rejected at its former highs, inflation will likely dominate the headlines again. However, a breakout would reignite the AI narrative.
The takeaway: The narrative is at a potential inflection point. To quote the legendary Paul Tudor Jones: “Price turns, and then the narrative follows.”
Quote of the Day
“To become a master trader, you must first be a successful loser.”
– Jeff Horn
Top Links
Stock Market, Bitcoin and Ethereum Analysis April 5, 2024 Alphatrends Anchored VWAP – Alphatrends
Brian Shannon breaks down this week’s price action and key levels to watch next week.
Commodities > Stocks > Bonds – All Star Charts
JC Parets looks at Commodities relative to Stocks and Bonds.
Energy is on Fire – StockCharts
Julius de Kempenaer highlights the recent rotation into the Energy sector.
Real Estate Stocks Continue to Depress – Grindstone Intelligence
Austin Harrison drills into the Real Estate sector.
Quiet Optimism Outweighing Bond Market Moves – Hi Mount Research
Willie Delwiche shares some key takeaways from the current market environment.
Top Tweets
Red week for $SPY with the Energy sector as the star of the show
pic.twitter.com/d3yzfOL2cd
— TrendSpider (@TrendSpider) April 5, 2024
SPX bearish engulfing this week pic.twitter.com/MpQkwabpfU
— Mike Zaccardi, CFA, CMT
(@MikeZaccardi) April 5, 2024
Doesn’t look like we will go into the weekend with a cliffhanger wondering whether the market is going to truly roll over or not.
The $SPX jumped back above the floor of that 4-month channel and 20-day SMA. Also an interesting ‘inside day’ candle pic.twitter.com/5dJAjQm4vG
— John Kicklighter (@JohnKicklighter) April 5, 2024
The biggest question now is this for $SPX:
Was yesterday’s bearish engulfing pattern more like 7/27/23, which led to the 11% correction over the ensuing three months?
Or…
Will it turn into something like the 12/20/23 version, which now is undetectable within the… pic.twitter.com/I4pcVWVVbC
— Frank Cappelleri (@FrankCappelleri) April 5, 2024
$XLE – Energy breakout being confirmed by RSI on the weekly chart. pic.twitter.com/KGz2YrT2RX
— Larry Thompson (@HostileCharts) April 5, 2024
Crude Oil forms a Golden Cross for the first time since August. The last Golden Cross sent Crude Oil soaring by 20%. pic.twitter.com/VdEyo5Xhha
— Barchart (@Barchart) April 5, 2024
Equities have posted a smaller drawdown than Treasuries through 3-months of 2024. Speaking of bonds, it’s now been 44-months without a new all-time high for Bloomberg Agg – that’s approaching 3x the prior record of 16-months. pic.twitter.com/bCBSnioXeP
— Todd Sohn (@Todd_Sohn) April 5, 2024
And now a reaction on the other side of the fence…$DXY pic.twitter.com/I4RSEOgxAW
— Ian McMillan, CMT (@the_chart_life) April 5, 2024
#Bitcoin is basically making a textbook coil pattern of lower highs and higher lows. The legend John Murphy says look for a breakout around 2/3-3/4 of the way through the pattern. Feels like we’re right about there! pic.twitter.com/GijUHMxp0u
— David Keller, CMT (@DKellerCMT) April 5, 2024
Two revolutionary companies went public twenty years ago. These are their returns since…
Google: +6,080%
Domino’s Pizza: +8,200%$GOOGL $DPZ pic.twitter.com/cNr6nIhIOL— Charlie Bilello (@charliebilello) April 5, 2024
You’re all caught up now. Thanks for reading!
The post Daily Chart Report 📈 Friday, April 5, 2024 appeared first on The Chart Report.