
Daily Chart Report 📈 Monday, April 22, 2024

Powered By:

Today’s Summary
Monday, April 22, 2024
Indices: Nasdaq +1.02% | Russell 2000 +1.02% | S&P 500 +0.87% | Dow +0.67%
Sectors: All 11 sectors closed higher. Financials led, gaining +1.21%. Materials lagged but still inched higher by +0.10%.
Commodities: Crude Oil futures fell -0.39% to $81.90 per barrel. Gold futures dropped -2.79% to $2,346 per oz.
Currencies: The US Dollar Index was flat (-0.04%) at $106.12.
Crypto: Bitcoin rose +2.93% to $66,855. Ethereum gained +1.69% to $3,202.
Volatility: The Volatility Index dropped -9.47% to 16.93.
Interest Rates: The US 10-year Treasury yield fell to 4.611%.
Here are the best charts, articles, and ideas shared on the web today!
Chart of the Day
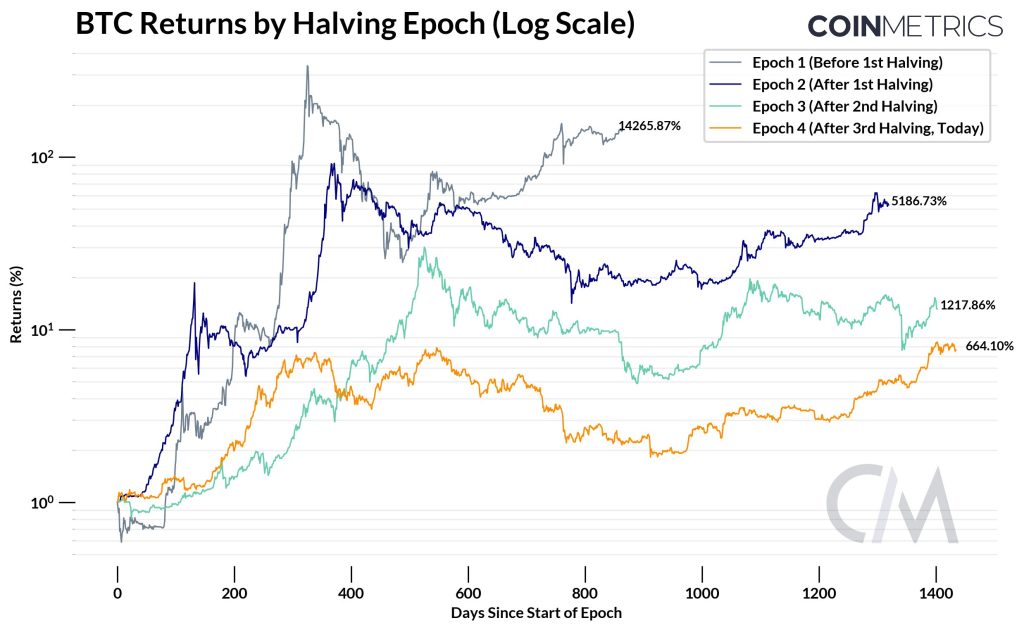
 Today’s Chart of the Day was shared by CoinMetrics (@coinmetrics).
- Bitcoin completed its fourth Halving over the weekend. It went into the weekend on thin ice, testing the prior cycle highs at $65k. However, it refused to break down.
- Bitcoin Halving is a form of monetary policy written into its code to occur every four years to control inflation. With each halving, the reward for mining each block is cut in half, ultimately limiting supply and driving prices higher over time.
- The chart compares the four Halving “epochs.” Bitcoin has historically surged in the first 1-2 years after the event. Rallies have become less spectacular with each successive Halving, but we’re still talking about triple-digit returns (or better).
The takeaway: The media treats Halving as a binary event or an overnight catalyst. In reality, the impact has been more gradual. Halving has created a well-defined cycle in the Crypto markets. Will history repeat? Or is this time different?
Quote of the Day
“The four most dangerous words in investing are: this time it’s different.”
– John Templeton
Top Links
Passing The Test? – Trading Adventures
Andy Moss highlights some key developments to watch this week.
Volatility Is Back: Understanding Ever-Changing Market Narrative – LPL Financial Research
Adam Turnquist examines the macro/technical backdrop.
XBI – April 20, 2024 – Bart’s Charts
James Bartelloni looks at a potential Head & Shoulders top in the Biotech ETF, $XBI.
The Corrective Phase Could Last Into the Early Summer Months: Fairlead Strategies’ Katie Stockton – CNBC
Katie Stockton discusses the recent technical damage across the stock market.
What’s it like to be a NYSE Floor Trader? | Off The Charts interview with Jay Woods – Stock Market TV
Steve Strazza and Sean McLaughlin interview Jay Woods, Chief Global Strategist at Freedom Capital Markets.
Top Tweets
The Zweig Breadth Thrust setup has begun!
We surely couldn’t get three thrusts in just over a year… This signal is meant to be super rare!
pic.twitter.com/C83X4LGpA2
— Grant Hawkridge (@granthawkridge) April 22, 2024
Last Friday was best day for equal-weighted S&P 500 relative to cap-weighted S&P 500 since March 2021
[Past performance is no guarantee of future results] pic.twitter.com/m4KkNTB7ql— Liz Ann Sonders (@LizAnnSonders) April 22, 2024
$VIX top panel. S&P 500 bottom panel. $SPX pic.twitter.com/kv3RFdJd7b
— Chris Ciovacco (@CiovaccoCapital) April 22, 2024
Energy ETF $XLE bouncing off major support level here. pic.twitter.com/m0cMAnTJ69
— Justin Spittler (@JSpitTrades) April 22, 2024
More breakout in financials today: $AXP $SCHW $WFC pic.twitter.com/G48wo80R4W
— Larry Tentarelli, Blue Chip Daily (@bluechipdaily) April 22, 2024
The Capital Markets group has endured a long and brutal Bear market.
Underperformed the S&P for the past 18 years.
This is about to end … any day now!
Do you know who just broke out to an all-time high?
Goldman Sachs!
Chamath was going to buy it and rename it … but… pic.twitter.com/AmZomakN4S
— Amol Desai (@LatticeworkInv) April 22, 2024
For only the 21st time since 1973, the S&P 500 Financials sector registered a gain of over 1%, whereas the S&P 500 Technology sector experienced a decline exceeding -3%. pic.twitter.com/RJyZf2gdA0
— Dean Christians, CMT (@DeanChristians) April 22, 2024
If $SMCI were to retest the January breakout level, it would still have to fall another -47% from here.
pic.twitter.com/HhnuJe35qj
— TrendSpider (@TrendSpider) April 22, 2024
Gold $GLD worst day since Feb 2023 pic.twitter.com/PFhJxgbtFu
— Mike Zaccardi, CFA, CMT
(@MikeZaccardi) April 22, 2024
Imagine missing this entire run the past 15 years, not even catching a part of it.#Bitcoin
Chart: @ChartsBtc pic.twitter.com/Y0w7lY5h4k
— Chris Perruna (@cperruna) April 22, 2024
You’re all caught up now. Thanks for reading!
The post Daily Chart Report 📈 Monday, April 22, 2024 appeared first on The Chart Report.


