Daily Chart Report 📈 Monday, April 29, 2024
Powered By:
Today’s Summary
Monday, April 29, 2024
Indices: Russell 2000 +0.70% | Dow +0.38% | Nasdaq 100 +0.36% | S&P 500 +0.32%
Sectors: 9 of the 11 sectors closed higher. Consumer Discretionary led, gaining +2.33%. Communications lagged, falling -1.16%.
Commodities: Crude Oil futures fell -1.45% to $82.63 per barrel. Gold futures rose +0.45% to $2,358 per oz.
Currencies: The US Dollar Index dropped -0.42% to $105.64.
Crypto: Bitcoin rose +1.16% to $63,832. Ethereum fell -1.47% to $3,215.
Volatility: The Volatility Index fell -2.26% to 14.68.
Interest Rates: The US 10-year Treasury yield fell to 4.616%.
Here are the best charts, articles, and ideas shared on the web today!
Chart of the Day
Semiconductor ETF $SMH closed above its 50d sma for the first time in two weeks.
That’s a start…
But don’t forget. $AMD and $SMCI report earnings tomorrow. That will obviously have a big impact on the group. pic.twitter.com/WzR1T6OpsV
— Justin Spittler (@JSpitTrades) April 29, 2024
 Today’s Chart of the Day was shared by Justin Spittler (@JSpitTrades).
- Semiconductors led last week, with $SMH having its best week in nearly a year (+9.3%). However, $SMH tumbled -9.7% the week before, marking its worst in two years.
- Justin points out that $SMH is testing its 50-day moving average from below while two prominent Semiconductor stocks, $AMD and $SMCI, report earnings tomorrow evening.
- $AMD represents less than 4% of $SMH, while $SMCI isn’t even in the ETF. However, both companies will likely set the tone for the entire group.
The takeaway: The Semiconductor ETF ($SMH) has returned to the scene of the crime ahead of tomorrow’s data dump. If $SMH resolves higher, the broader market will likely follow.
Quote of the Day
“Buy when everyone else is selling and hold when everyone else is buying. This is not merely a catchy slogan. It is the very essence of successful investments.”
– J. Paul Getty
Top Links
Stocks Are Tight Ahead Of Earnings, FOMC, and Jobs Data – Trading Adventures
Andy Moss looks at how the markets are positioned as we kick off the busiest week of earnings season.
Trending… – MurphyCharts
Shane Murphy examines the long-term trend in the S&P 500.
Bears Get Whipsawed: What Does it Mean For Stocks? – Ciovacco Capital Management
Chris Ciovacco breaks down some of the latest trends across the markets.
Yen Crashing: What You Need to Know – All Star Charts
JC Parets shares his thoughts on the Japanese Yen after hitting a 30-year low.
Top Tweets
Nasdaq bulls knocking on the door at prior support…
Sellers need to hold for a support/resistance flip or else things get squeezy!
$QQQ pic.twitter.com/Tr62Zx3N7C
— TrendSpider (@TrendSpider) April 29, 2024
The Nasdaq 100 is testing previous-support-turned-resistance at 17,800 ahead of a MASSIVE week for economic data and earnings:
TUE: $AMZN earnings
WED: Fed Meeting
THU: ISM Manufacturing PMI, $AAPL earnings
FRI: #NFP, ISM Services PMI pic.twitter.com/OwoyeRNWDC
— Matt Weller CFA, CMT (@MWellerFX) April 29, 2024
It looks like this will be only the 22nd negative April (vs 53 positive) for $SPX since 1950. Here’s how the index has played out the rest of the year following a down April: pic.twitter.com/euqoy3cl9v
— Optuma (@Optuma) April 29, 2024
May is known for warmer weather, horse races, the intro to summer, and apparently green, a lot of green.
Did you know the S&P 500 was up 9 of the past 10 years in May? pic.twitter.com/DHYsMKGNXv
— Ryan Detrick, CMT (@RyanDetrick) April 30, 2024
The list of new 52-week lows are setting new year-to-date highs. We shouldn’t ignore that, but we also need to add some context – the number of new lows is still short of levels we saw throughout 2023: pic.twitter.com/n5Rg07Be6l
— Austin Harrison, CFA, CMT (@meanstoatrend) April 29, 2024
Treasury Bonds essentially stopped falling a couple weeks ago. Can they get above 89.50 and start to squeeze? $TLT pic.twitter.com/ZTned1ctqA
— J.C. Parets (@allstarcharts) April 29, 2024
The 2-10 Spread has been negative for nearly two years. pic.twitter.com/TV3L7S77Te
— Eddy Elfenbein (@EddyElfenbein) April 29, 2024
Long US dollar is a crowded trade with CFTC speculative positioning in the 99th percentile relative to the last twenty years, bearish for the dollar from a contrarian perspective (all else equal).@StoneX_Official pic.twitter.com/dVE217yt0E
— Kathryn Rooney Vera (@KRooneyVera) April 29, 2024
It’s been a yo-yo session for the yen overnight. After USDJPY traded above 160 overnight, it reversed and traded below 156. pic.twitter.com/Vb7SaqKxi6
— Bespoke (@bespokeinvest) April 29, 2024
spinoffs — so hot right now
Bloomberg’s US spinoff index is at an all-time high. top holdings are Constellation Energy, GE Vernova, GE HealthCare, etc pic.twitter.com/8M3CooMaJq
— Katie Greifeld (@kgreifeld) April 29, 2024
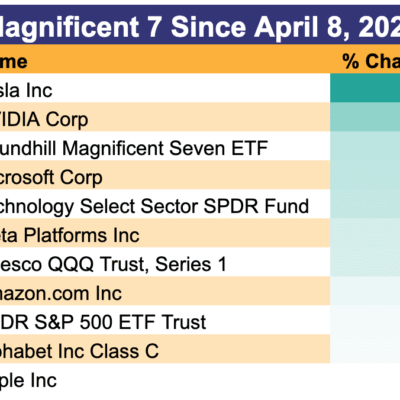
$TSLA +34% last 4 sessions pic.twitter.com/S4c0b5YR75
— Mike Zaccardi, CFA, CMT
(@MikeZaccardi) April 29, 2024
Legendary technical analyst Phil D. Gapp has been sent to a psychiatric hospital for observation. pic.twitter.com/U1rtZ8u6J2
— Walter Deemer (@WalterDeemer) April 29, 2024
You’re all caught up now. Thanks for reading!
The post Daily Chart Report 📈 Monday, April 29, 2024 appeared first on The Chart Report.


