Last night was my favorite thing that we do around here.
We had our LIVE Monthly Charts Strategy Session for Premium Members of ASC.
This hour-long, 150-chart Monthly ritual allows us to take a step back, zoom out, and identify the most important primary trends across markets.
There is nothing we do here that adds as much value to my process than preparing for this call.
Premium Members can watch the replay here and download all the slides.
If you’re not a Premium Member yet, you can fix that here quickly.
The bottom line is this:
Markets are a mess. They’ve been a mess. And this year is very different than last year.
Look at the Equally-weighted S&P500 and Nasdaq100.
While these are certainly good overall gauges for the health of the US Stock market, always, in this particular environment they are even more representative of what’s going on out there.
These indexes look an awful lot like many other stocks and indexes across the market.

So what’s the takeaway from all this?
For me, its just more about what we’ve been talking about.
This is not the greatest environment for many trend following strategies, like it was last year.
It’s the mean reverting strategies that are working best. It’s the strategies that take advantage of choppy, messy markets that we keep implementing.
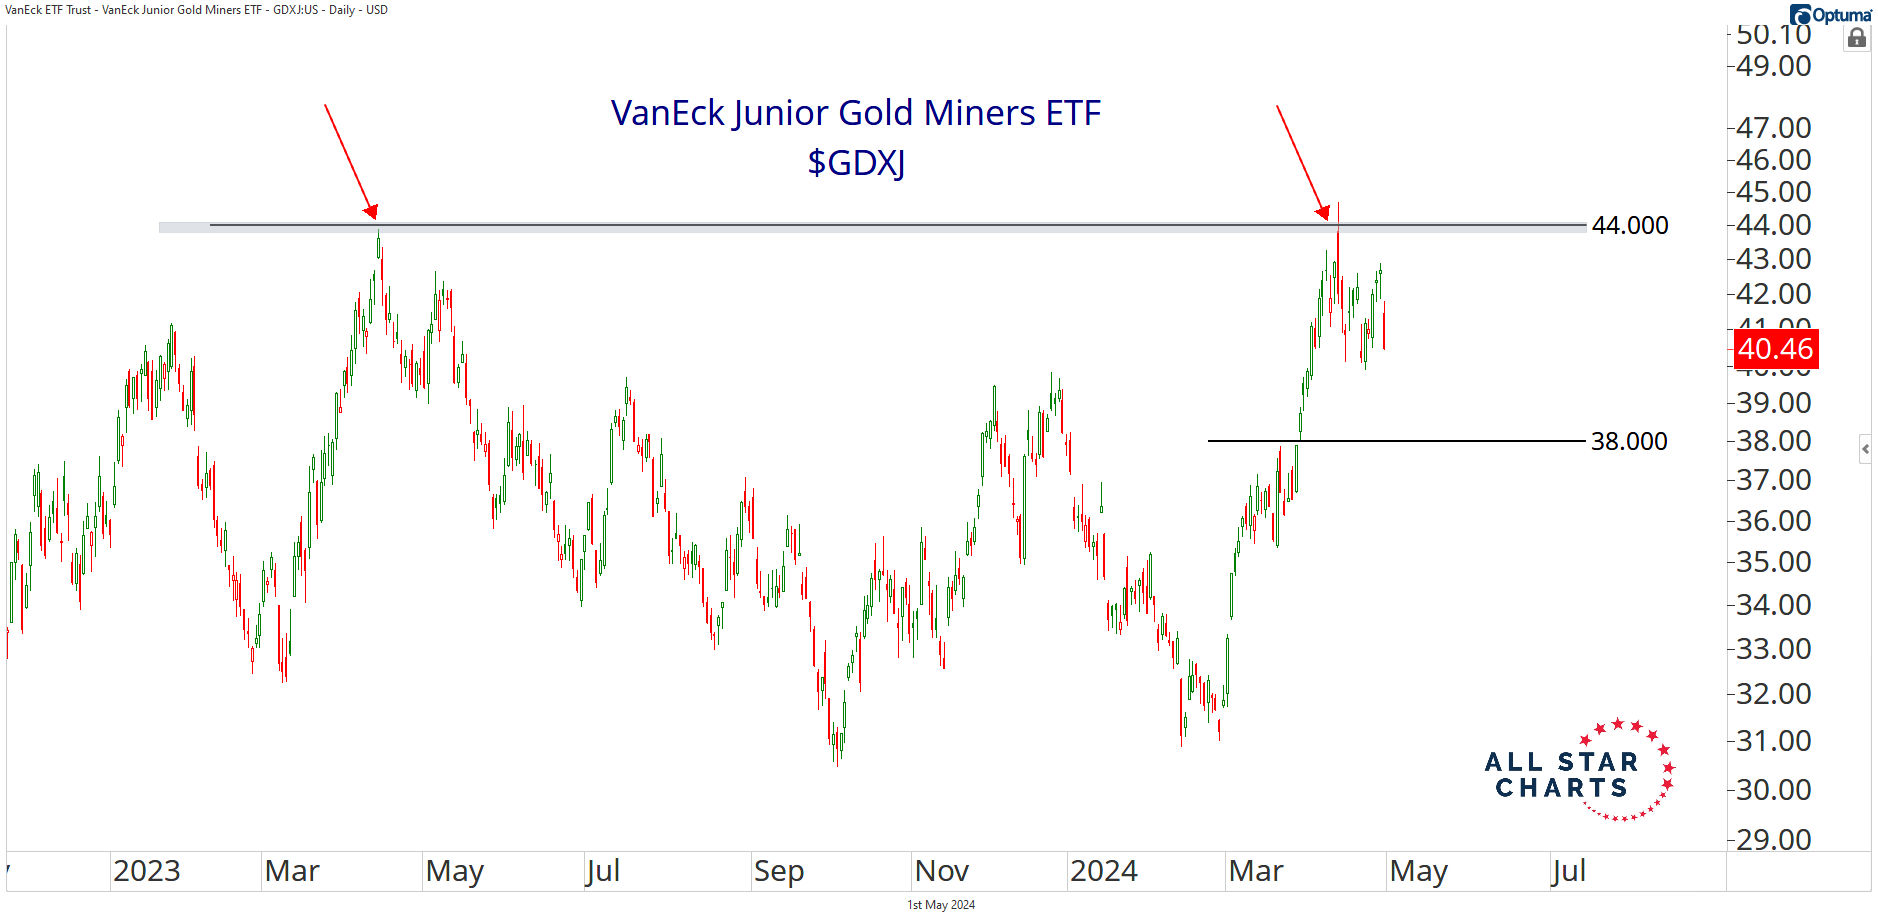
For example, yesterday we sold both the calls and the puts in the Junior Gold Miners ETF to collect additional income.

In many cases, volatility has come off so much in recent weeks that we’re not getting paid as much as we were a month or two ago to sell options.
But you can still find areas where implied volatility is elevated. We found that in the Junior Gold Miners ETF yesterday morning.
Every day we sort the 30 most liquid ETFs by the ones with the highest implied volatility.
In other words, we start with the ETFs that are paying us the most to sell its options.
Think about it. If we’re not getting paid much to sell options, then it’s not worth it for us to do it.
So then we just start the process with the ones paying us the most, and then work our way down from there.
Typically, we’ll look for an already messy rangebound market that fits the profile of the current market regime.
Messy overall market + messy individual market (stock or ETF) + high implied volatility = Collect the income.
That’s been the formula.
Last night we discussed what it would take for the market to get out of this messy situation and reenter an environment that looks a lot more like last year – filled with sector rotation and expansions in the new highs lists.
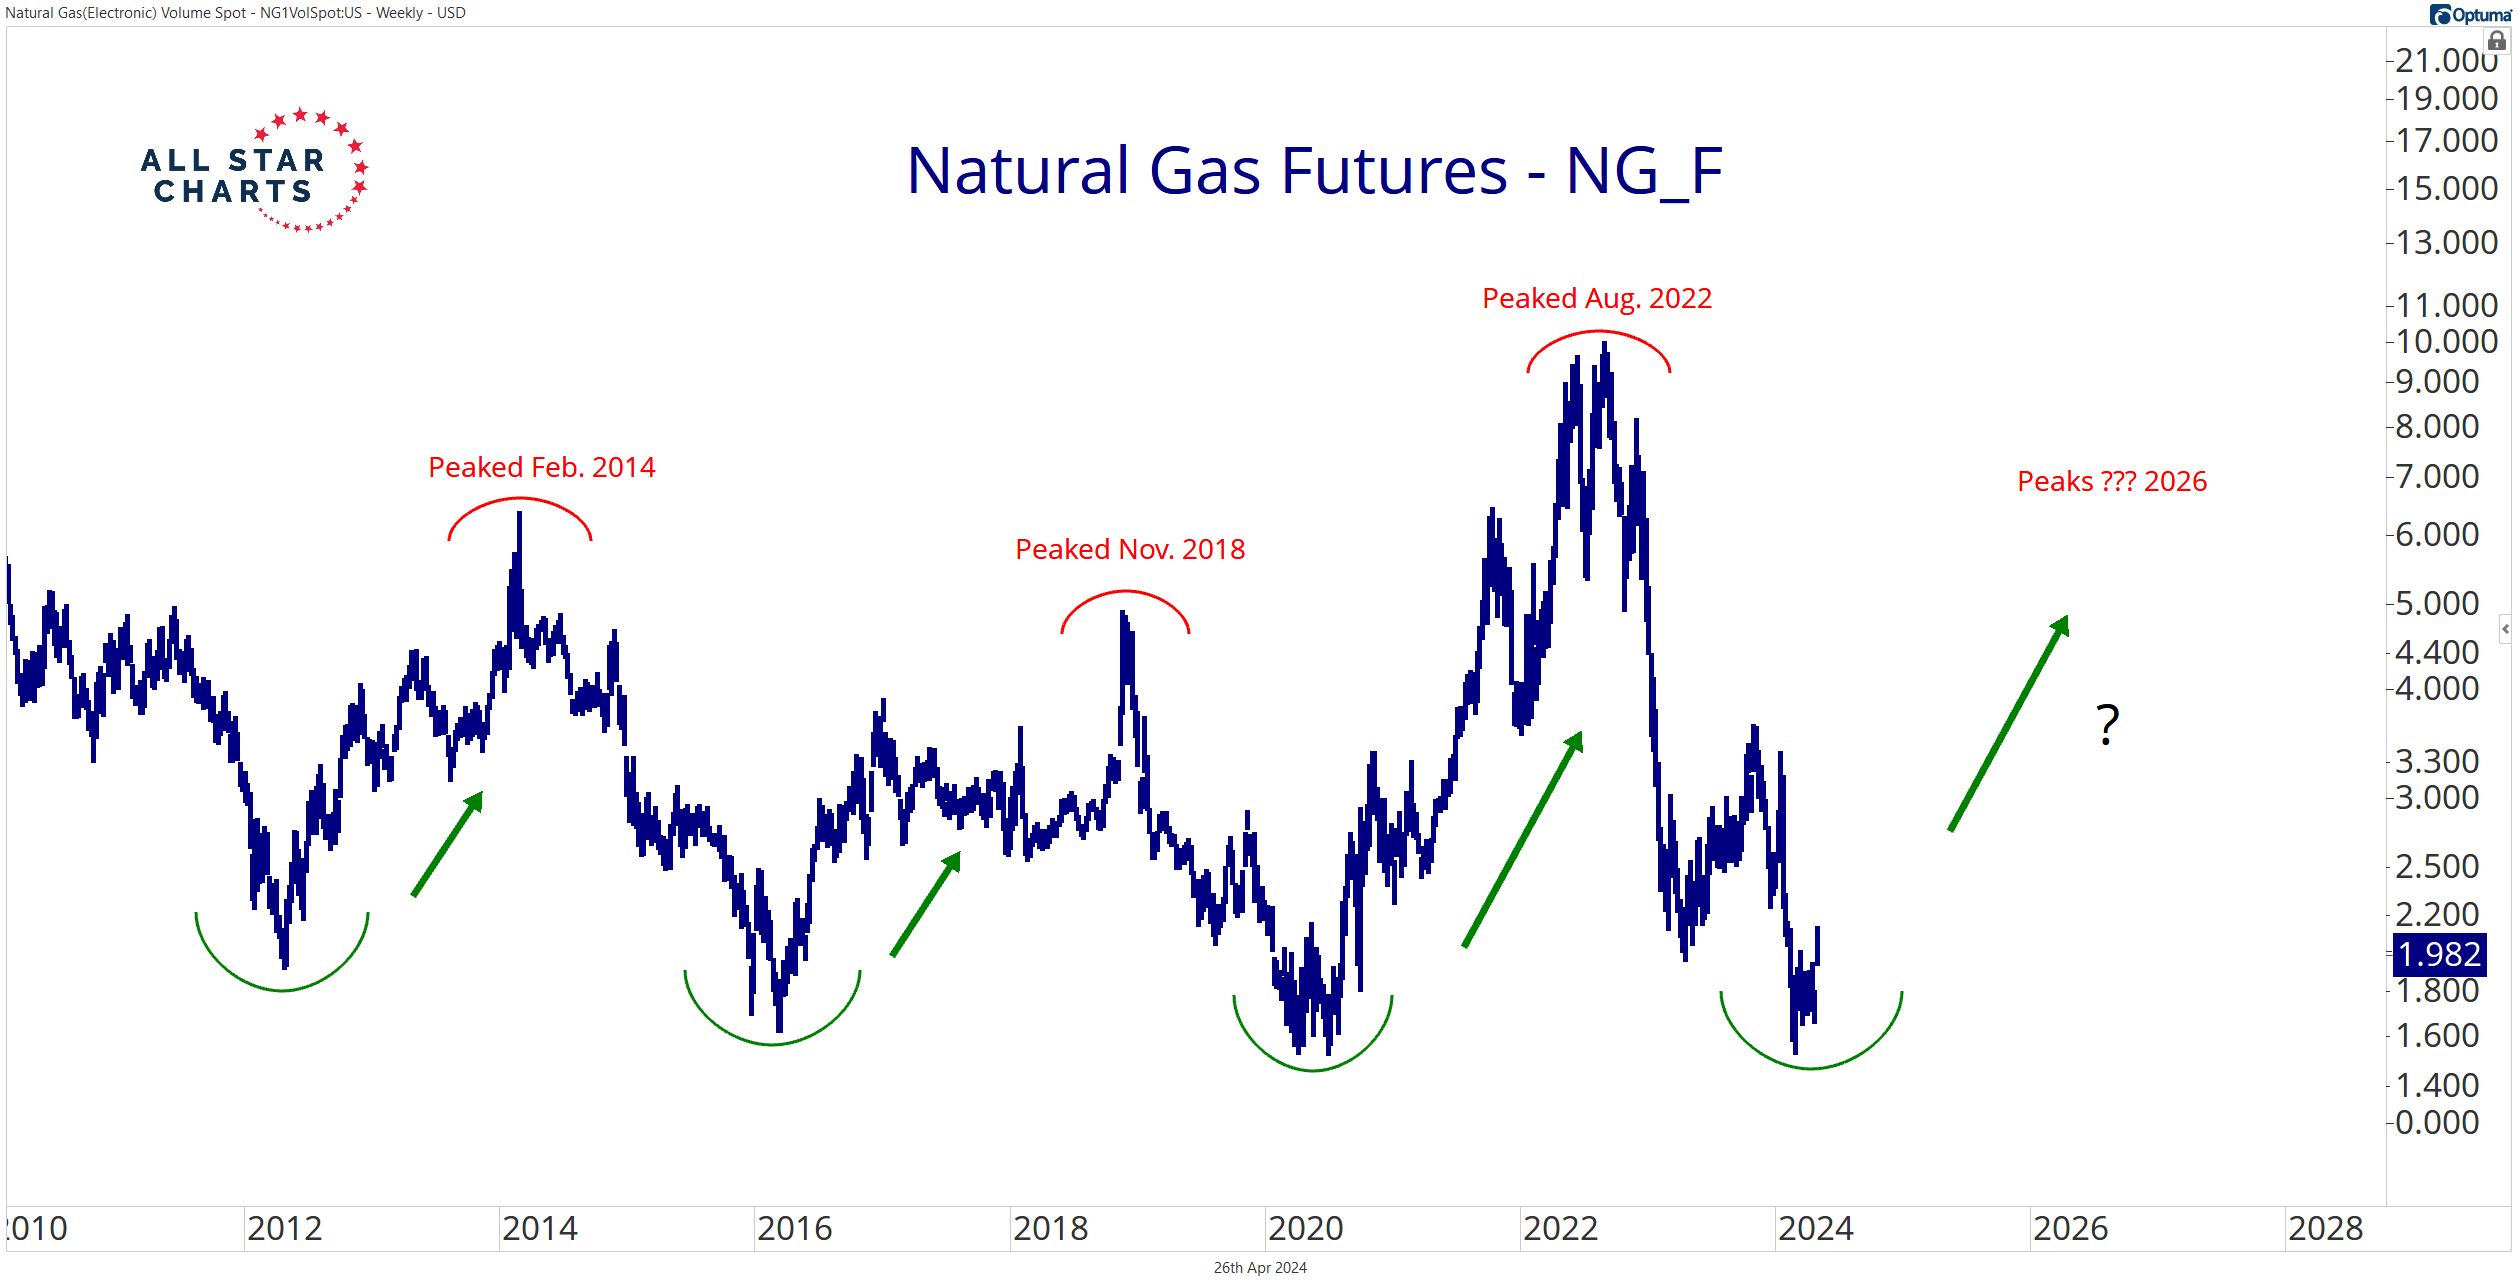
In the meantime, I like looking for less correlated trades, like Natural Gas for example.
This thing doesn’t trade like the S&P500. It doesn’t move with interest rates. Natural Gas doesn’t care about the powell or about any of your wars.
I like that, especially in this environment:

We know historically that these are great prices to be accumulating Natural Gas.
The key, however, is the timing.
We also know that historically, down at these prices, it’s usually a mess for a while before it ultimately gets going to the upside.
So when do we buy Natural Gas?
I have the strategy.
We discussed it last night in the Energy part of the conversation.
Premium Members check out the replay here and download all the slides.
If you’re not already a Premium Member, you can add it to your account here or just contact Mary directly and she’ll hook you up.
Also feel free to call in with any questions (323) 421-7910
Let me know what you think!
JC
The post How To Find the Trade appeared first on All Star Charts.

